Black-Scholes, Tested Against 7.5 Years of Real Option Chains: What the Famous Formula Gets Wrong — and Right
'The most powerful formula in finance' is making the rounds again. Instead of explaining it, we tested it: 1,872 daily QQQ option chains from our own recorded data. The 'constant volatility' assumption fails exactly as advertised (the smirk is visible in one chart), the formula's central number is a genuinely good forecast — better than history — and the one trade the story implies for retail loses after spreads. All three claims, measured.
A short video is making the rounds: the Black-Scholes equation “moves trillions every day,” it’s “the most powerful formula in finance,” but “constant volatility and no transaction costs aren’t a thing in the real world.” All true, as far as it goes. But every line of it is measurable, and we happen to record the raw material daily: 1,872 QQQ option chains, 2019–2026, every strike with bid/ask and implied volatility.
So instead of another explainer, here’s the formula put against real data — what it gets wrong, what it quietly gets right, and the one practical trap in the story.
Wrong, visibly: “one volatility” — the market refuses the assumption
Black-Scholes takes a single volatility σ per underlying and expiry. If markets believed that, implied volatility would be flat across strikes. Here’s what 7.5 years of real ~30-DTE QQQ chains actually show:
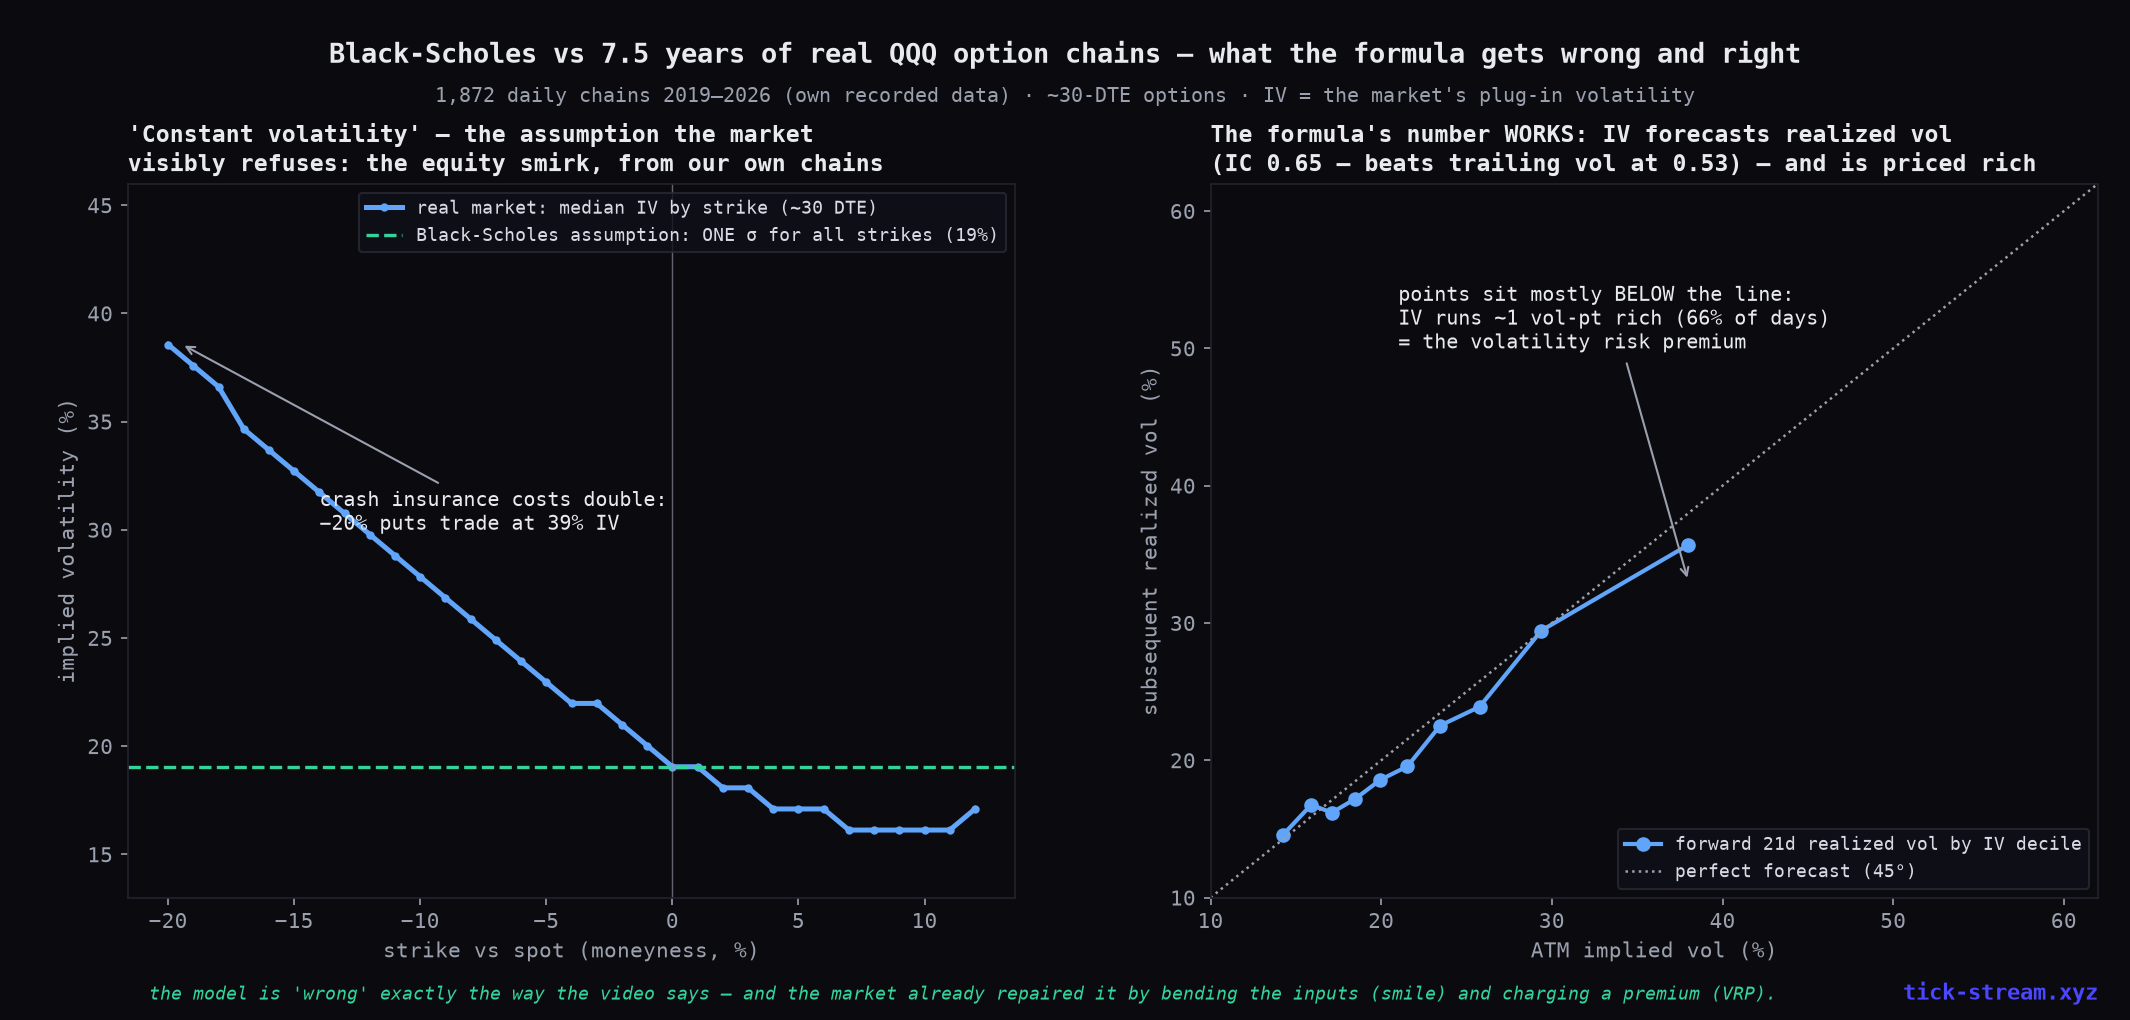
Puts 20% below spot trade at ~39% IV; at-the-money trades at 19%; upside calls at ~16%. Crash insurance costs double the model’s “fair” rate — the famous equity smirk, which has existed since the 1987 crash taught markets that returns have fat left tails. This is the textbook chart, except it’s not from a textbook: it’s from our own recorded chains. The market “fixed” Black-Scholes not by abandoning it but by bending its input — publishing its correction in the model’s own units.
Right, surprisingly: the formula’s number is a real forecast
The model’s central quantity — implied volatility — is the market’s forward estimate of how much the underlying will move. Is it any good? Across 1,856 days:
- Rank correlation between ATM IV and the next 21 days’ realized volatility: 0.65.
- The naive alternative — assuming tomorrow’s vol equals last month’s — scores 0.53. The market’s number beats history. (We found the same thing from the futures side: QQQ implied vol is one of the strongest forward inputs we’ve ever tested, and it powers our live Surge sleeve.)
- And it’s biased rich: IV exceeded subsequent realized vol on 66% of days, by ~1 vol point on average. That gap is the volatility risk premium — the fee option buyers pay for insurance.
So the “flawed” formula’s output is simultaneously a better-than-naive forecast and systematically overpriced. Both things are true, and the second one funds an industry.
The trap: “overpriced” ≠ harvestable (for you)
If options are rich 66% of the time, the obvious retail conclusion is sell them. We tested exactly that on the real chains: every month, sell the ~30-DTE ATM QQQ straddle at the actual bid (the price a taker really gets), hold to expiry, 89 straddles over 7.5 years:
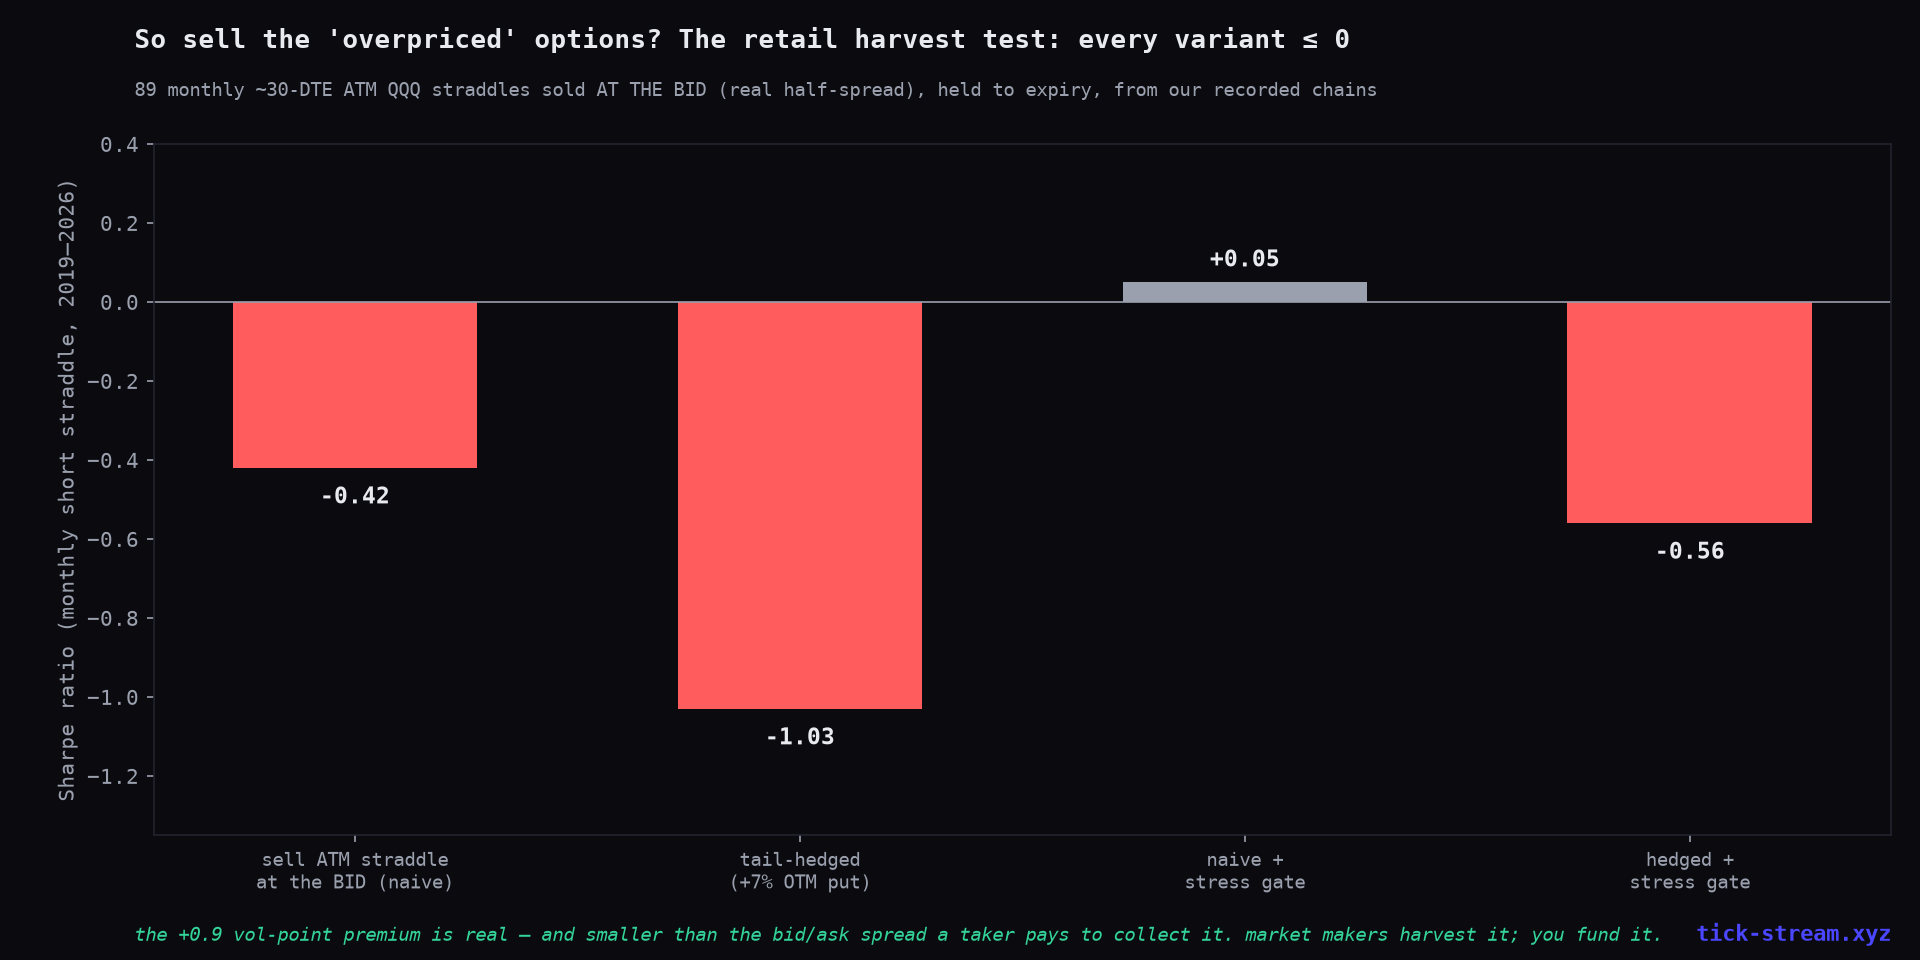
Naive: Sharpe −0.42. Tail-hedged with a 7% OTM put: −1.03 (the hedge is bought at the ask — insurance on your insurance). Gated to calm regimes: +0.05 — statistical zero. The one-point premium is real and smaller than the bid/ask spread you cross to collect it, and the occasional −10% month (there were several) removes what’s left. Market makers earn the premium because they capture the spread and hedge continuously; a retail seller crossing the spread funds it.
The honest summary
The video is right on every fact and silent on the practical one. Black-Scholes’ assumptions fail exactly as advertised — and the market has already priced those failures into the smile, so “the model is wrong” is not a trading edge. Its output is a genuinely strong vol forecast — which is why we use IV as an input (sizing, regime-gating) rather than as something to bet against. And the seductive trade its “overpricing” implies loses after real spreads. The most powerful formula in finance is best understood as the most powerful language in finance: everyone speaks it, everyone knows its grammar is broken, and the corrections are quoted in the language itself.
Methodology: QQQ option chains recorded daily 2019–2026 (1,872 sessions, all strikes, bid/ask/IV/greeks). Smile: median mid-IV by moneyness bucket, 25–40 DTE OTM composite, sampled across the last year. Forecast test: daily ATM IV vs subsequent 21-trading-day close-to-close realized volatility (annualized), Spearman rank correlation, vs trailing 21-day realized vol as benchmark. Harvest test: monthly ~30-DTE ATM straddle sold at the recorded bid, held to expiry, P&L = premium − |S_expiry − K|; hedged variant buys a 7% OTM put at the ask; stress gate skips entries during vol spikes; 2019–22 train / 2023–26 holdout checked.
Frequently asked questions
Is the Black-Scholes model accurate in the real world?
Its core assumption — one constant volatility per underlying — is visibly false: in 7.5 years of real QQQ chains, ~30-DTE puts 20% below spot trade at roughly 39% implied volatility while at-the-money options trade at 19%. That's the equity 'smirk', and it exists precisely because markets repaired Black-Scholes after 1987 by bending the volatility input per strike. But the framework itself — quoting prices in implied volatility — is how the entire market still communicates, which is why the formula remains 'the default' despite its known flaws.
Does implied volatility actually predict realized volatility?
Yes, surprisingly well. Across 1,856 trading days, ATM implied volatility predicted the next 21 days' realized volatility with a rank correlation of 0.65 — meaningfully better than simply extrapolating recent realized volatility (0.53). The market's plug-in number contains real forward-looking information. It is also systematically rich: IV exceeded subsequent realized volatility on 66% of days, by about one volatility point on average — the volatility risk premium.
If options are systematically overpriced, can I profit by selling them?
Not as a retail taker, in our test. We sold an at-the-money ~30-DTE QQQ straddle at the actual bid every month for 7.5 years, held to expiry: Sharpe −0.42. Tail-hedged: −1.03. Only a vol-spike entry gate dragged it to +0.05 — statistical zero. The ~1-point premium is real but smaller than the bid/ask spread paid to collect it, and the occasional −10% month does the rest. The premium is the market maker's compensation; crossing the spread means you fund it rather than earn it.
Why does everyone still use Black-Scholes if it's wrong?
Because it's a language, not an oracle. Nobody at a market-making firm believes constant volatility; they quote and hedge in Black-Scholes implied-vol terms while layering corrections (the smile surface, stochastic-vol and jump models) on top. An imperfect model with known, priceable errors beats no common framework at all — the smile itself is the market publishing its corrections in the model's own units.