"A 2% Drop Always Bounces" — We Tested Buy-the-Dip on 7 Years of NQ
Every trader has a friend with the same rule: when it falls 2%, it always comes back. We tested the literal rule and every variant of it on seven years of NQ daily data with real costs. The verdict is more interesting than a debunk: dip-buying on NQ is a real, statistically significant edge — but it peaks at MODERATE dips and fades exactly where the folk wisdom says it should be strongest. And 'always' is doing a lot of lying.
Everyone has this friend. “When a stock falls 2%, it always goes back up. Easy money.” Ours trades it on single stocks and asked whether it works on the Nasdaq. Instead of arguing, we ran it: seven years of NQ daily closes, every dip threshold, real costs ($4.50 commission + slippage per side), and — because “always” is a testable word — the full distribution of what happens next.
Quick reference for the tables: t (the t-statistic) measures how far an average result sits above zero relative to its own noise — |t| above 2 is a real effect (<5% chance of luck), between −2 and +2 is noise. We measure every dip’s edge against the unconditional baseline drift (NQ rises on an average day anyway; a dip signal has to beat that, not just be positive).
”Always bounces” — the distribution says 55/45
NQ closed down 2%+ on 128 of 1,727 sessions. The next day:
- Up 55% — down 45%. A mild lean, not a law.
- Mean next-day: +0.27%. Median: +0.16%.
- Worst next day: −9.5% (it kept crashing). Best: +9.5%.
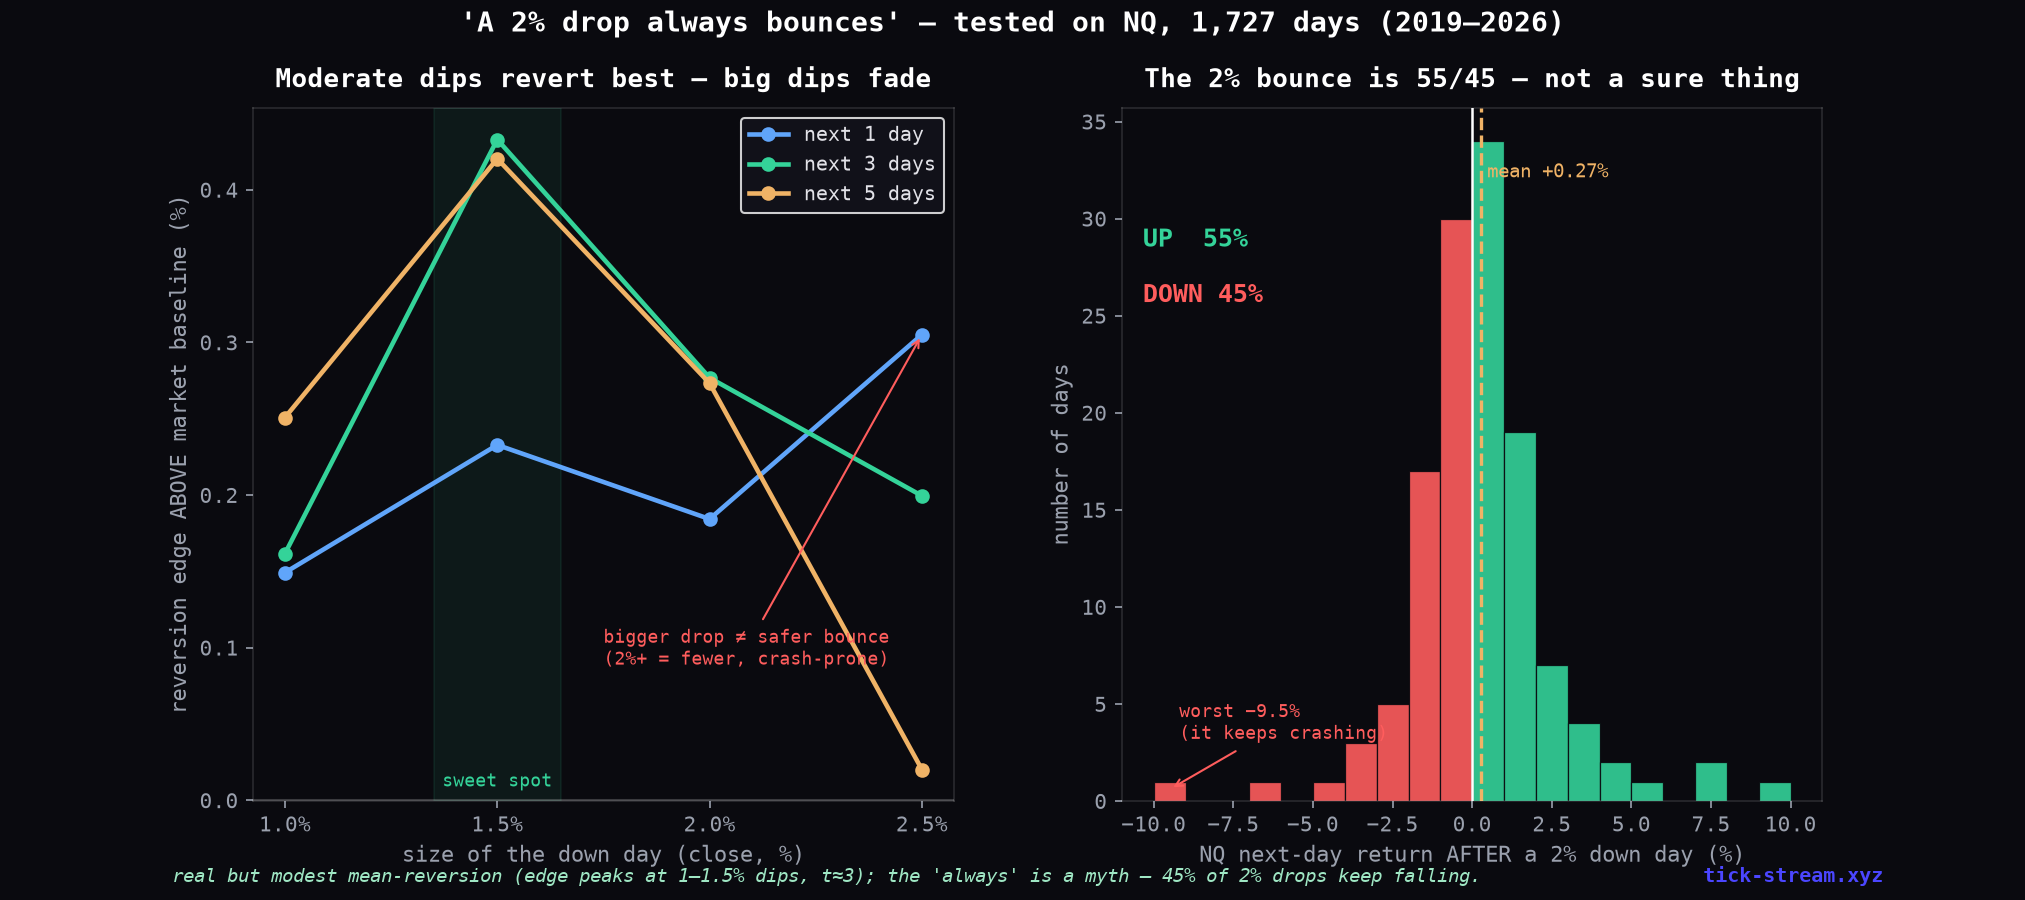
That right panel is the “always.” Almost half of all 2% drops kept falling, and the left tail includes March 2020 and the 2022 bear — precisely the days the rule holds you long into.
The twist: moderate dips revert better than big ones
The left panel is the actually useful finding. Measuring the forward edge (above baseline) by dip size:
| Dip threshold | next-3-day edge vs baseline | t | n |
|---|---|---|---|
| down ≥ 1.0% | +0.16% | 2.3 | 306 |
| down ≥ 1.5% | +0.43% | 2.9 | 204 |
| down ≥ 2.0% | +0.28% | 1.7 | 128 |
| down ≥ 2.5% | +0.20% | 1.1 | 80 |
The edge peaks at 1–1.5% and decays as the dip grows — the exact opposite of the folk intuition (“the bigger the fall, the surer the bounce”). Moderate dips are positioning flushes in an uptrend; big dips are, too often, the start of real trouble. The cleanest version of the signal scales by volatility instead of a fixed percent — buy when the day is ≥1.5× its 20-day volatility below zero (t = 2.5, and the worst case shrinks from −9.5% to −6.0%, because a fixed 2% in a calm regime is a much rarer, more informative event than 2% in a wild one).
As an equity curve
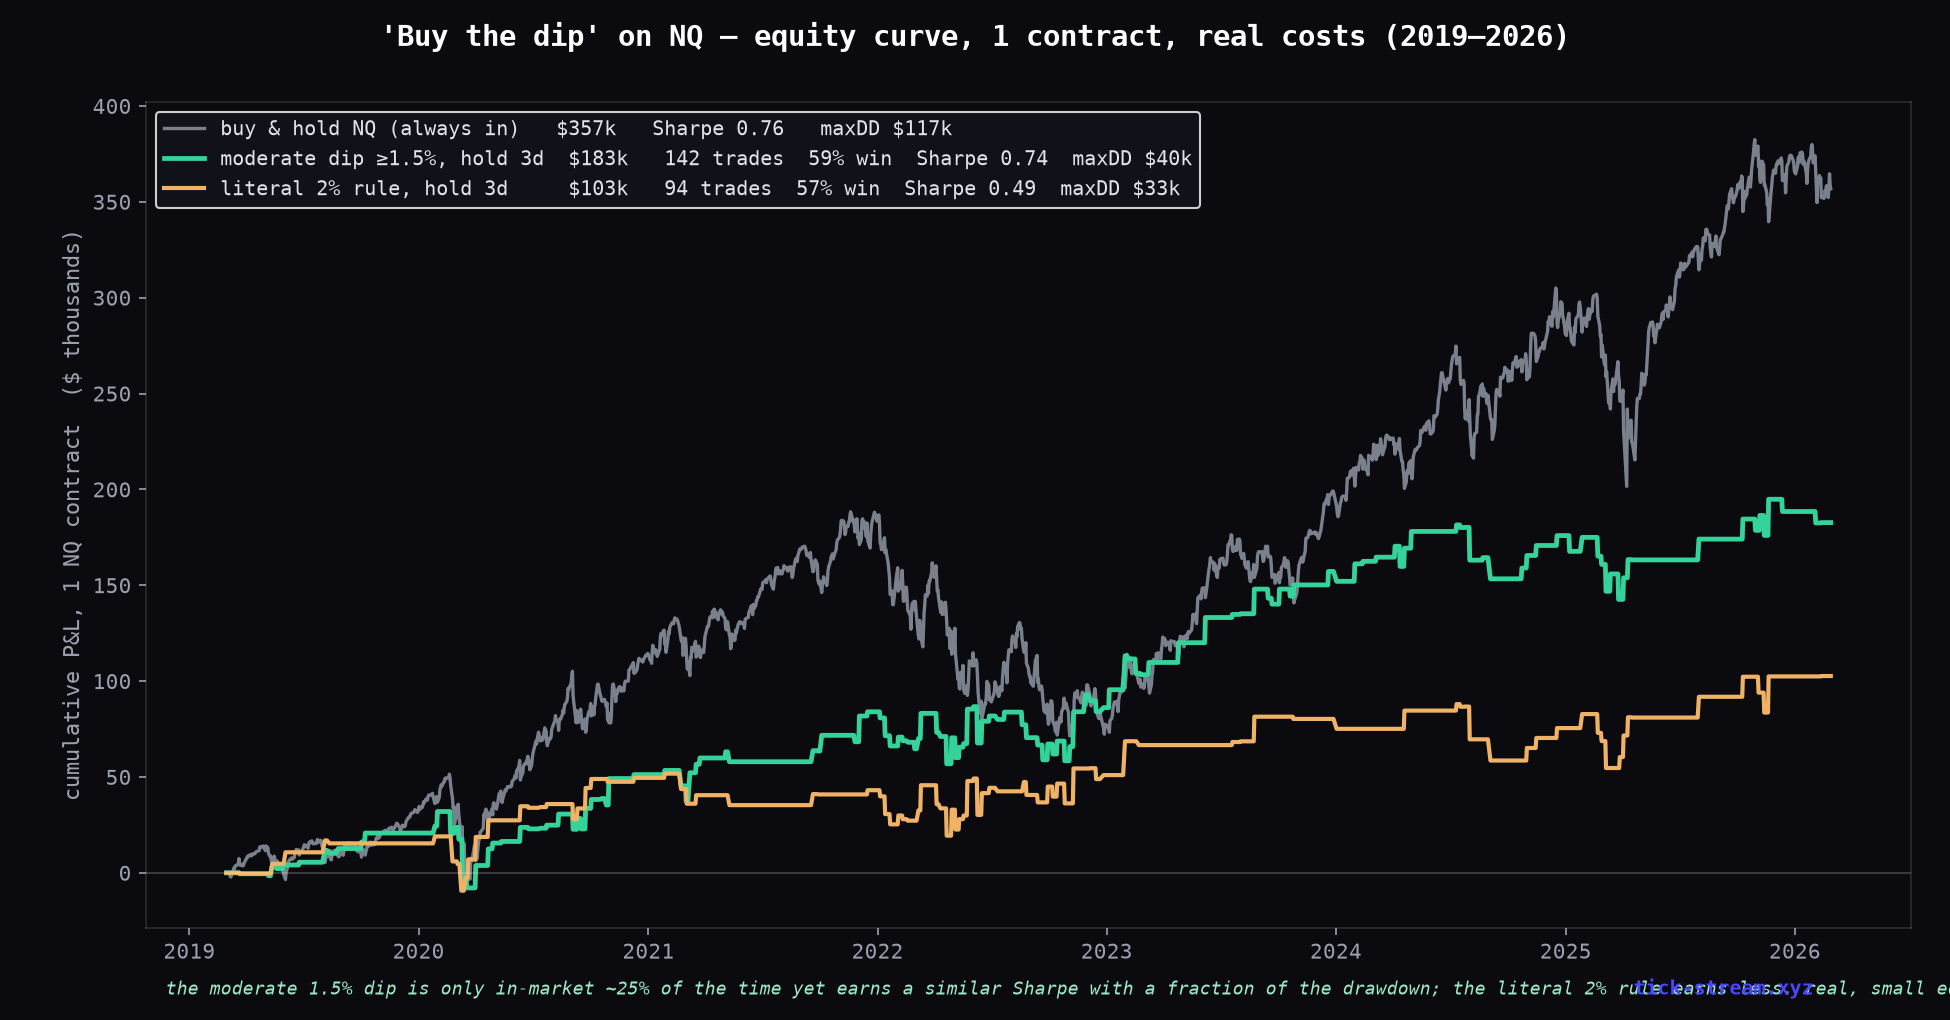
One contract, buy the qualifying close, exit three sessions later, non-overlapping, real costs:
| Strategy | Net | Trades | Win | Sharpe | maxDD |
|---|---|---|---|---|---|
| Buy & hold NQ (always in) | $357k | — | — | 0.76 | $117k |
| Dip ≥ 1.5%, hold 3d | $183k | 142 | 59% | 0.74 | $40k |
| Literal 2% rule, hold 3d | $103k | 94 | 57% | 0.49 | $33k |
Read it honestly: buy-and-hold made the most absolute money — with three times the pain. The 1.5%-dip rule matched buy-and-hold’s Sharpe while being in the market only ~25% of the time and taking a third of the drawdown. That’s a real, useful property (it’s what a good overlay looks like). And the literal 2% rule — the friend’s version — is the weakest of the three.
The bottom line
Dip-buying on NQ is real mean reversion, not a myth — it’s the same family as the RSI-2 dip rule we validated separately, and it survives costs with statistical significance. But every specific claim in the folk version is wrong: it’s a 55/45 lean, not “always”; moderate dips beat big ones; and the fixed-2% trigger is the worst way to harvest it. If a rule’s strongest word is “always,” the distribution usually disagrees.
Methodology: NQ daily closes 2019–2026 (1,727 sessions after filtering holiday stubs), signals on the daily close, entries at that close, exits N sessions later, non-overlapping trades, 1 contract, $4.50 commission + 2 ticks slippage per round trip. Edge measured against the unconditional same-horizon drift. Daily-aggregated t-stats.
Frequently asked questions
Does buying a 2% dip actually work?
Partially. On 7 years of NQ (1,727 sessions), the 128 days that closed down 2%+ were followed by an up day only 55% of the time — a mild lean, not a rule, with a worst next day of −9.5%. The real finding: the reversion edge peaks at MODERATE dips (1–1.5% down, next-3-day edge above baseline +0.43%, t = 2.9) and weakens as the dip gets bigger (2.5%+ dips: t = 1.1, noise). Bigger drop does not mean safer bounce — often it means the crash is starting.
Is 2% on an index the same as 2% on a single stock?
No, and this matters. NQ's typical daily move is around 1.2%, so a 2% index drop is a roughly 1.7-sigma event — genuinely large. For a typical single stock with 2–3% daily volatility, a 2% move is just an ordinary day. Anyone porting a stock rule to an index should scale by volatility. Our volatility-scaled version (buy when the day is 1.5x the 20-day vol below zero) was the cleanest signal in the test: t = 2.5 with a contained worst case.
What is the best dip-buying rule on NQ?
In our 7-year test: buy the close of a day that's down 1.5%+, exit 3 days later — $183k on one contract, 59% win rate, Sharpe 0.74, with a max drawdown of only $40k (buy-and-hold made more, $357k, but with a $117k drawdown and always in the market). The literal 2% rule earned barely half as much ($103k, Sharpe 0.49). Moderate dips revert more reliably than big ones.
Why do moderate dips revert better than big crashes?
Because a 1–1.5% down day is usually positioning noise in an uptrend — overleveraged longs flushing out — and the structural bid returns the next day. A 2.5%+ day is more often real information: the start of 2020-style or 2022-style continuation. In our sample, 45% of 2%+ down days were followed by MORE downside, with a worst next-day of −9.5%. The folk rule assumes the opposite (bigger fall = surer bounce), which is exactly backwards.
Is dip-buying on NQ mean reversion?
Yes — it's one member of a family we've validated repeatedly: NQ daily returns are mean-reverting (1-day autocorrelation strongly negative over our sample). The RSI-2 dip-buying rule we tested separately is the refined version of the same effect (60% win rate, Sharpe 1.2, positive every year 2019–2026). The dip family is real; the 'always bounces' framing is what's wrong.