GEX Levels
Walls, flip and net regime.
$29/mo
- Call wall, put wall, zero-gamma flip
- Net GEX regime per symbol
- Futures + index ETFs
Gamma levels as data
Get GEX Levelsdealer gamma
Call wall, put wall, zero-gamma flip — as data, not as a screenshot.
The chart is free and stays free. Open the levels page — this page is about the same numbers arriving in your model instead of your eyes.
Someone sells a call, a market maker buys it. Their book ends up long or short gamma against the customer, and they do not want the directional risk that comes with it.
When dealers are net long gamma they hedge against the move — selling into strength, buying weakness. Their hedging works as a brake, and realised volatility compresses.
Net short, the hedge flips direction: they buy strength and sell weakness. Now the hedging pushes the same way the market is already going, and moves extend rather than fade.
The spot level where net gamma crosses zero separates the two regimes. Above it and below it the same news produces a different day.
GEX is a model, not a measurement. It stands or falls on the assumption about who sits on which side of each contract. We show you the computation — per strike, with the call and put split — so you can judge for yourself where it holds and where it does not.
free, no account
Walls, flip and regime rendered on a live chart, for the symbols most people watch. It is a picture, and a picture is enough if you are trading it by hand.
Open the chart →from $29/mo
Per-strike exposure, the call/put split, DEX, vanna and charm, on your existing API key. It is an input, and an input is what you need if something else is deciding.
See the tiers →One call gives you the regime and the two levels that bound it.
curl "https://api.tick-stream.xyz/v1/gex?underlying=NQ\
  &weight=oi&dte=all" \
  -H "Authorization: Bearer sk_live_…"
g = client.gex("NQ", weight="oi", dte="all")
if g.net_gex < 0:
# short-gamma regime: size down, widen stops
risk = base_risk * 0.5
target = g.call_wall
stop = g.zero_gammaconst g = await client.gex({ underlying: "NQ", weight: "oi" });
const shortGamma = g.netGex < 0;
const { callWall, putWall, zeroGamma } = g;response
{
  "underlying": "NQ",
  "spot": 24918.25,
  "net_gex": -1.84e9,
  "zero_gamma": 25040,
  "call_wall": 25200,
  "put_wall": 24600,
  "per_strike": [ … ]
}

// net_gex < 0 → dealers short
// gamma → expect the day to
// extend, not to fade.| Package | What it adds | Price |
|---|---|---|
| GEX LevelsWalls, flip and net regime. | Call wall, put wall, zero-gamma flip · Net GEX regime per symbol · Futures + index ETFs | $29/mo |
| GEX + GreeksPlus DEX, vanna and charm. | Everything in Levels · DEX, vanna, charm regimes · Per-strike GEX with call/put split · OI or volume lens · History: last 5 sessions | $39/mo |
| GEX FullSingle names and the whole surface. | Everything in Greeks · Single names — AAPL, NVDA, TSLA… · 0DTE / 1DTE filters · Historical GEX back to 2017 — NQ, ES, GC, SI, CL — minute-sampled | $69/mo |
Single names — Single names — AAPL, NVDA, TSLA… — arrive with the top tier.
Walls, flip and net regime.
$29/mo
Gamma levels as data
Get GEX LevelsPlus DEX, vanna and charm.
$39/mo
Dealer-hedging models
Get GEX + GreeksSingle names and the whole surface.
$69/mo
Systematic gamma research
Get GEX FullDesk — everything in one subscription.
$499/mo instead of $705 bought separately. You keep $206 (29%).
GEX stands for gamma exposure. It is an estimate of how much hedging pressure option dealers are carrying at each strike — and therefore how much buying or selling they are forced to do when price moves, regardless of what they think about the market.
When you buy a call, somebody sold it to you, and that somebody is usually a market maker who does not want a directional bet. They hedge by holding shares. How many shares depends on delta, and delta itself changes as price moves — that rate of change is gamma. A dealer who is long gamma has to sell as price rises and buy as it falls, which damps the move. A dealer who is short gamma has to do the opposite: buy higher, sell lower, which amplifies it. Nothing here is a prediction. It is a bookkeeping consequence of somebody else's position.
Per strike, per expiry: gamma from the option's own implied volatility, multiplied by open interest, by contract multiplier, and by spot squared — then signed by an assumption about who holds what. The naive version assumes customers are long every call and long every put. We do not use the naive version, because it is wrong in a specific and measurable way: put open interest is dominated by protective buying, which puts dealers short gamma on the downside rather than long it.
The full formula and the sign convention are on the documentation page. We publish it because an exposure number you cannot reproduce is a number you have to take on faith, and this field has enough of those already.
The call wall is the strike above spot with the largest positive gamma concentration — where dealer selling into strength is heaviest. The put wall is its mirror below spot. The zero-gamma flip is the price at which aggregate dealer gamma changes sign: above it, hedging damps moves; below it, hedging feeds them. Those three numbers are what almost every GEX chart on the internet shows you, including ours.
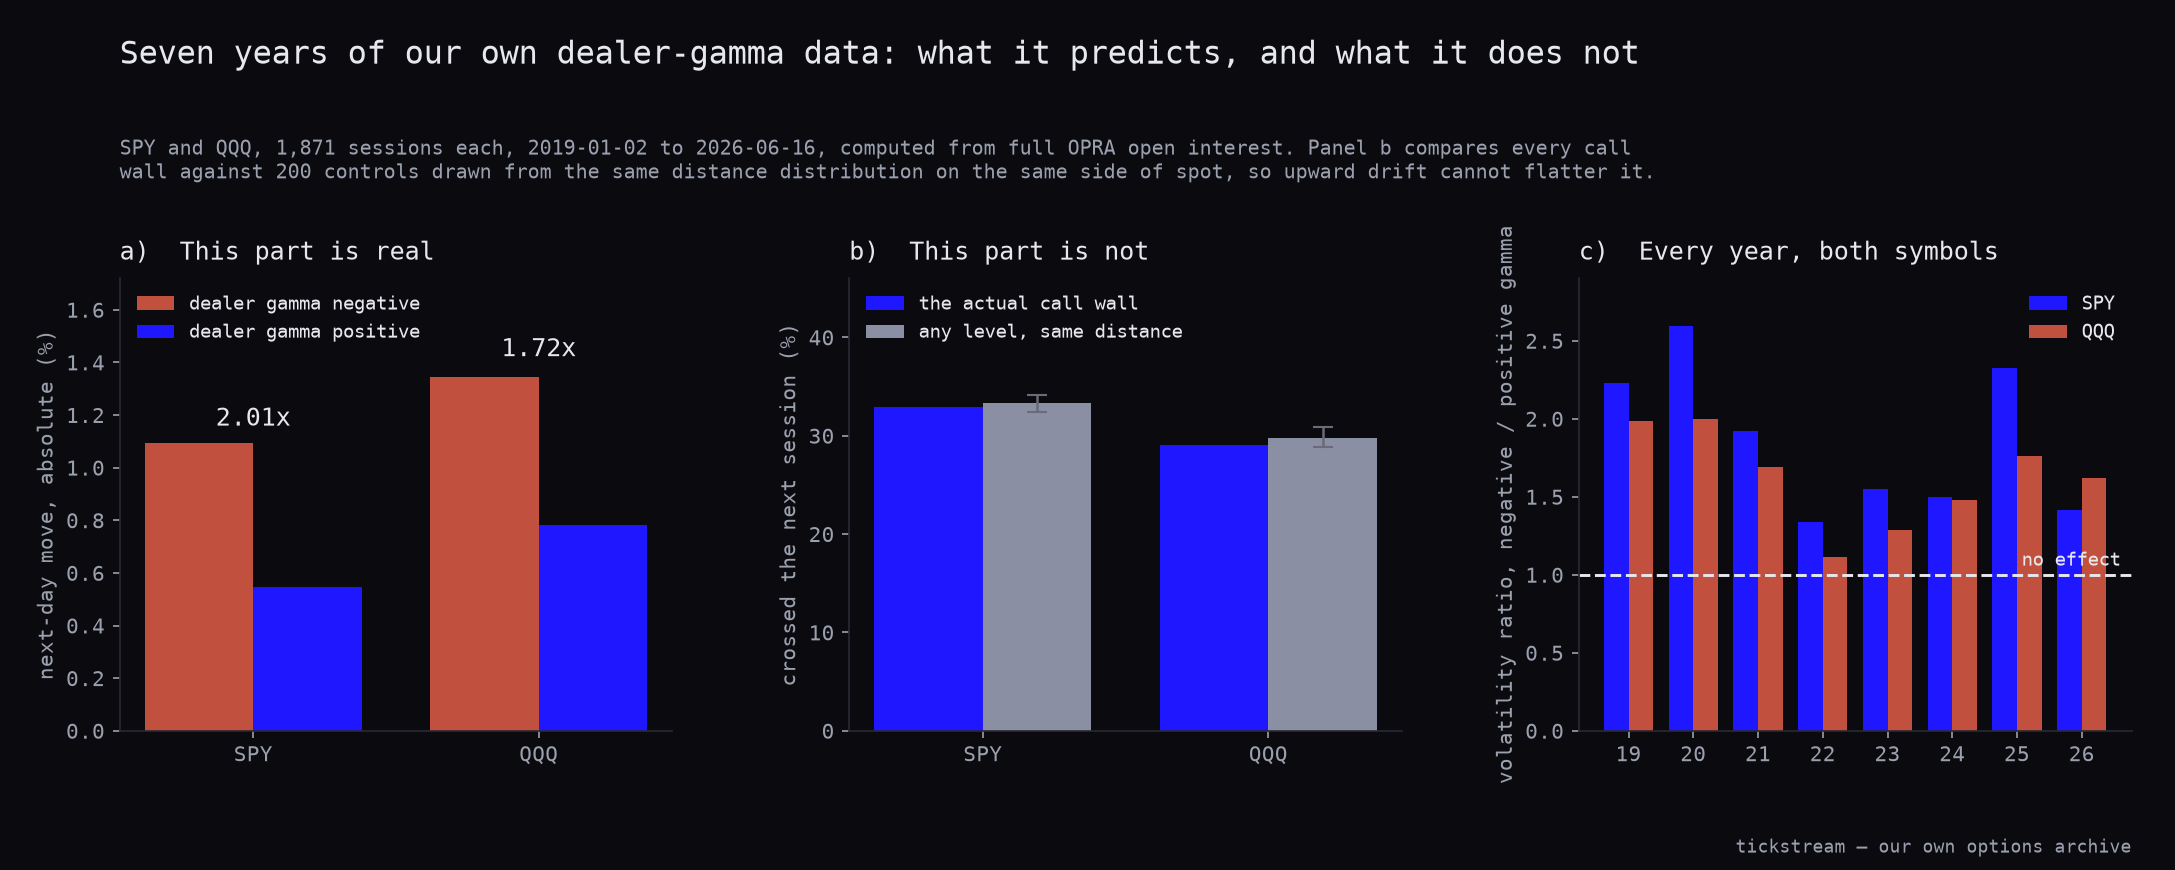
We have computed these levels daily since January 2019 and kept every one of them. That archive lets us ask a question most vendors of this data do not ask out loud: does any of it predict anything? Below is the answer from 1,871 sessions of SPY and QQQ, and it splits cleanly in two.
If you would rather see the mechanism than the statistics, we walked one gamma squeeze day by day — SPY, March to April 2026, from three weeks of deeply negative gamma through the session hedging flipped positive.
On days when aggregate dealer gamma is negative, the next session's move is 2.01× larger on SPY (1.09% against 0.55%, t = +13.1) and 1.72× larger on QQQ. That is not a marginal effect that needs a clever test to see, and it does not rest on one good period: the ratio sits above 1.0 in every year of the sample, for both symbols — sixteen out of sixteen, from a calm 2022 at 1.34× to 2020 at 2.60×.
The zero-gamma flip points the same way but far more weakly than it is usually sold. Roughly a quarter of the flip values in our own archive are degenerate — a fallback equal to spot, or implausibly far from it — and once those rows are excluded the effect is 1.25× on SPY (t = +3.0) and 1.11× on QQQ, which is not significant. We publish the filtered number rather than the flattering one. Trade the sign of gamma; treat the flip as a rough marker.
This is genuinely useful, and it is useful for one thing: sizing. If your position size assumes a normal day and dealer gamma is deeply negative, you have taken roughly twice the risk you think you have.
The call wall is the number people want to trade. It does not survive a fair test. Over the same seven years, price closed above the call wall in 33.0% of the next sessions on SPY — and above a level drawn at random from the same distance distribution, on the same side, in 33.3%. On QQQ it was 29.1% against 29.8%. In both cases the real wall lands inside the control's own spread, and a clear majority of the random controls beat it.
We ran the same question intraday, on levels recomputed through the session across 31 days, and got the same answer: no level beat its mirror placebo. A wall marks where hedging concentrates. It is not a barrier, and treating it as support or resistance is trading a base rate with extra steps.
Use gamma for the environment, not the entry. Negative gamma means wider ranges, faster reversals and stops that get hit at distances that would be safe in a positive-gamma week. Positive gamma means the opposite: mean reversion into the big strikes, quieter drift, and breakout attempts that die. Neither tells you which way to go.
That is also why our free chart shows the walls without claiming they hold, and why this section exists at all. We sell this data. Publishing the test that says its most marketable feature does not work costs us something — but a number you can trust for one purpose is worth more than a number you have to guess about.
The levels chart is free and stays free: net GEX per strike, both walls, the flip, an open-interest or volume lens, and a 0DTE filter. If you want the same numbers in a model rather than on a screen, the API returns them as JSON on one endpoint, from $29 a month. The option chains underneath are a separate product for people who would rather compute their own.
GEX stands for gamma exposure: an estimate of how many shares option dealers must buy or sell to stay hedged as price moves. Positive dealer gamma means their hedging damps moves; negative means it amplifies them. It describes forced flow, not opinion.
No, and our own seven years say so plainly. Price closed above the call wall in 33.0% of next sessions on SPY, against 33.3% for a level drawn at random from the same distance distribution on the same side. The wall is indistinguishable from an arbitrary level the same distance away.
Roughly double the daily move. Across 1,871 sessions, the next-day absolute move averaged 1.09% when aggregate dealer gamma was negative against 0.55% when it was positive on SPY (2.01x, t = +13.1), and 1.34% against 0.78% on QQQ (1.72x). The ratio is above 1.0 in every year of the sample for both symbols.
The price at which aggregate dealer gamma changes sign. Above it, hedging tends to damp moves; below it, hedging tends to feed them. The effect is much weaker than the sign of gamma itself: on rows where our archive holds a properly computed flip, next-day moves below it run 1.25x larger on SPY (t = +3.0) and 1.11x on QQQ, which is not significant.
A call wall marks where dealer gamma is concentrated, which is a statement about hedging, not about supply and demand at that price. Tested against distance-matched controls it offers no extra stopping power, so treating it as resistance is trading a base rate.
Yes. Net GEX per strike, both walls, the zero-gamma flip, an open-interest or volume lens and a 0DTE filter are free with no account. The paid product is the same numbers as JSON over an API for people who want them inside a model.
Per strike and expiry: option gamma from its own implied volatility, times open interest, times the contract multiplier, times spot squared, then signed by an assumption about who holds which side. We publish the formula and the sign convention rather than asking anyone to take the output on faith.
| Figure | Source | Checked |
|---|---|---|
| Levels are non-naive | Each strike is evaluated with its own Black-Scholes greek AT that strike — the hedging force if price traded there — not with today's spot-decayed greek | 2026-08-03 |
| Computed from our own chains | Live option chains off our own feed (QQQ for NQ, SPY for ES, ETF proxies for GC/SI/CL), strikes mapped onto the future via the live ratio | 2026-08-03 |
| Negative gamma reproduces ~40% more realised vol | Our own 31-day intraday study on wandering levels. The same study killed the directional claim — see the note below. | 2026-07 |
| Free levels page uses the identical computation | /api/gex-levels calls the same code path as /v1/gex | live |
| Every price on this page | pricing.config.mjs | live |
The third row is the uncomfortable one and it stays on the page. We tested our own product's most marketable claim and it did not survive; the regime claim did. Both are here.
Start with the free chart. If you end up wanting the numbers behind it in a model, they are one endpoint away.
Open the free levels page