BLOG
Market data, decoded
Practical, no-fluff guides on real-time futures data, order-book microstructure, backtesting, options analytics and the plumbing behind trading systems — written by the team building the feed.
 NEW · Research
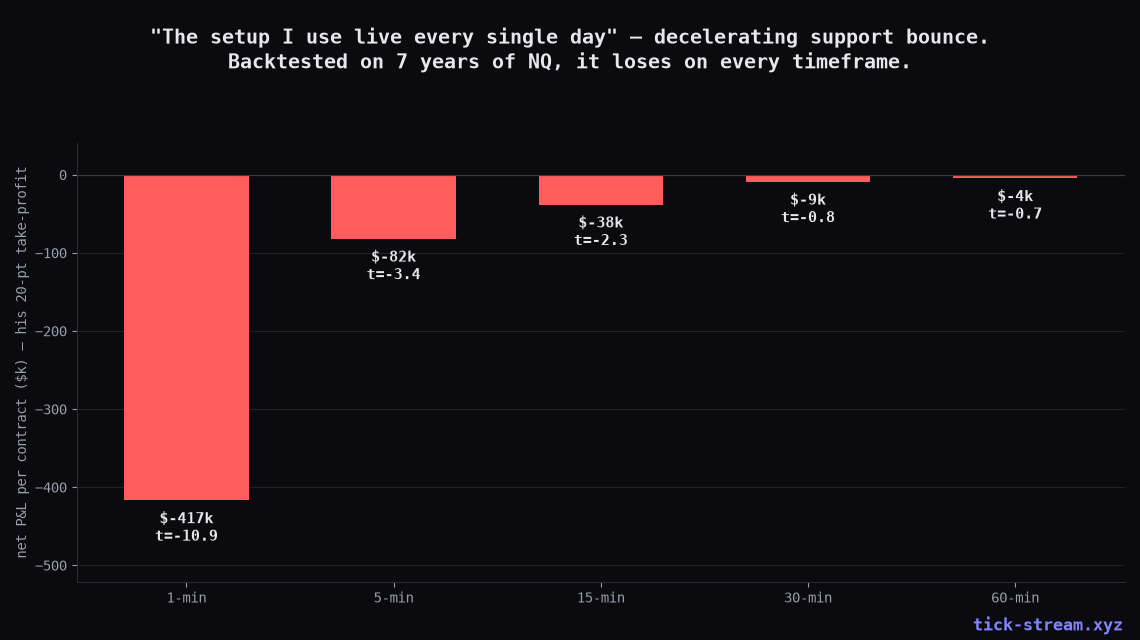
 "The Setup I Use Live Every Day": We Backtested the Decelerating Support Bounce on 7 Years of NQ
A popular stream setup: at support, wait for the down-candles' bodies to shrink, take the first green candle with a bottom wick, stop below the wick, take profit at 20 pips. It looks clean and it wins often. We mechanized it exactly and tested it across five timeframes on 7 years of NQ. It loses on every one — 1-min to 60-min — and the 61% win rate on the higher timeframes is the trap, not the edge. The specific pattern doesn't even beat buying any green candle after a down-move.
 Research
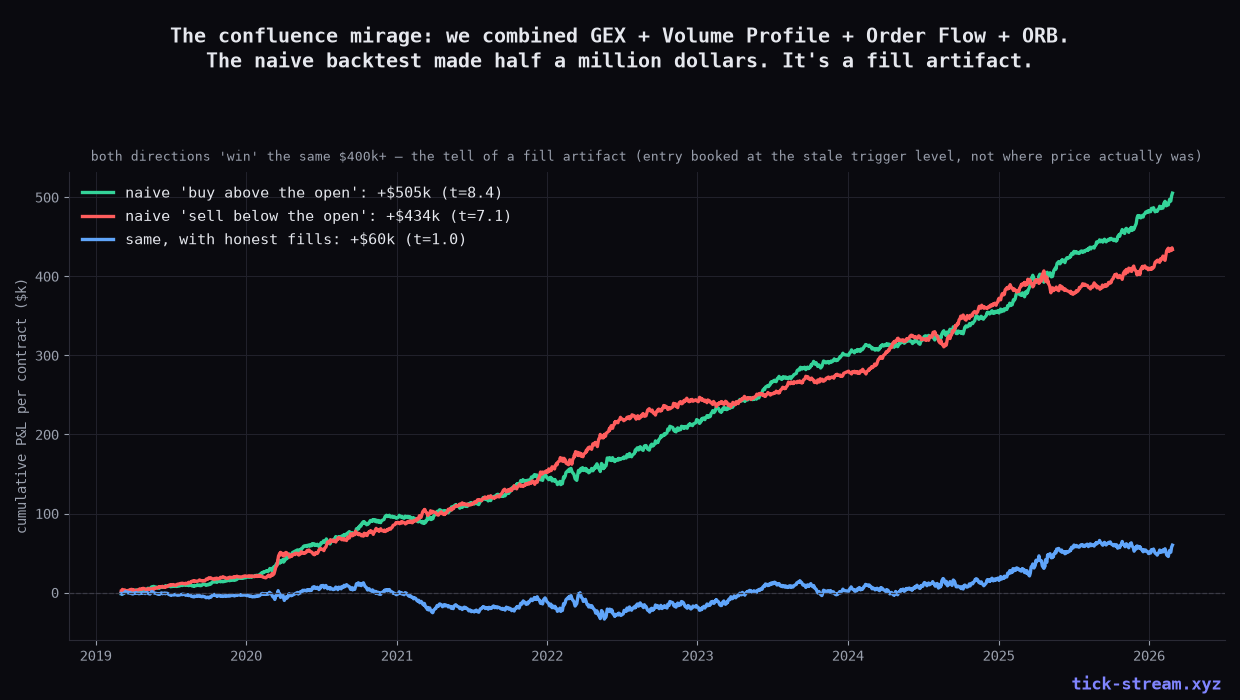
 We Combined GEX, Volume Profile, Order Flow & ORB. The Backtest Made $500k. It Was Fake.
The dream stack: gamma levels + volume-profile nodes + order-flow confirmation + opening-range breakout, all confluencing into one strategy. We built it on 7 years of NQ tick data with real GEX levels back to 2019. The naive backtest printed half a million dollars per contract at t=8. Then we noticed both long AND short 'won' the same $400k — the signature of a fill artifact. With honest fills it collapses 90%. Here's the full autopsy: levels are base-rate, order-flow confirmation doesn't rescue them, and a shuffled fake GEX regime scores as high as the real one.
Market DataA Free GEX Tool Compared to GEXBOT: Honest Side-by-Side (2026)
GEXBOT is a well-regarded paid gamma-exposure product; tickstream ships a free, no-signup GEX tool on the same feed we sell as an API. An honest, factual side-by-side of what each focuses on — transparent methodology, OI vs volume, 0DTE, vanna/charm, single names, charting integrations — so you can pick the right one. Not affiliated with GEXBOT.
Market DataCME Data Feed Providers Compared (2026): Direct, Vendor APIs, Retail Platforms
An honest side-by-side of the realistic ways to get CME futures data in 2026: direct MDP 3.0, institutional vendors, usage-billed developer APIs, retail platform feeds like Rithmic/CQG, IQFeed-style desktop feeds, and flat-priced developer APIs — what each costs, what you actually get, and who each path is for. Including where our own product fits and where it doesn't.
Market DataLow-Latency CME Market Data: What's Physically Realistic (And What's Marketing)
A no-nonsense guide to CME market data latency in 2026: what colocation actually buys, what a direct MDP 3.0 feed costs, why 'ultra-low latency over the internet' is physics-denial, and how to reason about the latency budget of a WebSocket API — with our own measured pipeline numbers as a worked example.
 Research
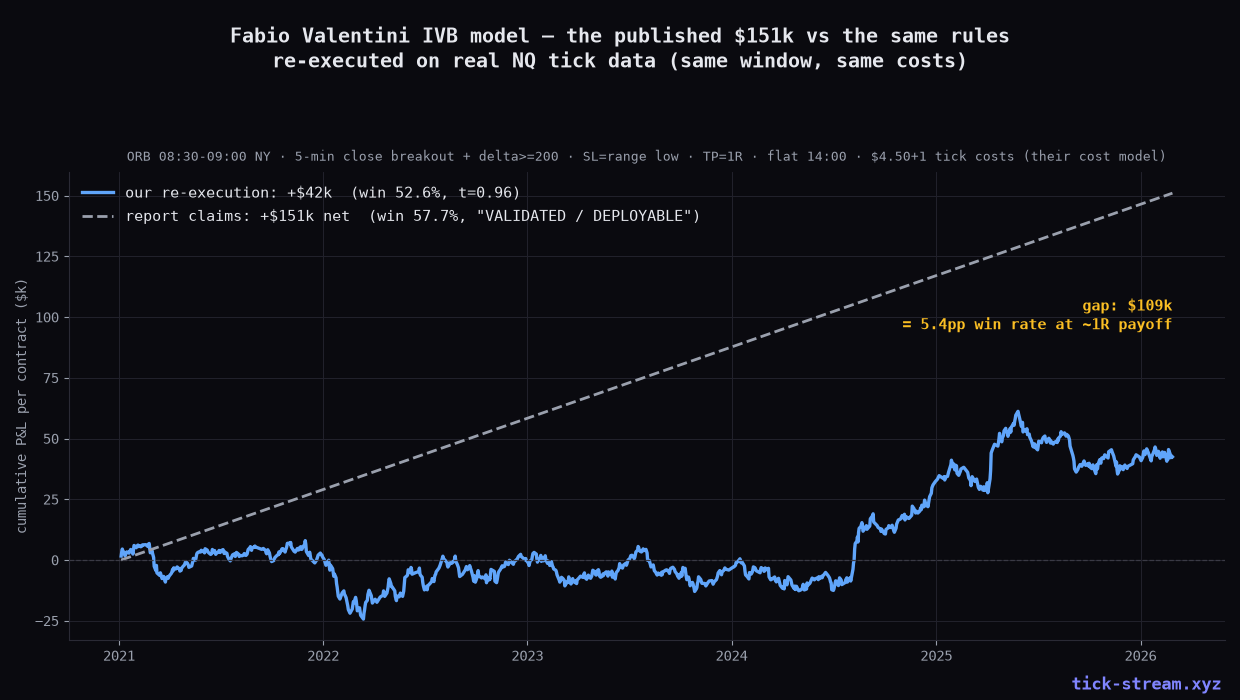
 We Audited the Viral 'Institutional Protocol' ORB Validation — On Real Tick Data, $151k Becomes $42k
Fabio Valentini's IVB opening-range-breakout model, 'independently validated' by Matfin OG with bootstrap, permutations and 20,000 Monte-Carlo sims: P(no edge)=0.001, VALIDATED/DEPLOYABLE. We re-executed the published EasyLanguage rules bar by bar on real NQ tick data — same window, same costs. The code is clean, the delta filter genuinely helps, and the same-bar fill trap we hunted for isn't there. But the headline numbers don't reproduce: +$42k instead of $151k, 52.6% win rate instead of 58%, t=0.96, with almost all profit in a single year. The lesson is bigger than one strategy: a bootstrap on a trade log validates the log — not the strategy.
 Research
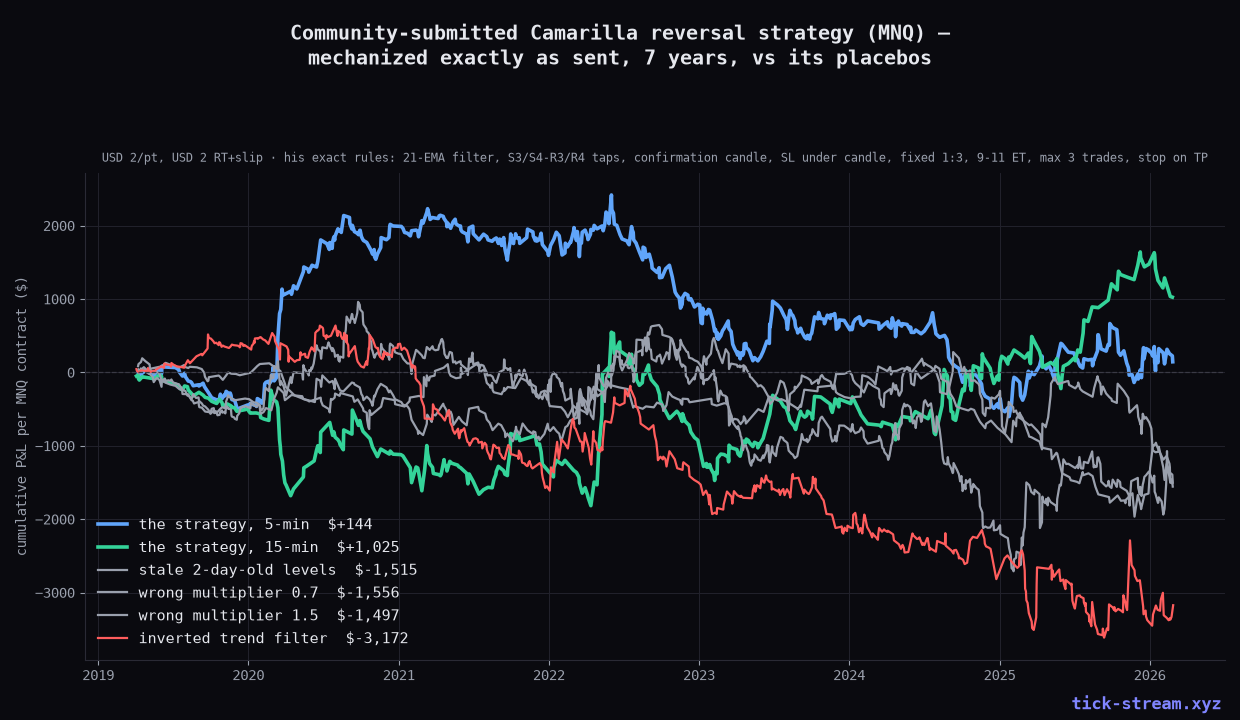
 A Reader Sent Us Their Camarilla Reversal Strategy. We Backtested It — Exactly As Written.
A community member submitted their full ruleset: Camarilla S3/S4/R3/R4 reversals on MNQ, daily 21-EMA filter, confirmation candles, stop under the candle, fixed 1:3 RRR, 9–11 ET, max 3 trades a day. We mechanized it word for word on 7 years of NQ tick data and ran it against placebo levels. The result is the cleanest zero we've ever measured — and a textbook lesson in why a fixed 1:3 can't create an edge.
 Research
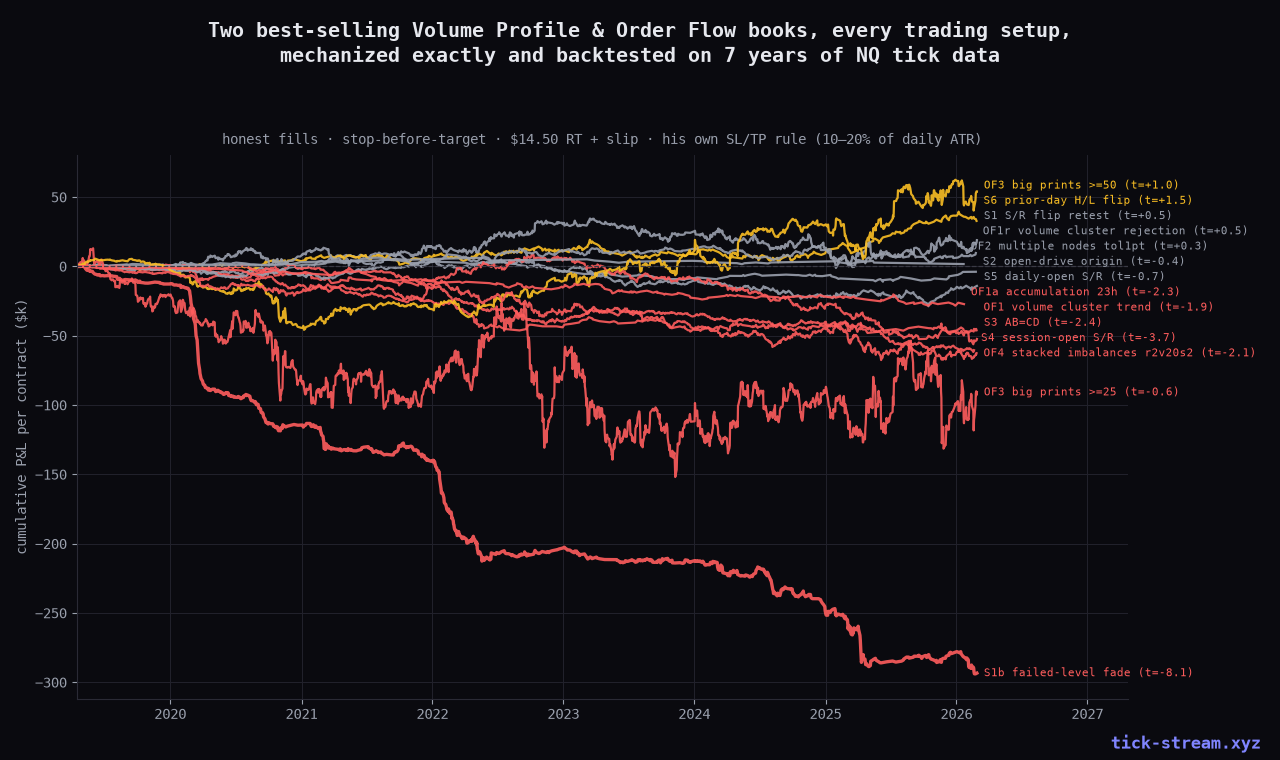
 We Backtested Every Setup From Two Best-Selling Volume Profile & Order Flow Books on 7 Years of NQ
Two popular trading books teach 13 concrete setups: S/R flips, open-drives, AB=CD, volume clusters, multiple nodes, stacked imbalances, unfinished business. Rare for trading books, they're specific enough to test. We mechanized every single one on 7 years of NQ tick data with honest fills, the authors' own risk rule, and placebo controls. Result: not one setup survives — and the one that looks positive is beaten by a two-day-old stale level.
 Market Data
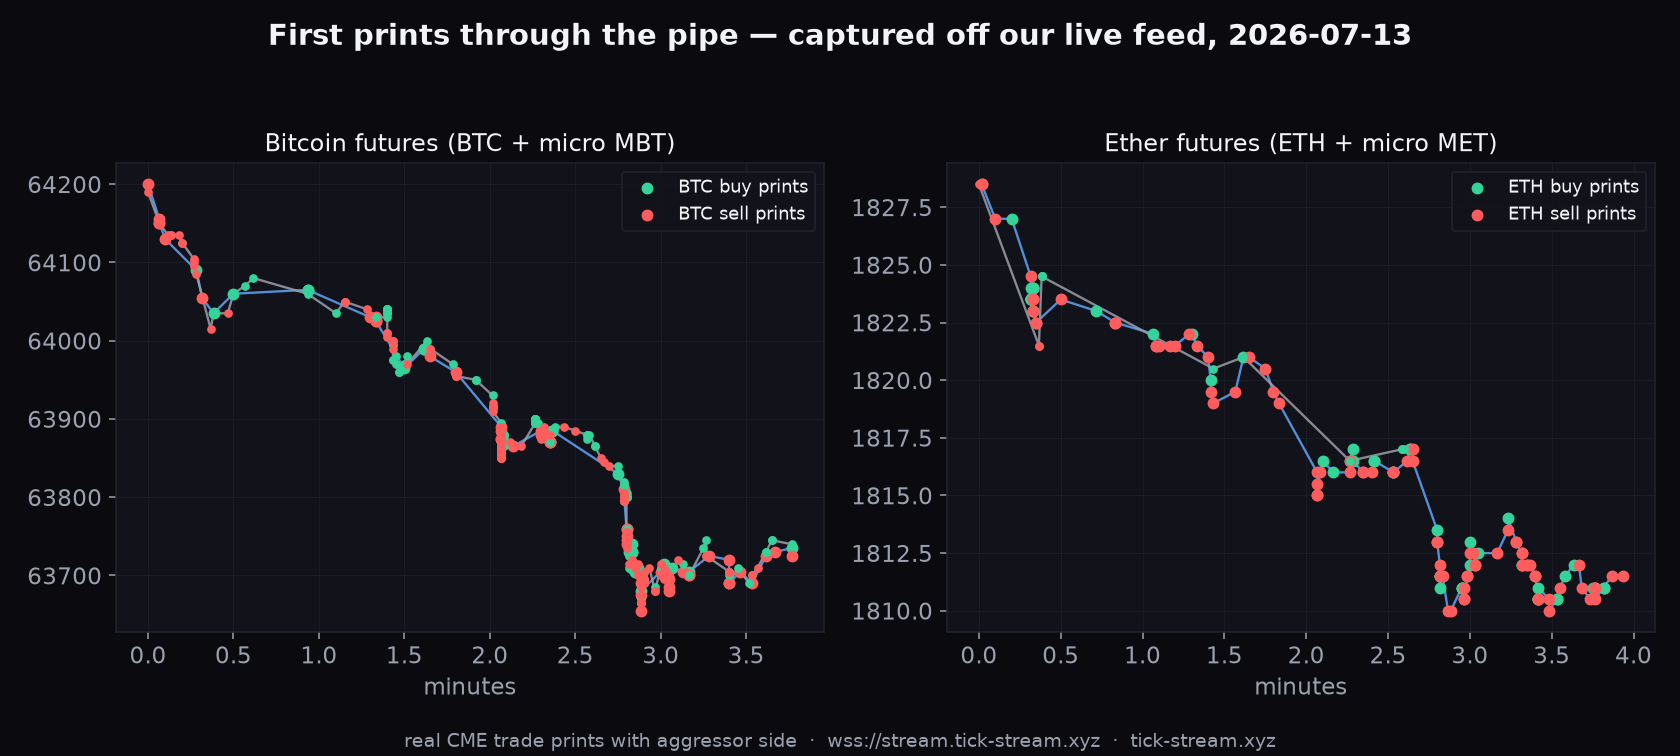
 CME Crypto Futures Data Is Live: Real-Time BTC & ETH Tick Streams (BTC, MBT, ETH, MET)
tickstream now streams CME Bitcoin and Ether futures in real time — BTC, Micro Bitcoin (MBT), ETH and Micro Ether (MET) as raw trade prints with size and aggressor side, over the same WebSocket and REST API as NQ and ES. What CME crypto futures data gives you that spot-exchange feeds can't, contract basics, code examples, and honest notes on what we don't have yet.
 Research
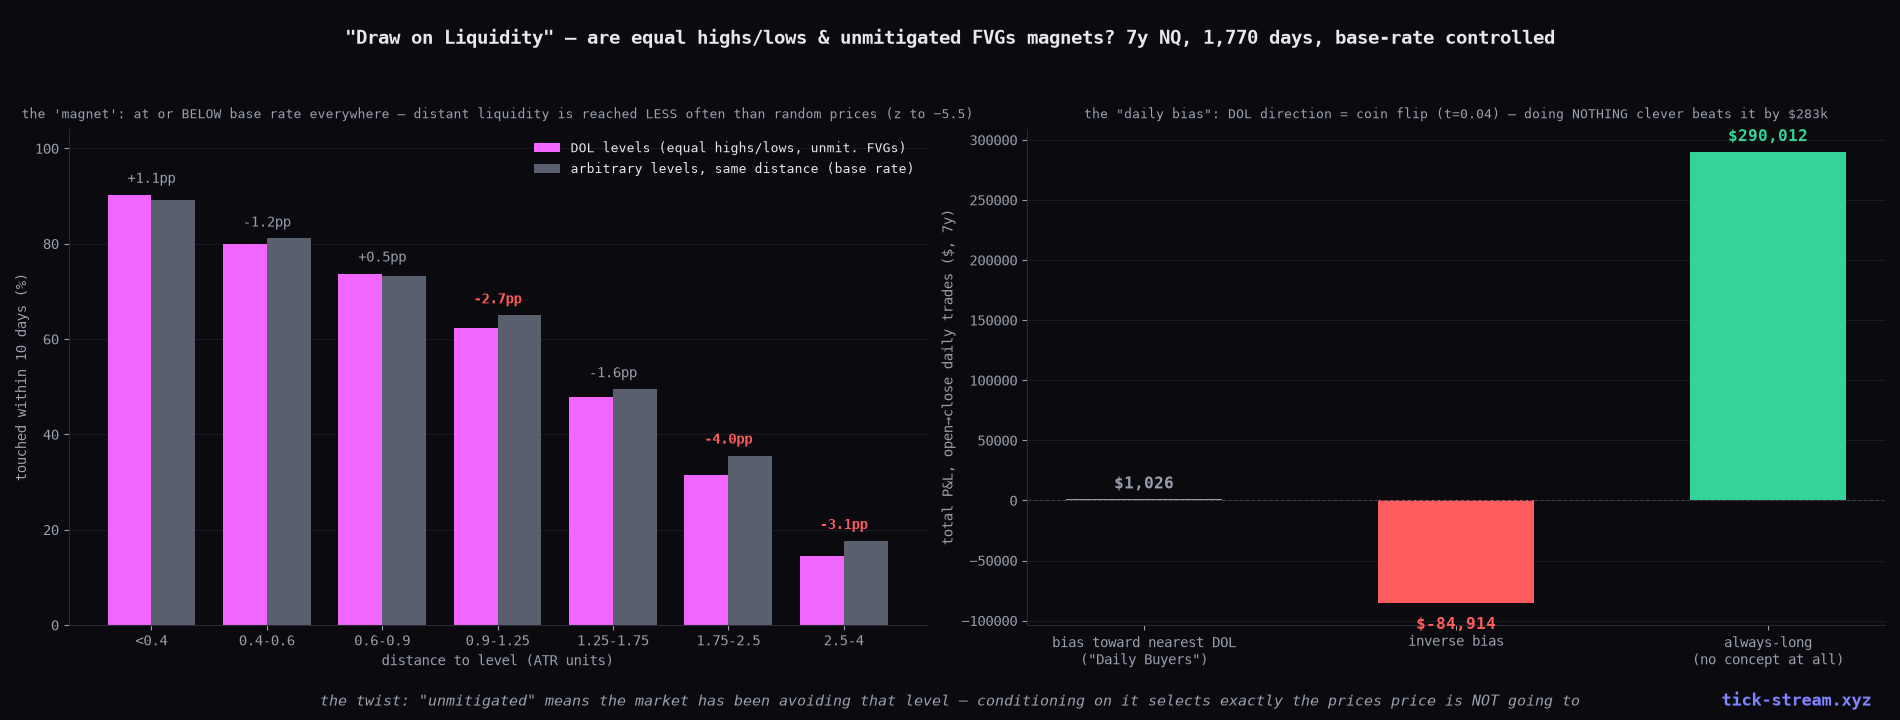
 "Draw on Liquidity" Tested: Are Equal Highs and Unmitigated FVGs Really Magnets? 7 Years, Base-Rate Controlled
The viral concept: the market moves 'from liquidity to liquidity' — equal highs/lows and unmitigated higher-timeframe fair value gaps act as draws, and they tell you the daily bias. We measured it on 1,770 trading days of NQ with the control the videos never run: arbitrary levels at the same distance. Result: the 'magnet' touches at or below base rate everywhere — distant liquidity is reached significantly LESS often than random prices — and the daily-bias rule is a coin flip that costs you $283k against doing nothing. The reason is built into the concept itself.
 Research
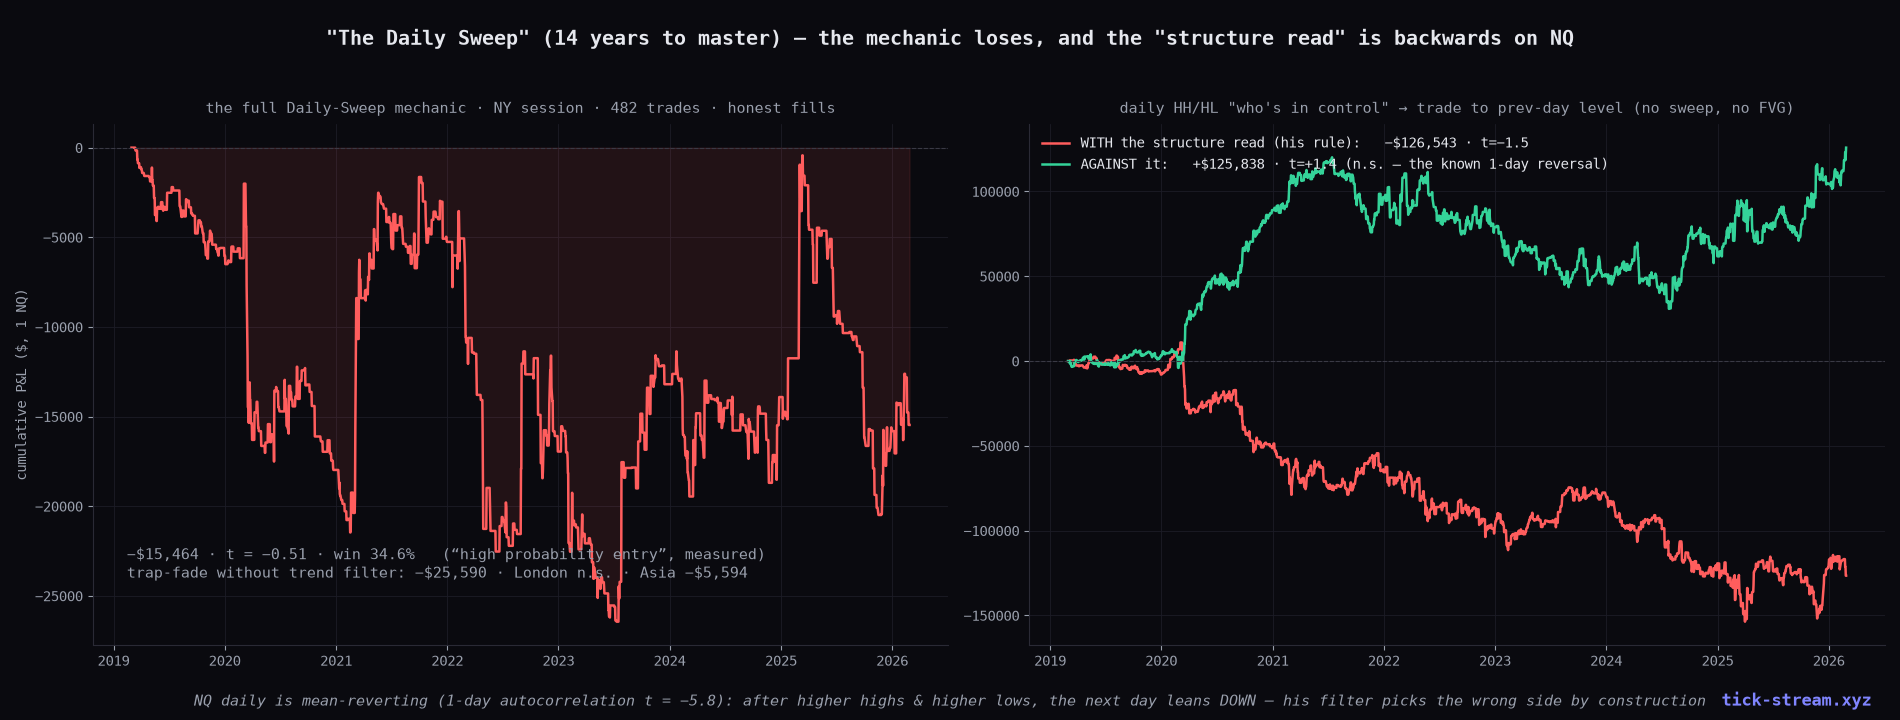
 "The Daily Sweep" — 14 Years to Master, 60 Seconds to Explain, One Backtest to Kill
The viral pitch: read who's in control on the daily chart, wait for a fakeout against the trend after the New York open, confirm with a fair value gap, enter the pullback, target the previous day's level. We ran it on seven years of real NQ tick data: the full mechanic loses in every session, the 'high probability entry' wins 34.6% of the time — and the multi-timeframe structure read that 'works on every system' is directionally backwards on NQ. Trading against it made +$126k; trading with it lost the same.
 Research
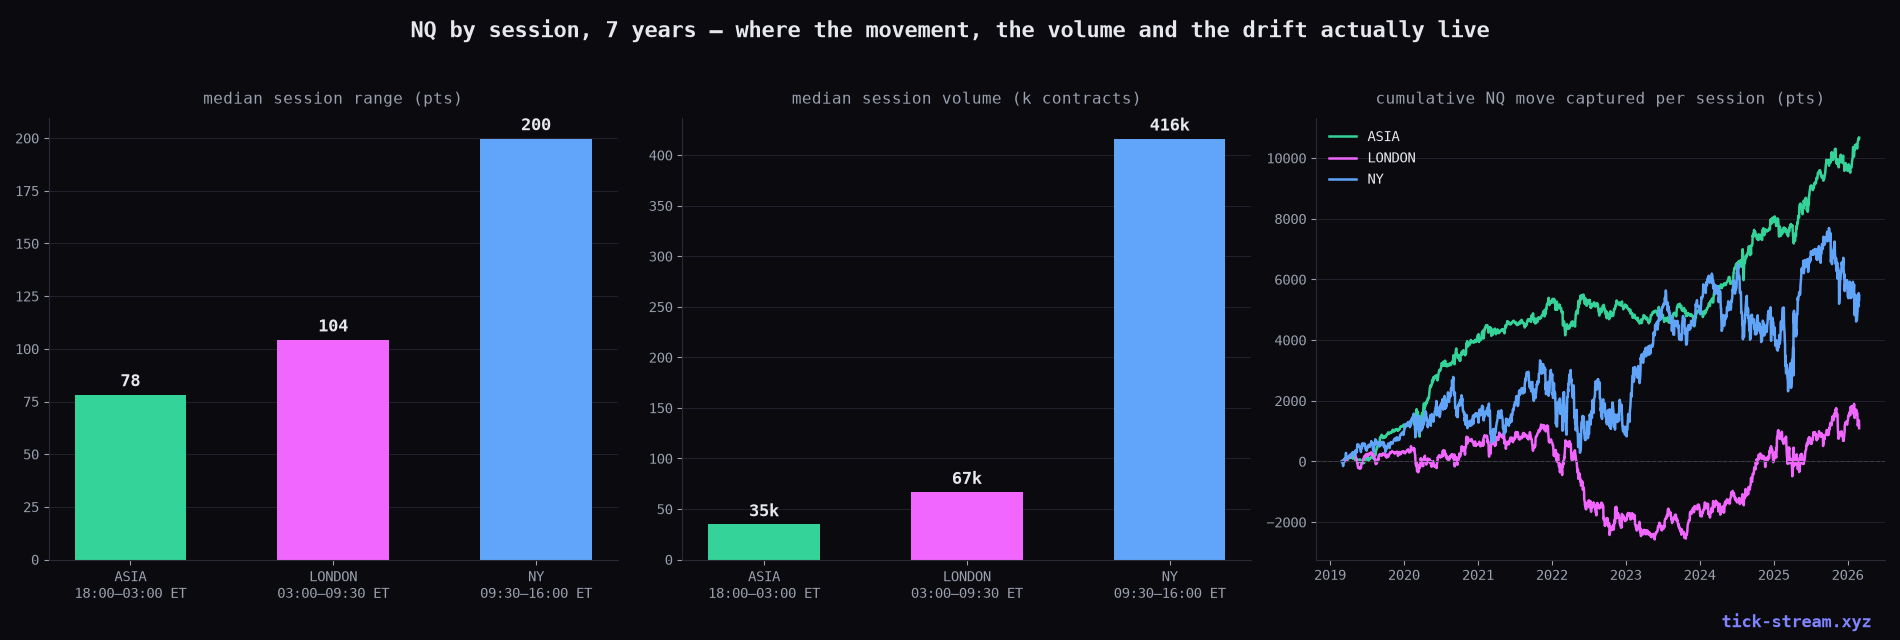
 Do Our Strategies Work in Asia and London? We Audited Our Own Book — and Killed Two of Our Own Algos
A subscriber-grade question turned inward: every backtest we publish anchors to the New York open. So we rebuilt seven years of full 23-hour Globex bars from our own tick store and re-ran our validated sleeves on the Asia and London sessions — same rules, same honest fills, same costs. The NY edges do not travel. And the audit caught something worse: one of our own live strategies was standing on a gap-fill artifact. It's coming off the board.
 Research
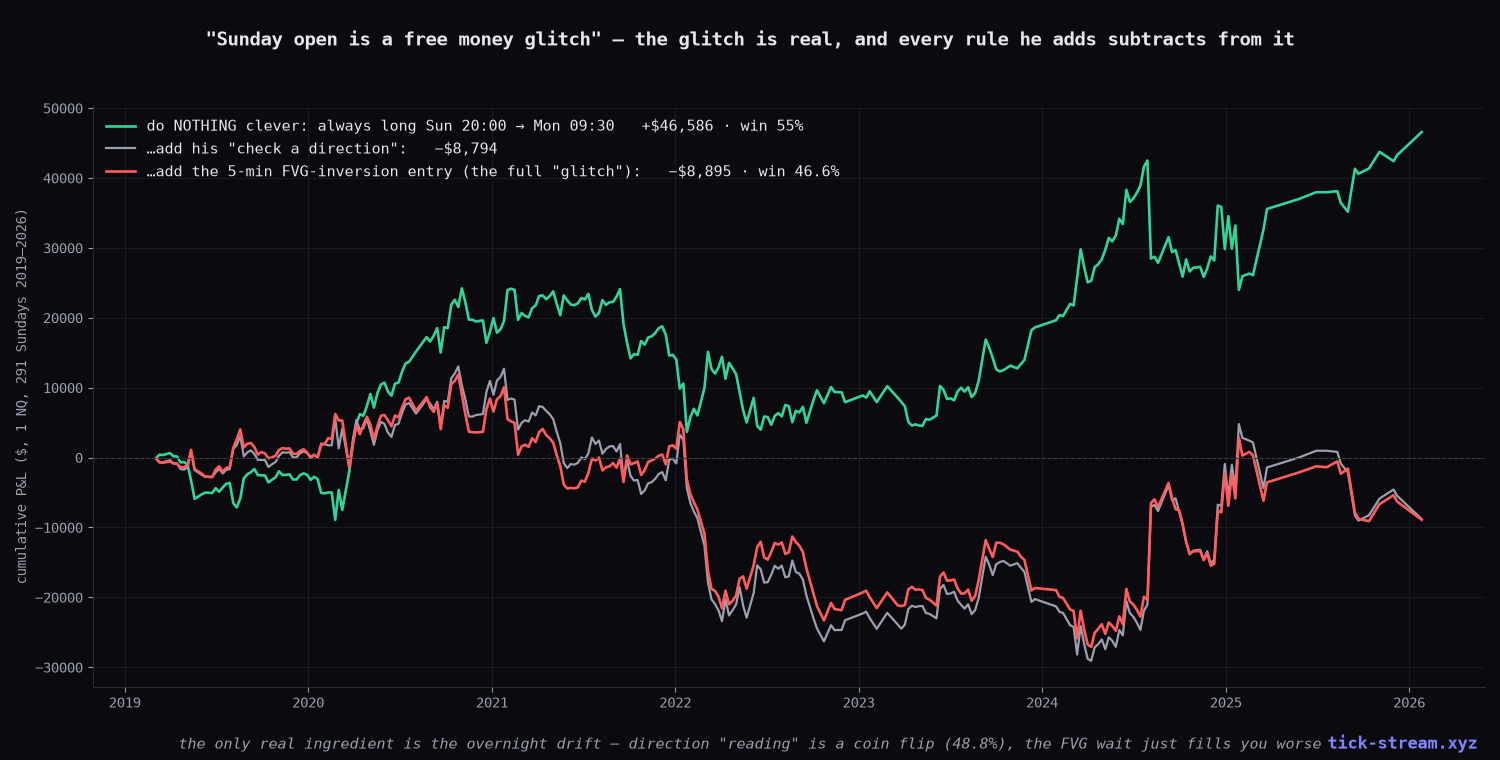
 "Sunday Open Is a Free Money Glitch" — We Tested the Viral Claim on 291 Sundays. The Glitch Is Real. His Rules Destroy It.
The viral pitch: wait for the Sunday Globex open, check the direction at 8 p.m., enter on the first 5-minute FVG inversion — 'fails never.' We ran it on seven years of real NQ tick data: the direction read is a coin flip (48.8%), the full mechanic loses money in every exit variant, and 'fails never' is a 46.6% win rate. The twist: doing nothing but being long Sunday evening made +$46,586 over the same window — the kernel of truth is the overnight drift, and every rule the guru adds subtracts from it.
 Guides
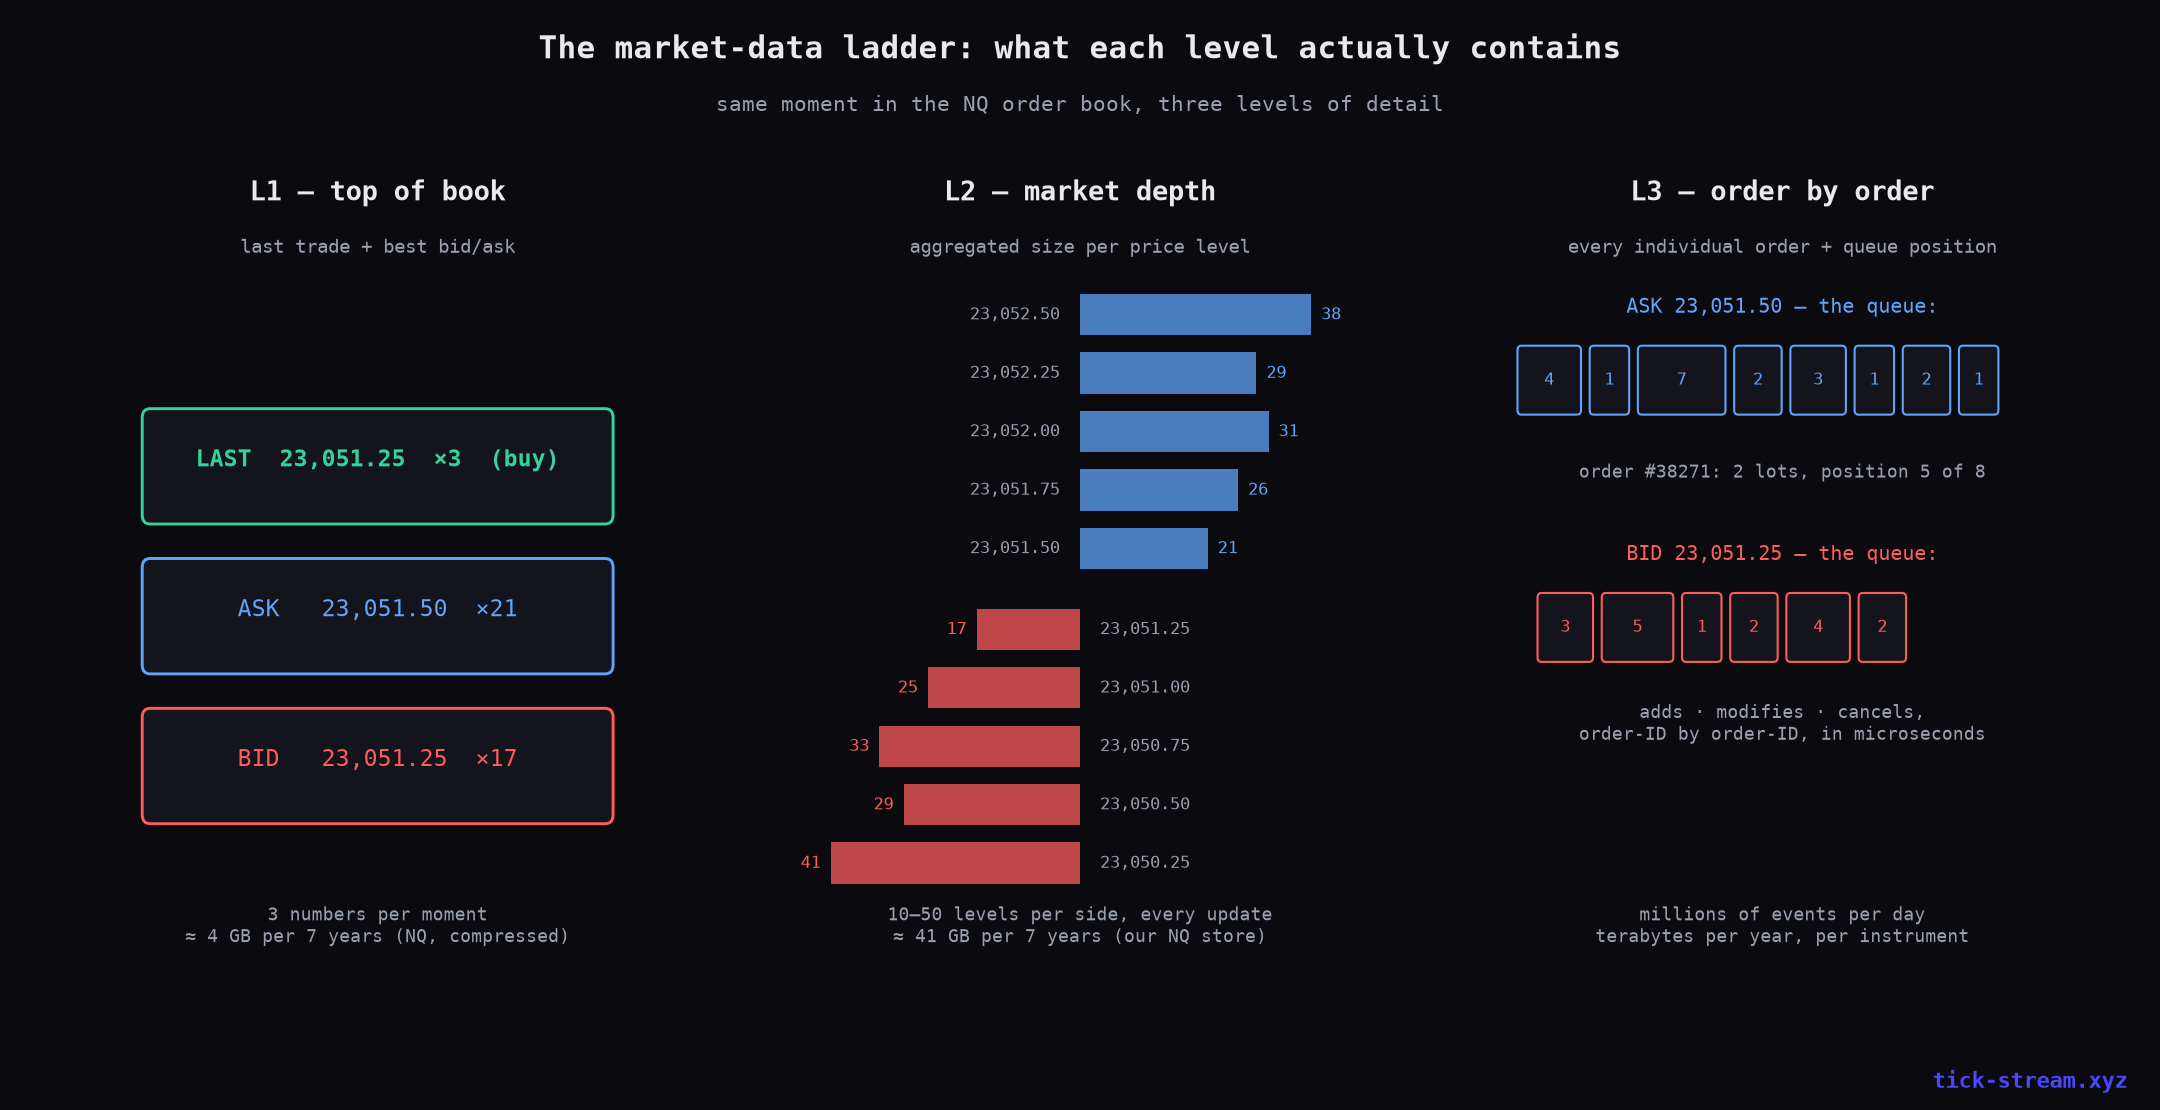
 L1 vs L2 vs L3 Market Data: What Retail Algo Traders Actually Need (and Why L3 Is Wasted on You)
Level 1, Level 2, Level 3 — every data vendor sells the ladder, few explain who actually needs which rung. We run a market-data business AND publish tick-level research, so here's the self-inflicted honest version: exact definitions, real storage numbers from our own 7-year NQ store, the measured size of the only edge that's unique to the order book — and why order-by-order data is a storage bill, not an edge, for anyone trading through a broker API.
 Research
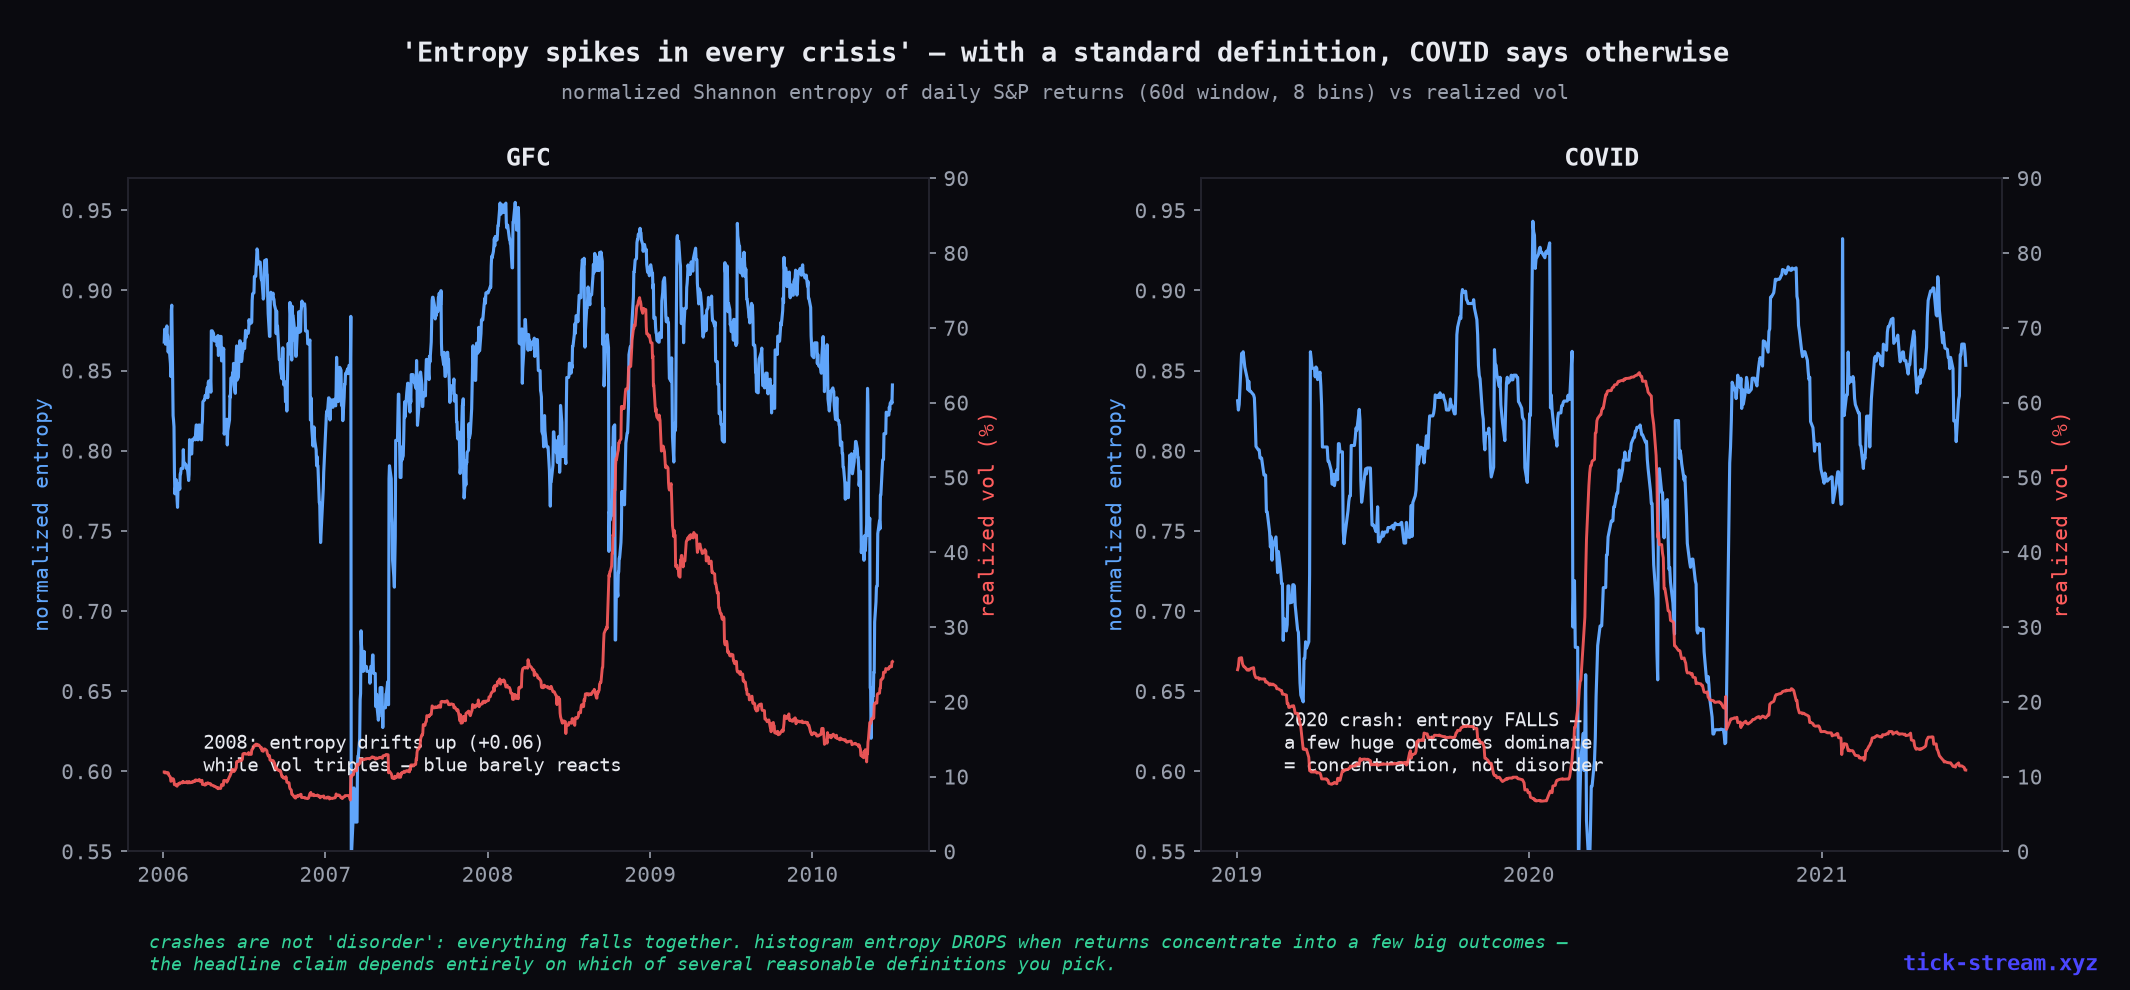
 Is Market Entropy 'More Important Than the VIX'? We Tested Shannon Entropy on 98 Years of the S&P 500
A viral thesis says Shannon entropy measures whether the market is 'losing structure' — spiking in every crisis, telling you when to hedge, possibly beating the VIX. We computed it on 24,700 days of S&P data and asked the only questions that matter: does it replicate, is it different from volatility, and does it predict anything? One of those three answers is yes — and it's not the one the pitch needs.
 Research
 Black-Scholes, Tested Against 7.5 Years of Real Option Chains: What the Famous Formula Gets Wrong — and Right
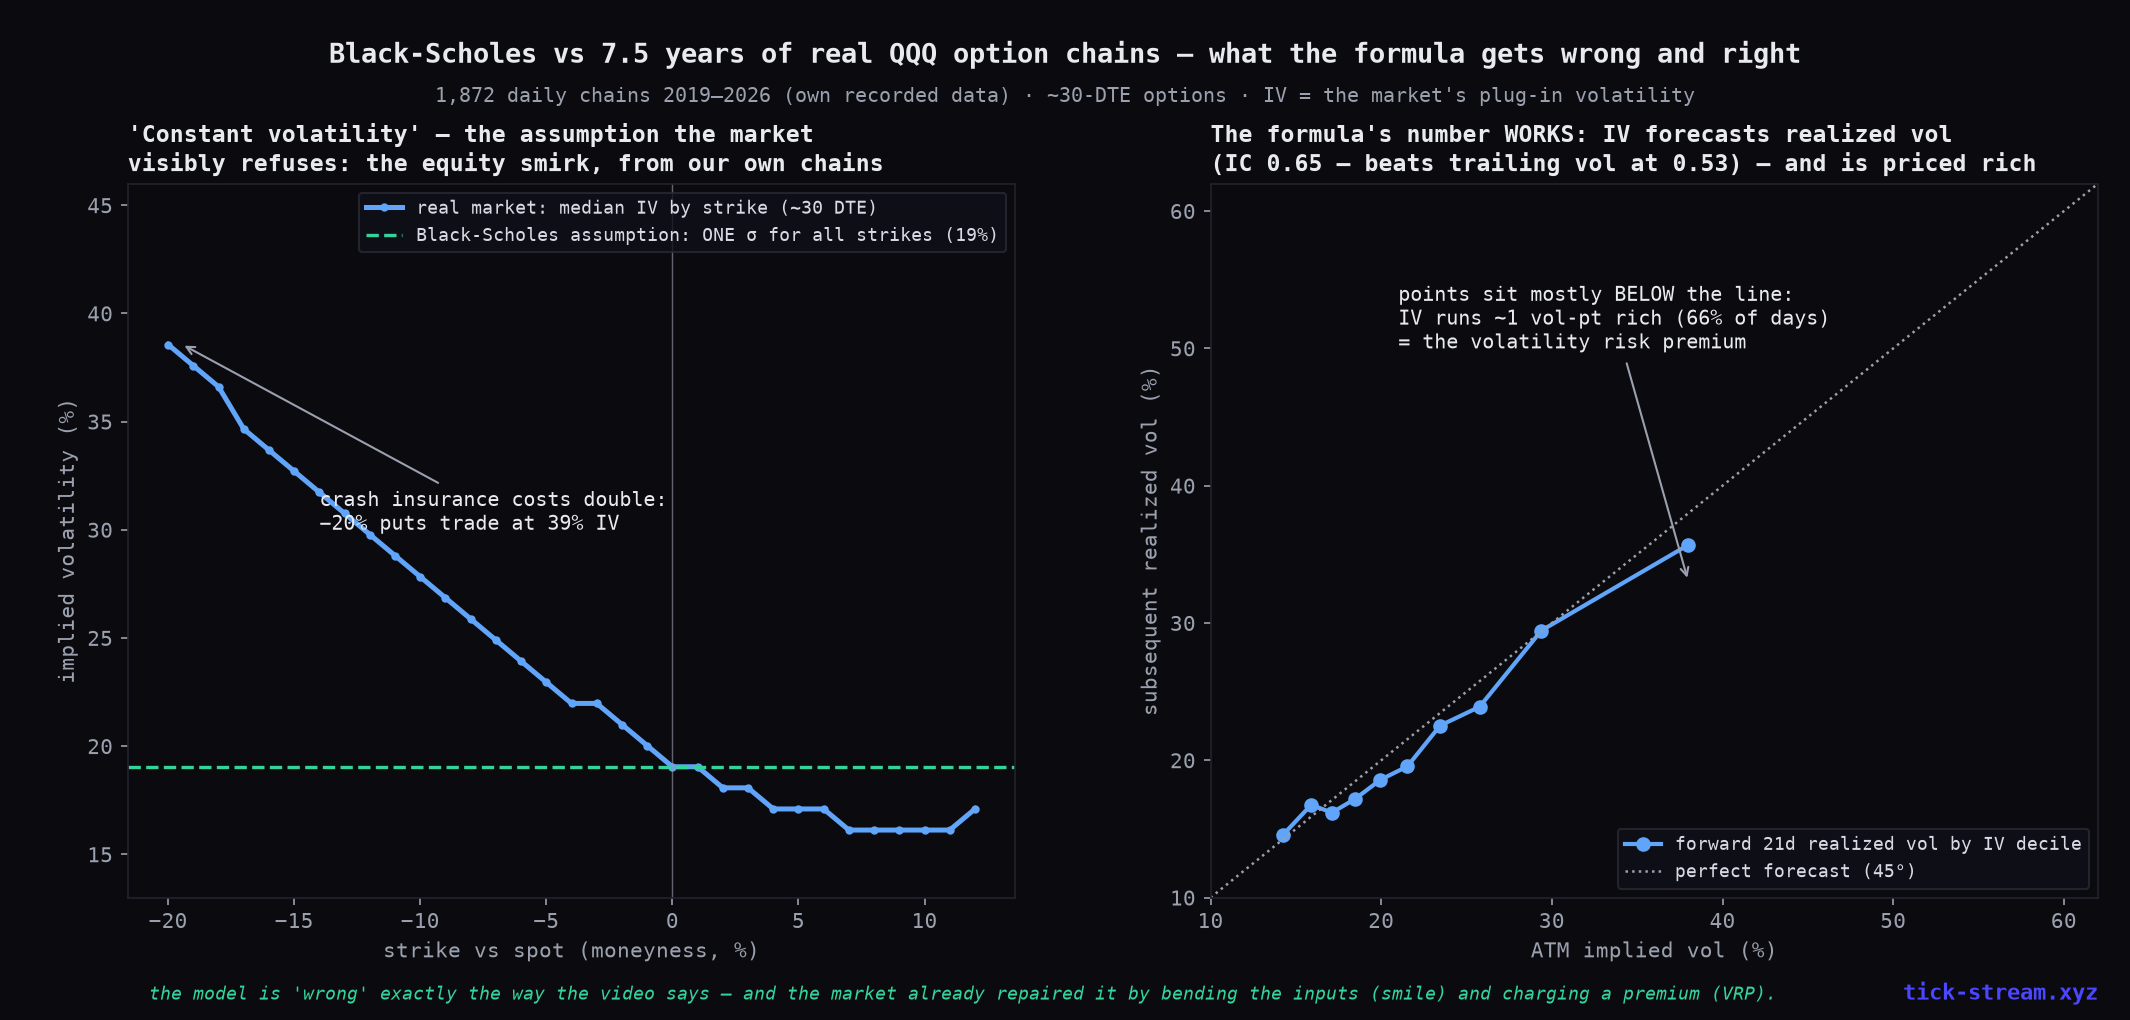
'The most powerful formula in finance' is making the rounds again. Instead of explaining it, we tested it: 1,872 daily QQQ option chains from our own recorded data. The 'constant volatility' assumption fails exactly as advertised (the smirk is visible in one chart), the formula's central number is a genuinely good forecast — better than history — and the one trade the story implies for retail loses after spreads. All three claims, measured.
 Research
 Does CPI Above 4% Crash the Stock Market? We Tested the Claim on 98 Years — Right as It Fires Again
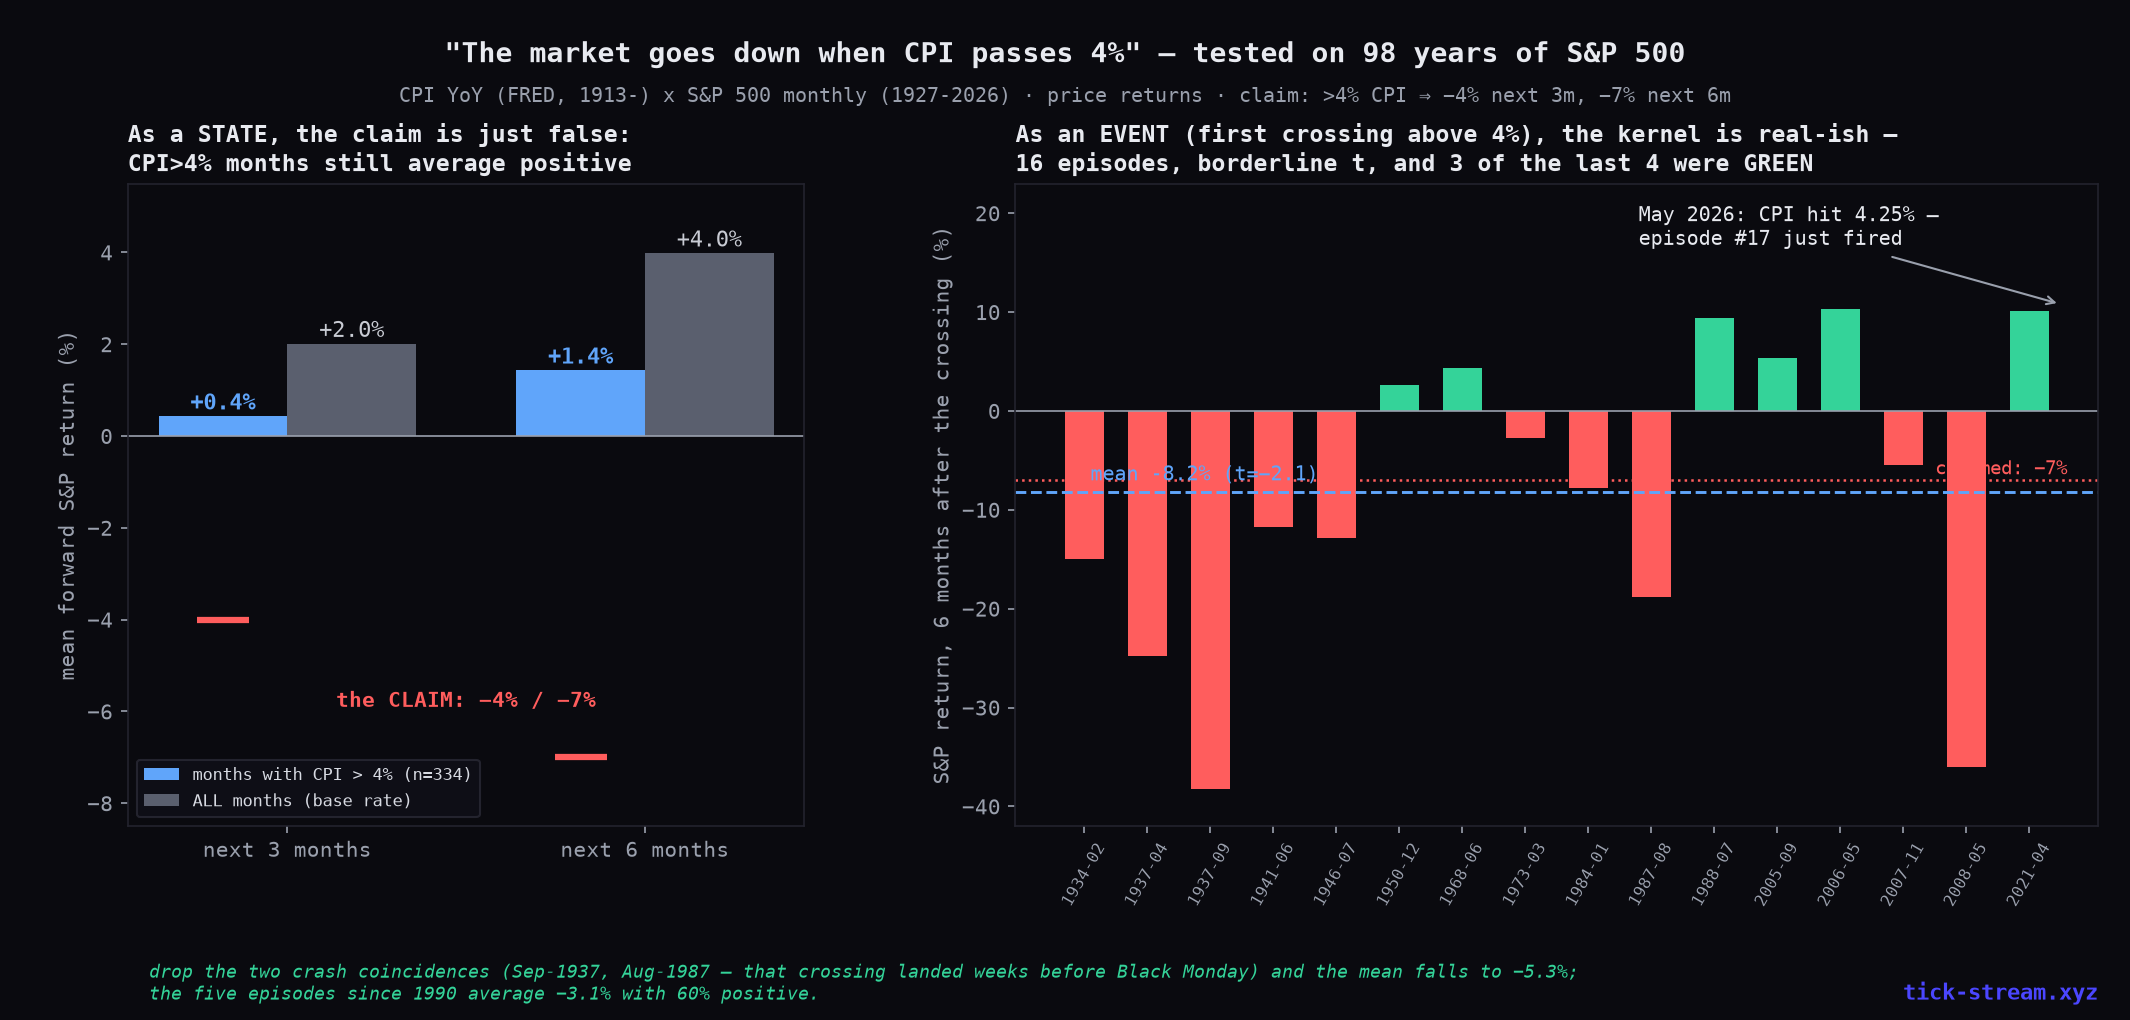
'The market will go down when year-over-year CPI goes above 4% — in the last 100 years that led the market down 4% in three months and 7% in six.' We rebuilt the test from raw CPI (1913–) and S&P 500 (1927–) data. The claim confuses a state with an event: months WITH high inflation are fine; the first CROSSING above 4% has a real but thin, borderline record — and it just fired in May 2026.
 Research
 Do Price Gaps Get Filled? We Tested 1,748 NQ Opening Gaps — the Fill Rate Is a Distance Illusion
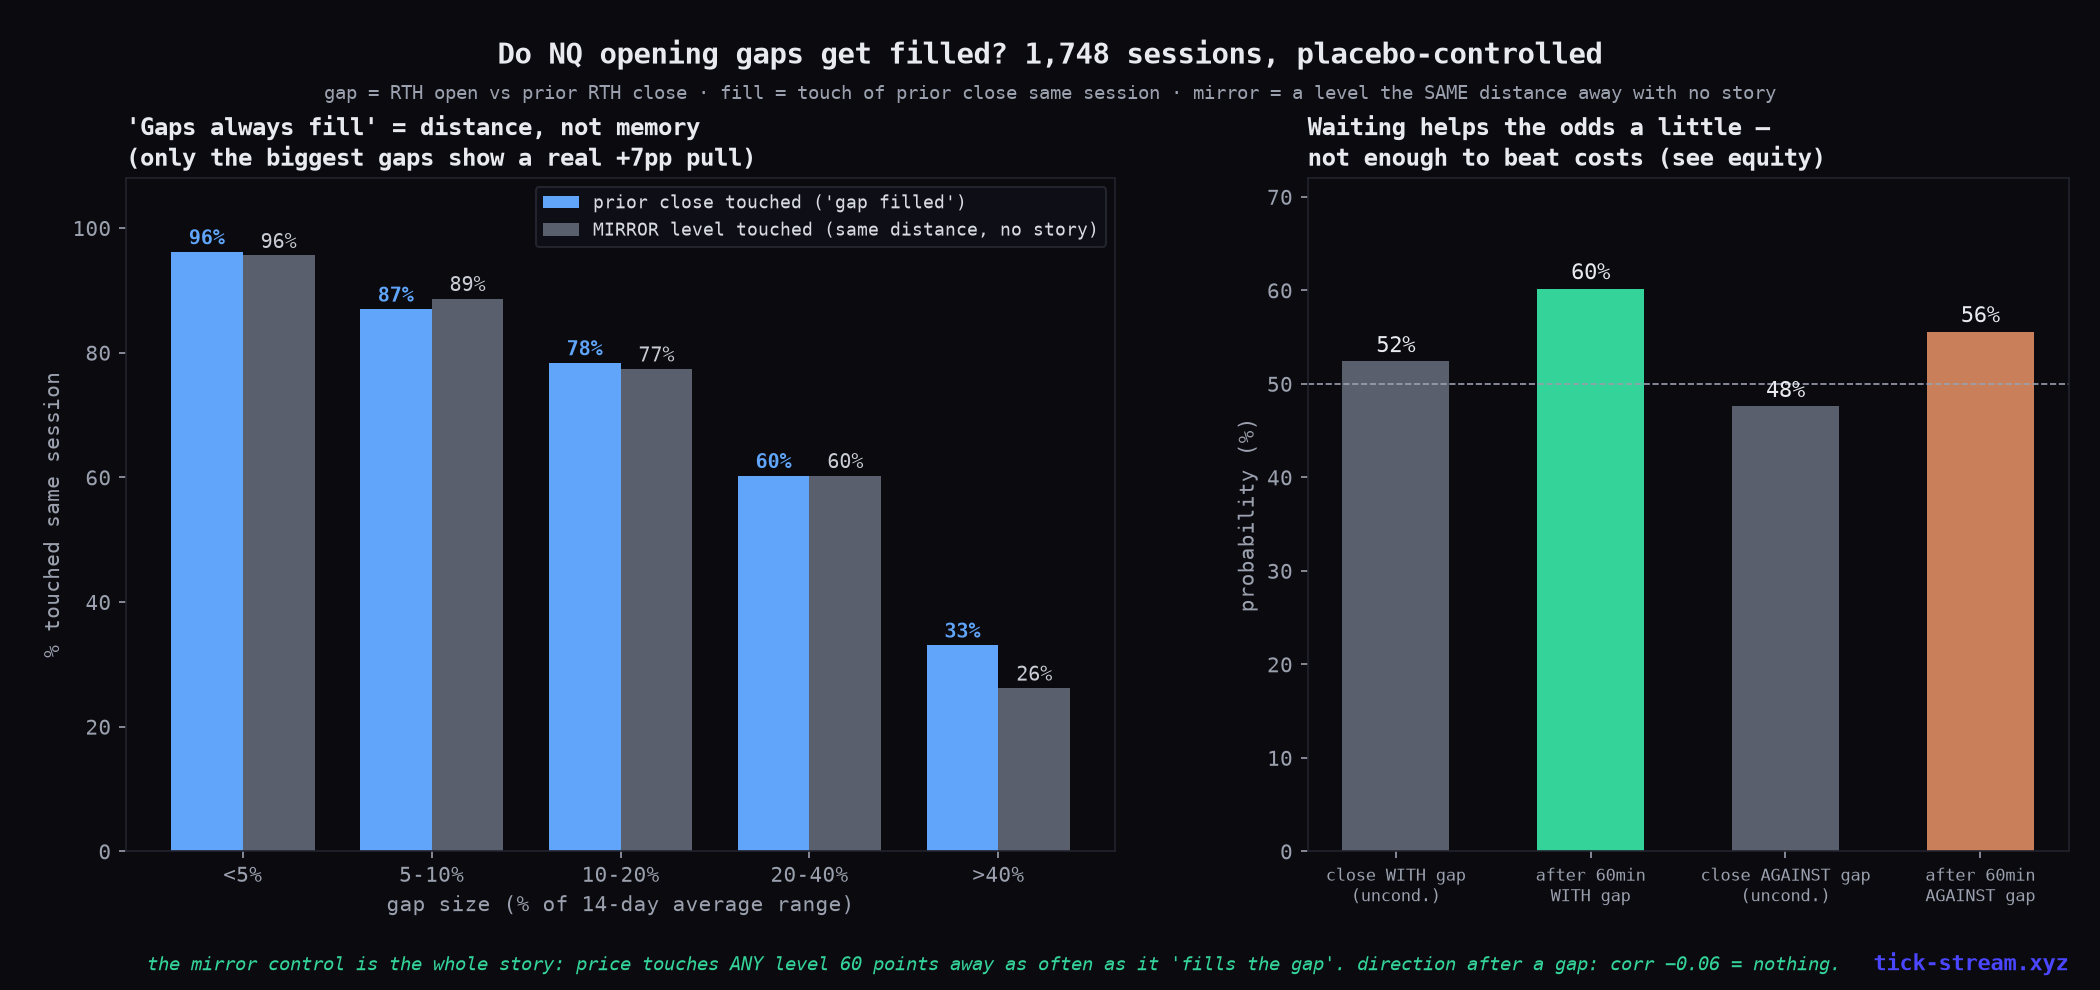
A gap is the simplest object in trading: today's open minus yesterday's close. Three simple questions follow — is direction predictable after a gap, are gaps predictable from prior action, and do gaps get filled? We answered all three on 7 years of NQ with a placebo control, then tested the wait-and-see strategy everyone actually trades. The famous fill rate turns out to be about distance, not memory.
 Research
 Wickless Candle Strategy: We Backtested the '88% Win Rate' Claim on 7 Years of NQ
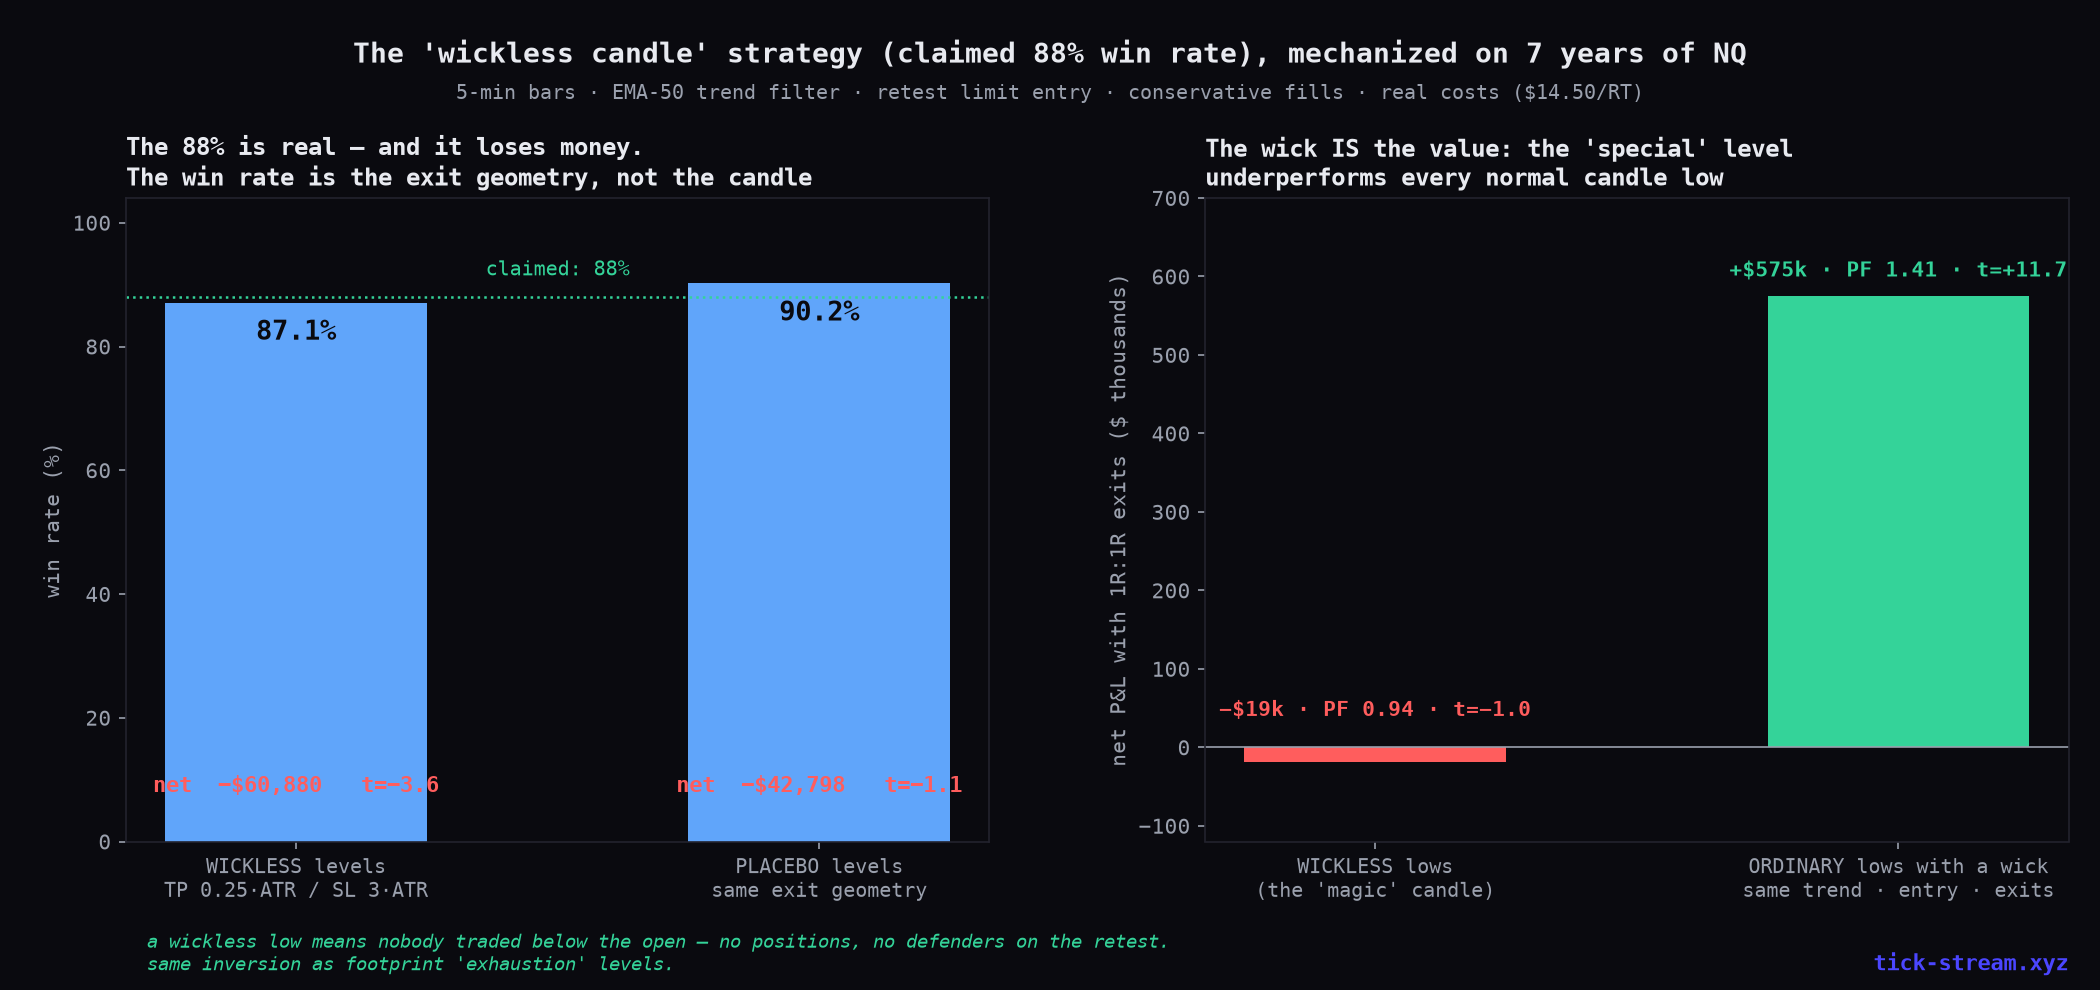
A viral entry model: find a candle with no bottom wick in an uptrend, mark it, buy the retest — claimed 88–90% win rate, 'changed my life'. We mechanized it exactly, on 7 years of NQ with conservative fills and real costs. The 88% win rate is real. It loses money. And the placebo test is brutal: ordinary candle lows WITH wicks beat the 'magic' wickless levels — the wick is the value.
 Research
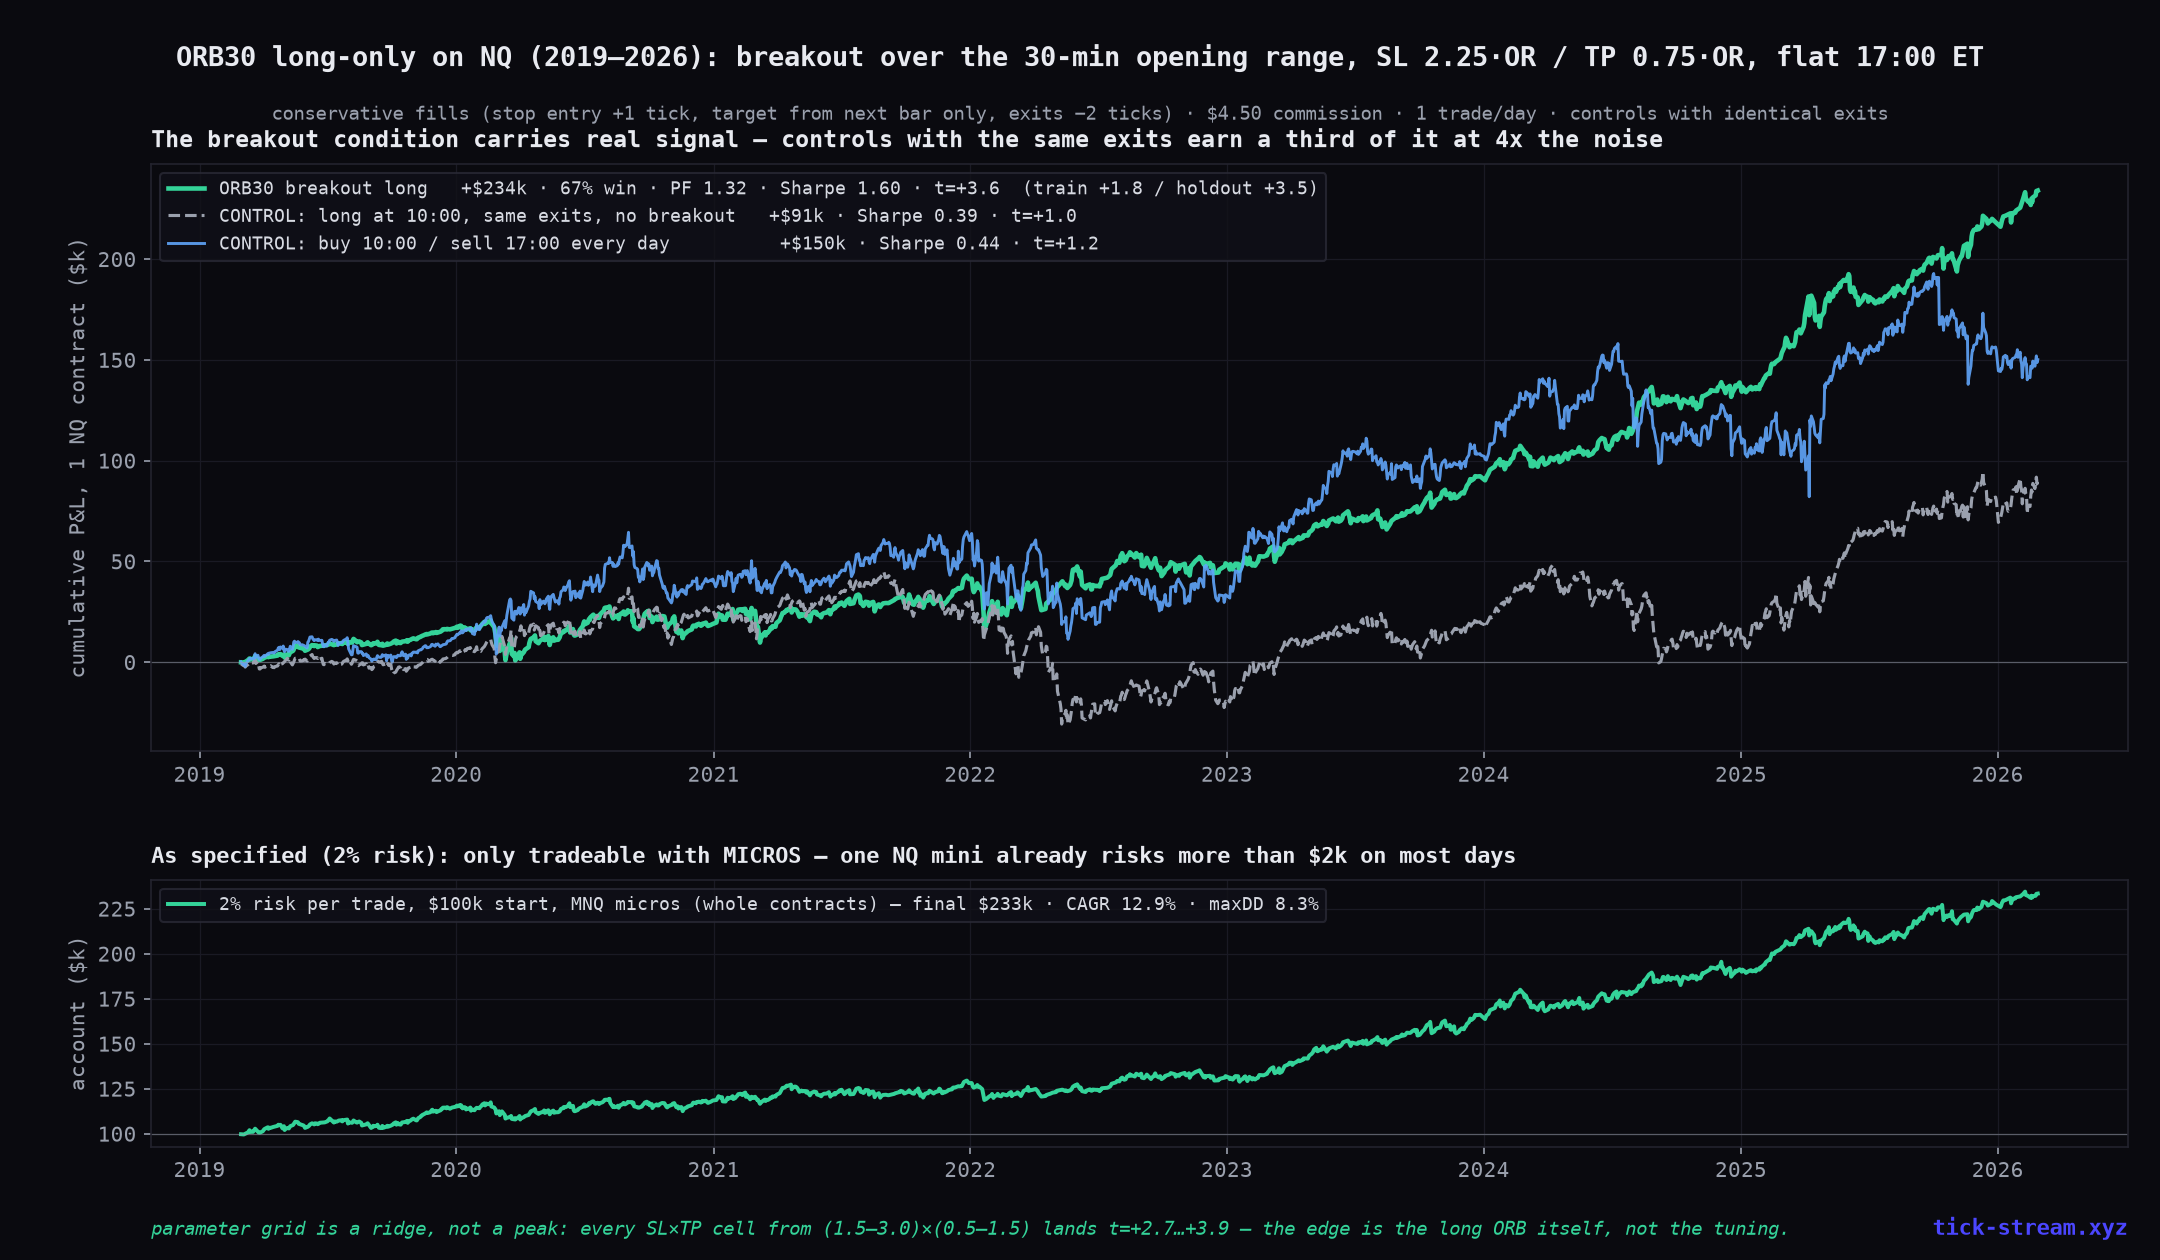
 ORB30 Strategy Backtest: 30-Minute Opening Range Breakout on NQ, 7 Years, Placebo-Controlled
A reader sent us a precise ORB30 spec: long-only breakout over the 30-minute opening range, stop at 2.25× the range, target at 0.75×, flat by 5pm, 2% risk, one trade a day. We ran it through the full discipline — conservative fills, real costs, train/holdout, two control groups and a parameter grid. It's one of the rare submissions that survives, with caveats worth reading.
 Research
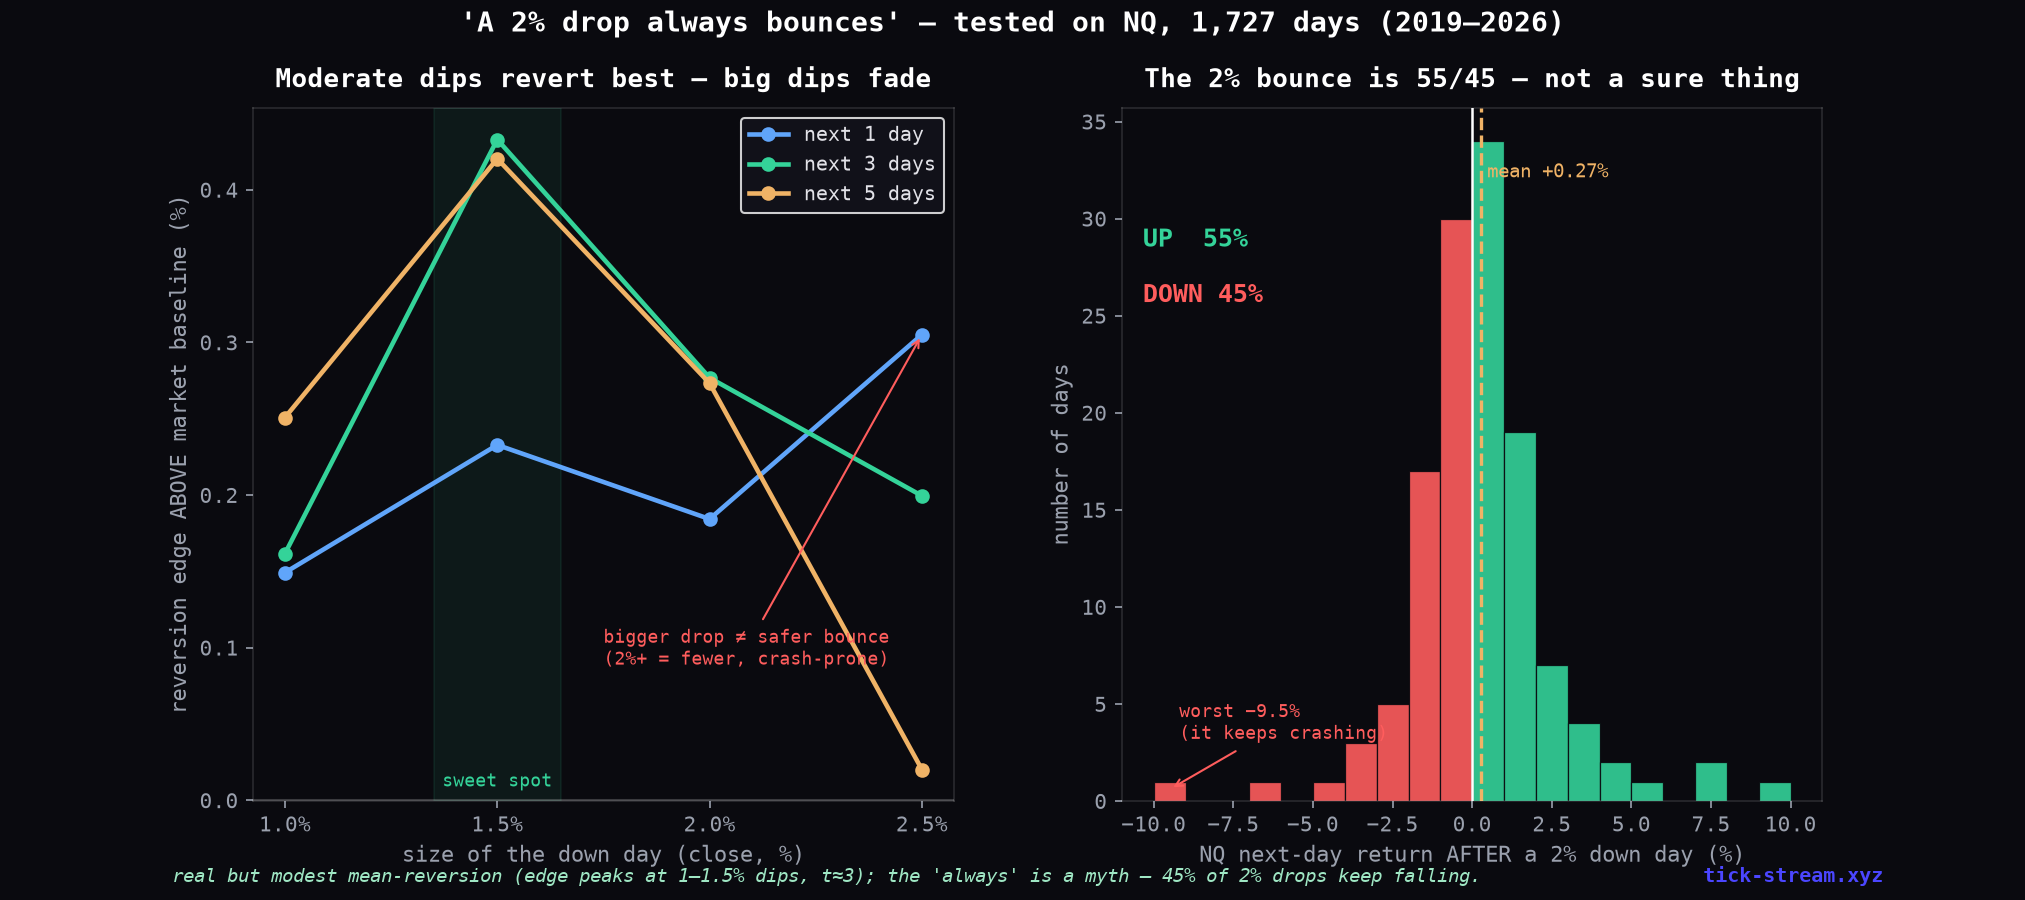
 "A 2% Drop Always Bounces" — We Tested Buy-the-Dip on 7 Years of NQ
Every trader has a friend with the same rule: when it falls 2%, it always comes back. We tested the literal rule and every variant of it on seven years of NQ daily data with real costs. The verdict is more interesting than a debunk: dip-buying on NQ is a real, statistically significant edge — but it peaks at MODERATE dips and fades exactly where the folk wisdom says it should be strongest. And 'always' is doing a lot of lying.
 Research
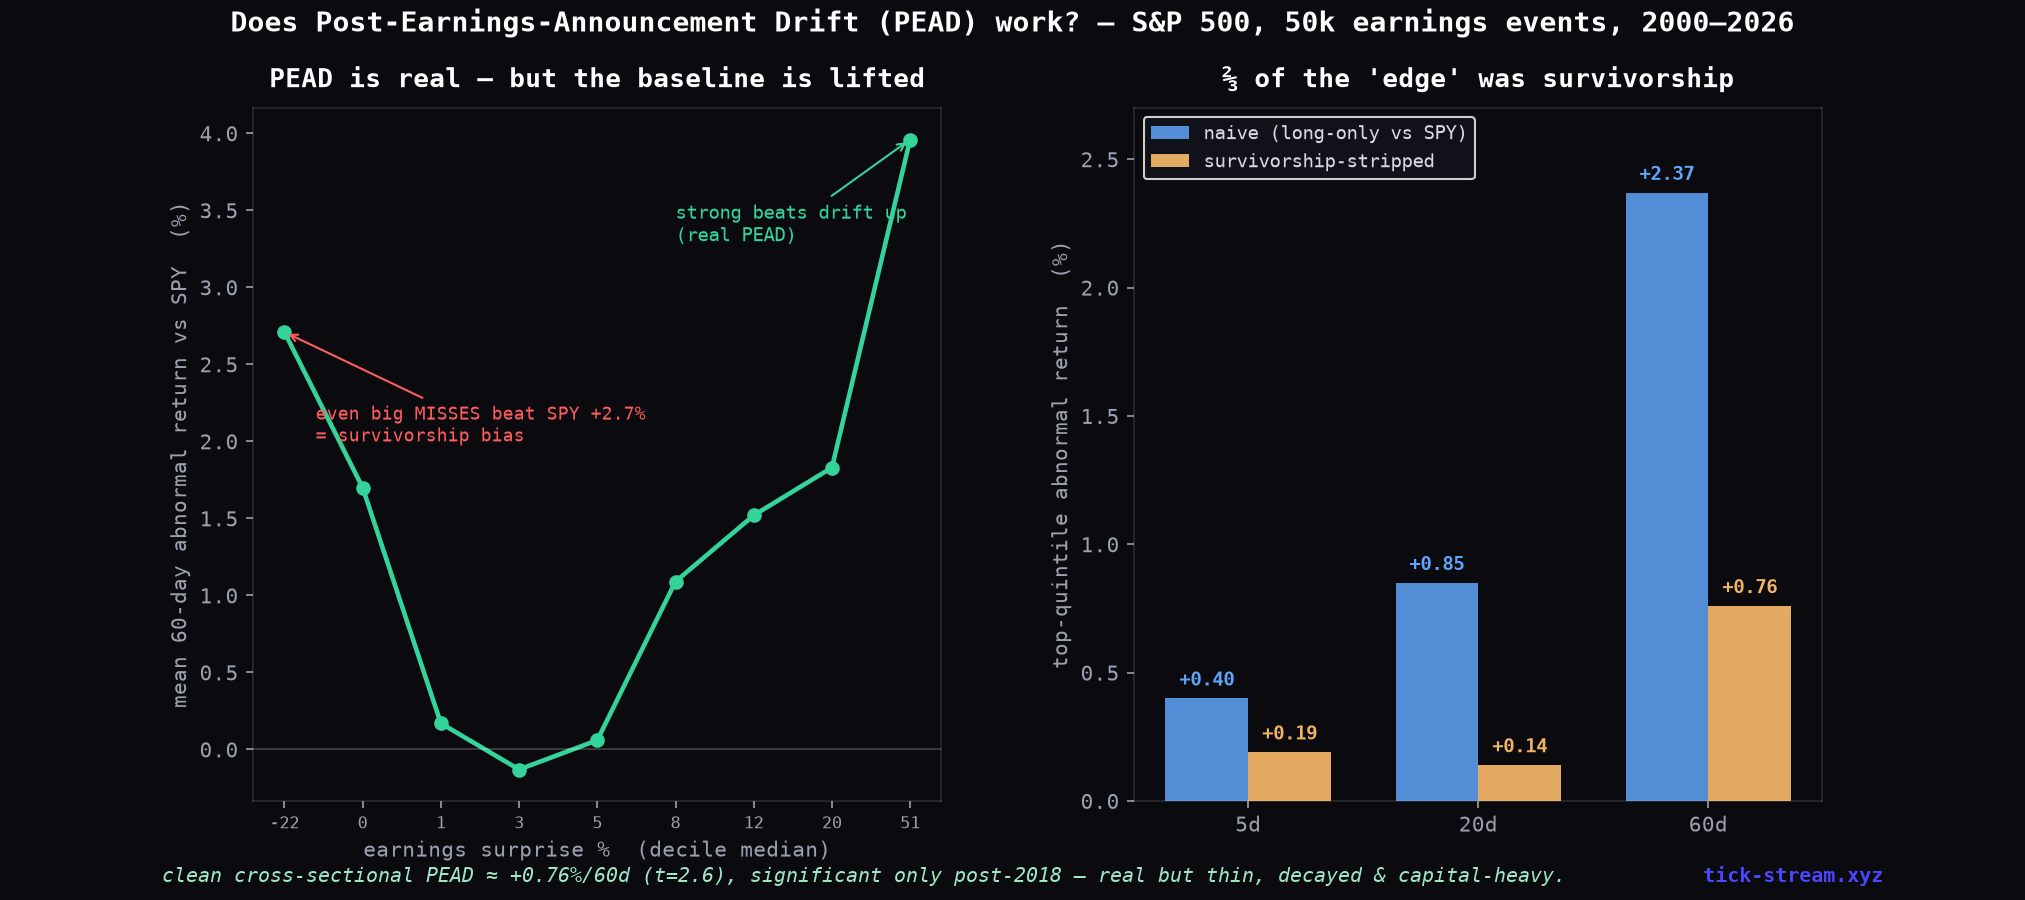
 Does Post-Earnings-Announcement Drift Still Work? We Tested 50,000 Earnings Events
PEAD — buy the stocks that beat earnings, ride the drift for a quarter — is one of the oldest documented anomalies in finance, and it's being resold today in glossy PDFs with smooth green equity curves. We tested it on 50,152 real earnings events across the S&P 500, 2000–2026, with consensus-estimate surprises and real prices. The drift is real. About two-thirds of the marketed 'edge' is not — it's survivorship bias. Here's how to tell the difference.
 Research
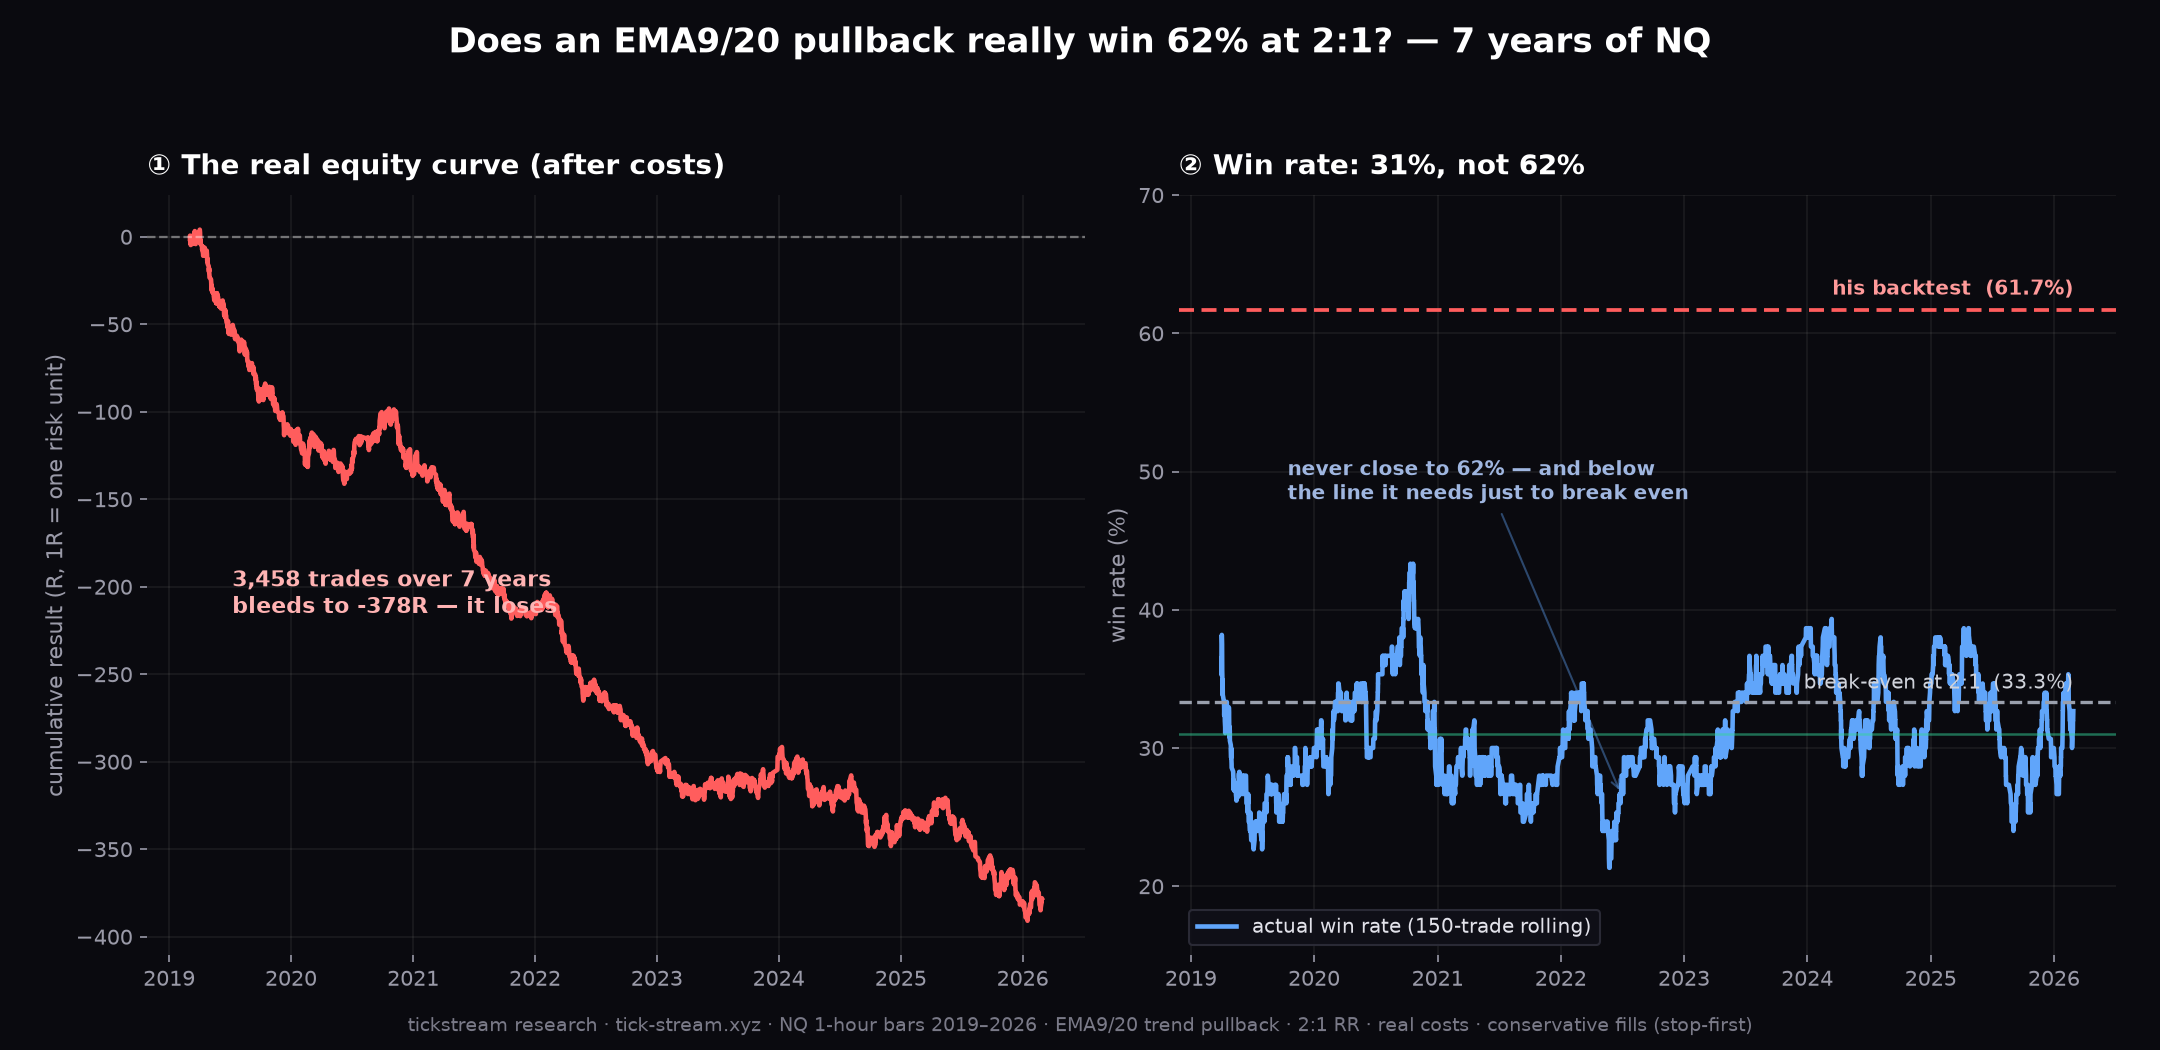
 The EMA 9/20 Pullback Strategy: 62% Win Rate Claimed, 31% Measured
The EMA 9/20 pullback is one of the most-taught entries on trading YouTube: trade with the fast-EMA trend, buy the pullback to the slow EMA, 2:1 reward-to-risk. A trader shared their 61.7% win-rate backtest with us. We ran the same rule on seven years of NQ hourly data with conservative fills and real costs: 31% win rate, negative expectancy. Here's the specific artifact that manufactures win rates like that — and how to check your own backtest for it.
 Research
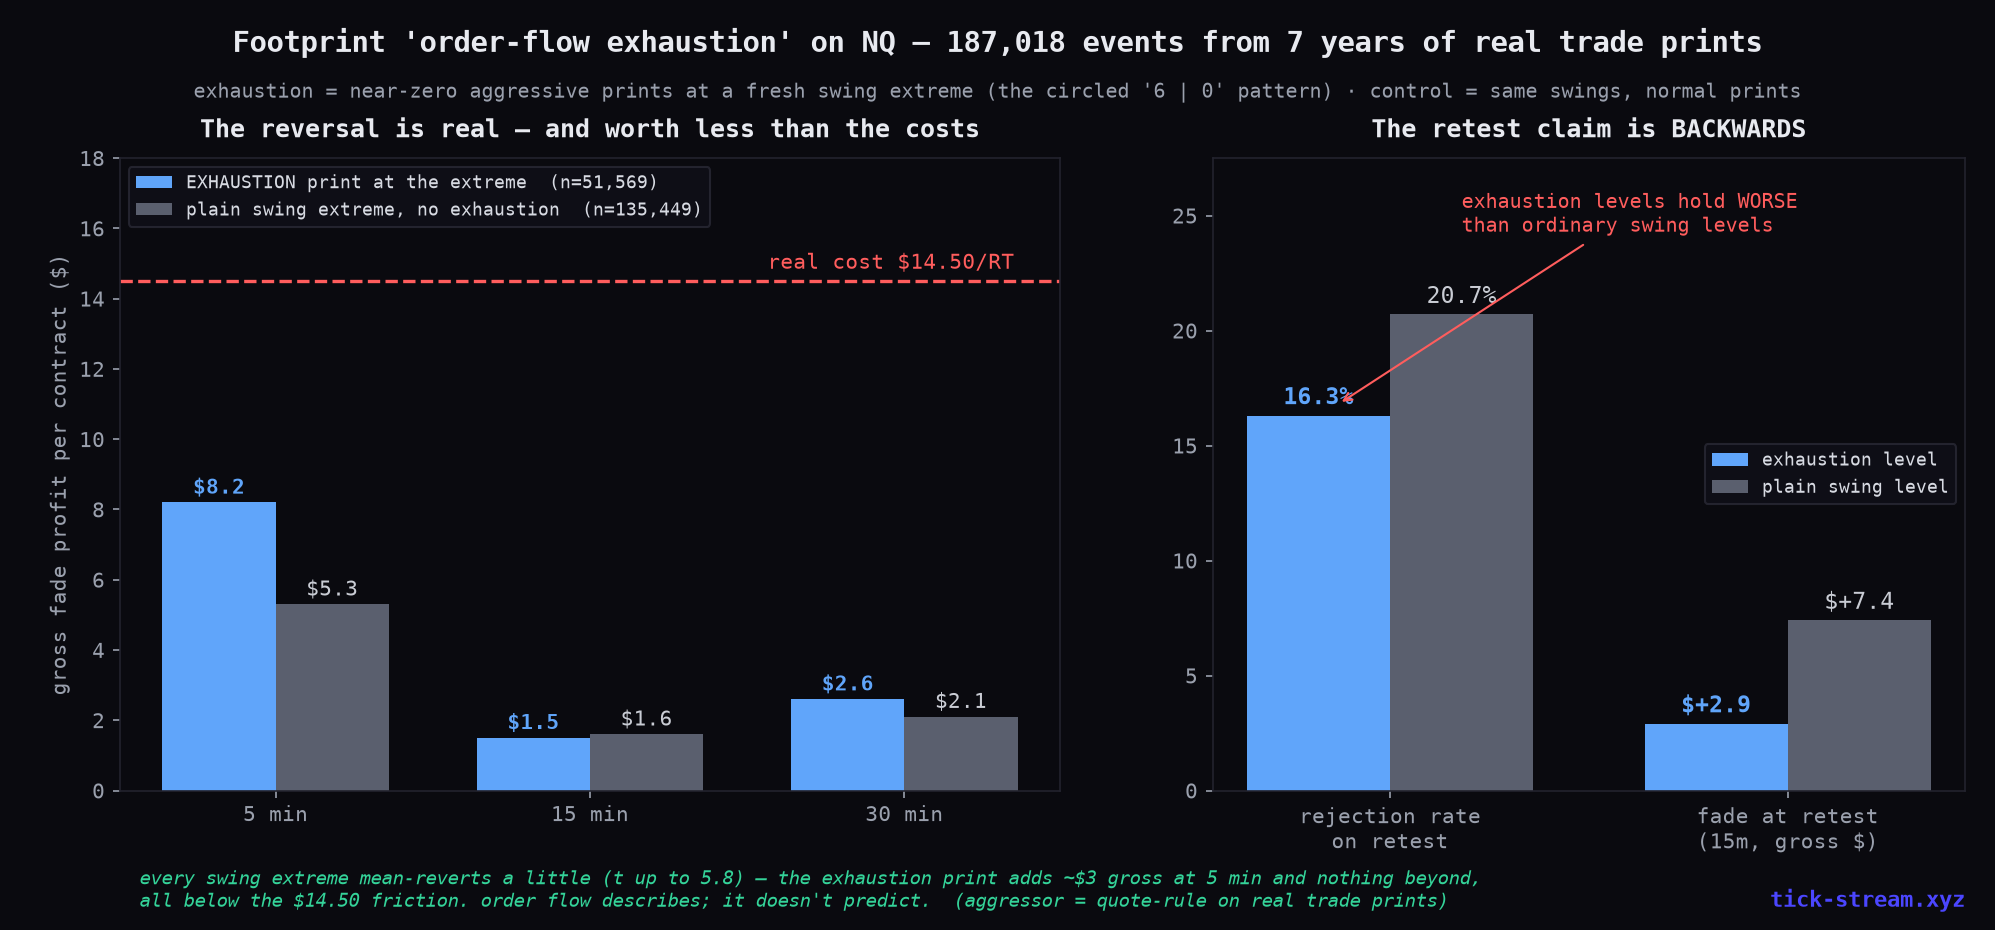
 Footprint Order-Flow Exhaustion: We Tested 187,018 Events — the Retest Claim Is Backwards
Footprint traders circle the '6 | 0' prints at a swing extreme and call it exhaustion: buyers are done, price reverses, and when price retests that level it rejects again. We built footprints from 7 years of real NQ trade prints (aggressor via quote rule against the prevailing bid/ask) and tested 187,018 events against a control group. The reversal is real — and worth less than the round-trip costs. And the retest claim isn't just unproven, it's inverted: exhaustion levels hold WORSE than ordinary swing levels.
 Research
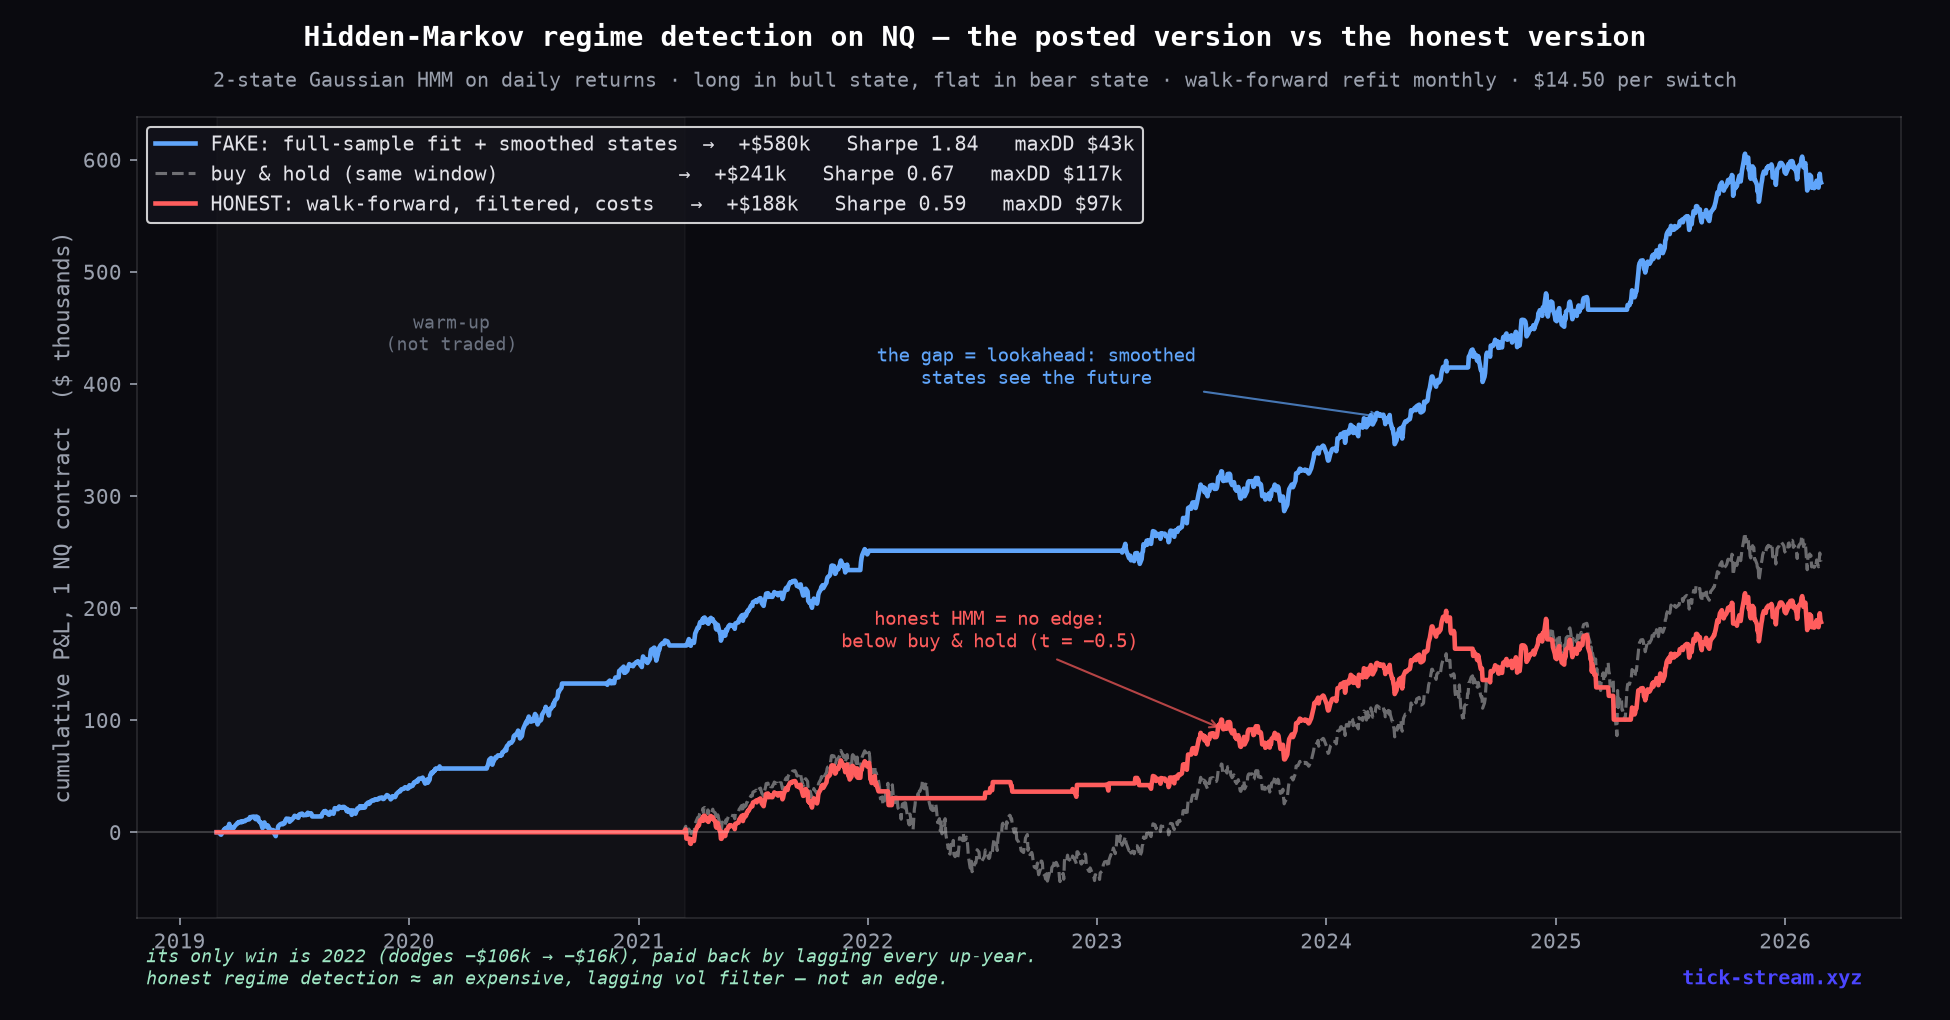
 Hidden Markov Model Trading: Regime Detection Only Works When It Sees the Future
HMM regime detection is the most convincing-looking strategy in quant trading: fit a hidden Markov model on daily returns, go long in the bull state, flat in the bear state — and the backtest prints Sharpe 1.84 while sitting out the entire 2022 bear. We rebuilt it honestly on 7 years of NQ: walk-forward, filtered states only, real switching costs. Sharpe drops to 0.59 — below buy-and-hold. The gap is pure lookahead, and it's hiding in one word: smoothed.
 Guides
 How to Code a Trading Algorithm: The Roadmap That Survives an Honest Backtest
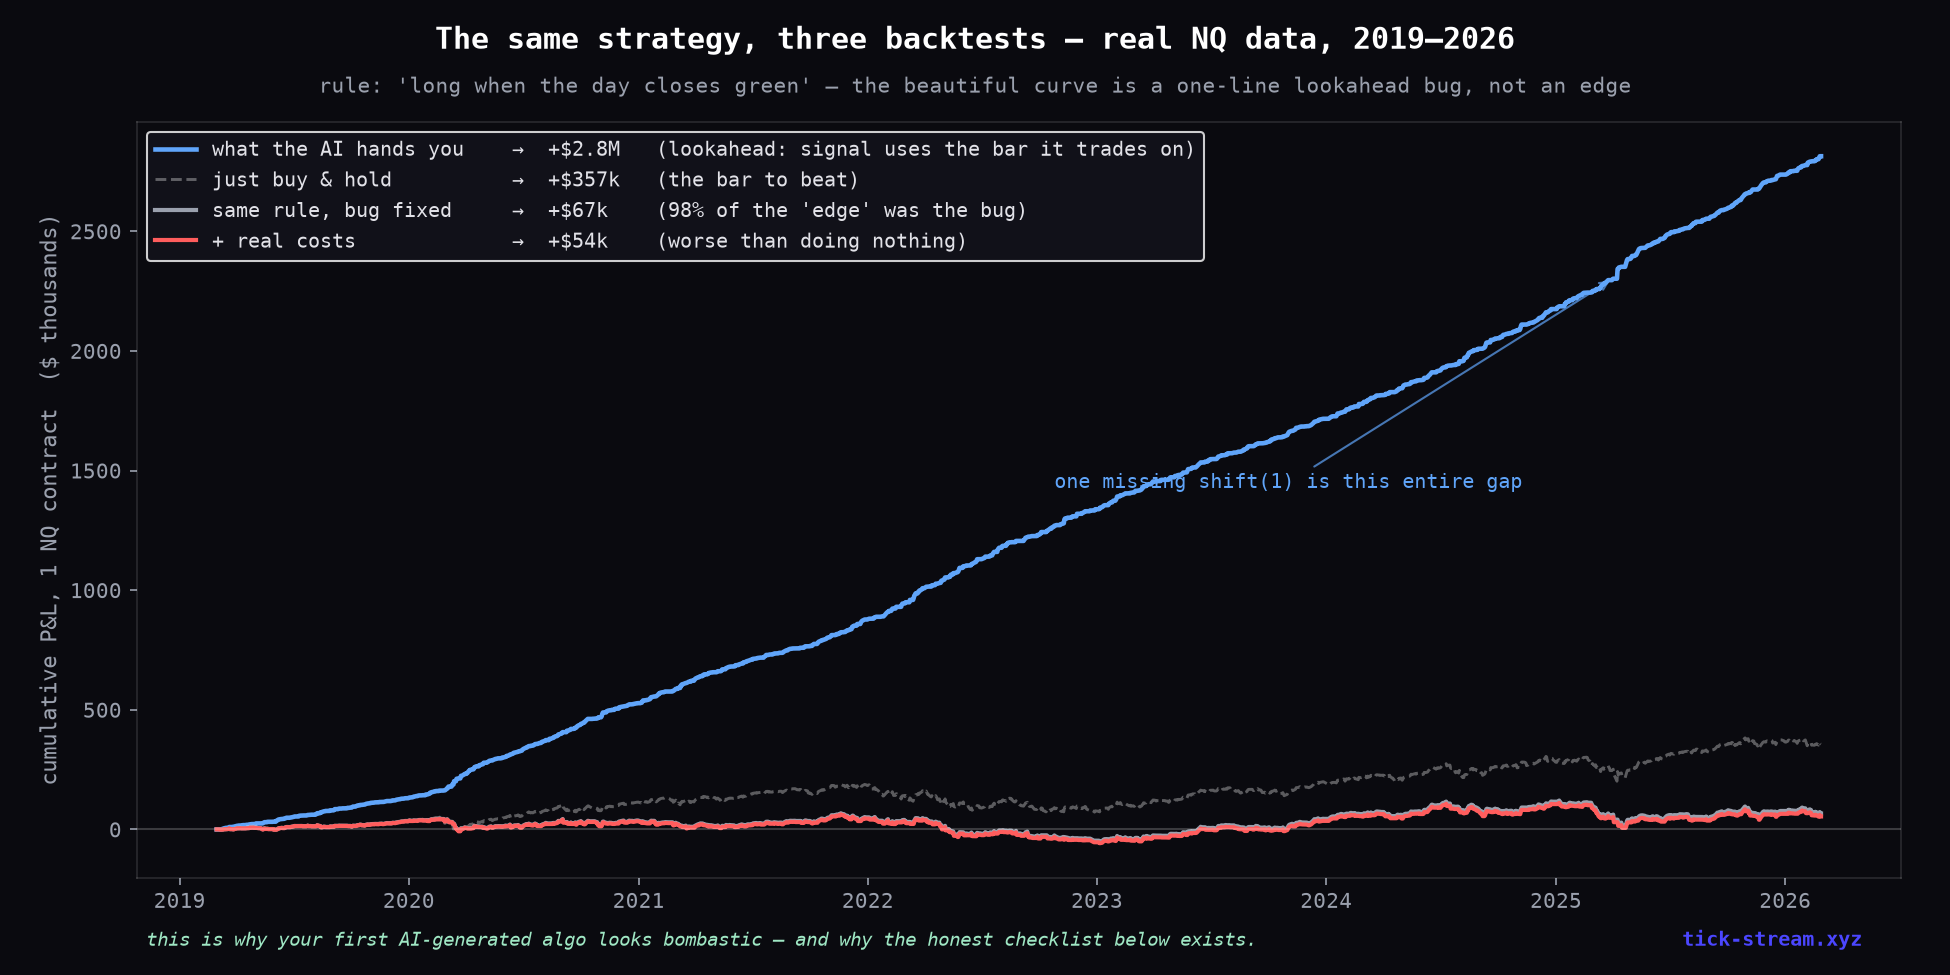
How to start algo trading without fooling yourself. Everyone's first AI-assisted trading algorithm backtests like a money machine — and it's almost always wrong. The complete roadmap: which market data you need (tick data vs OHLCV), how to backtest a trading strategy honestly (point-in-time, conservative fills, real costs, out-of-sample, placebo tests), how to use AI coding agents like Claude Code for strategy research, and why most of your ideas should die. Based on testing dozens of strategies on 7 years of real NQ tick data.
 Research
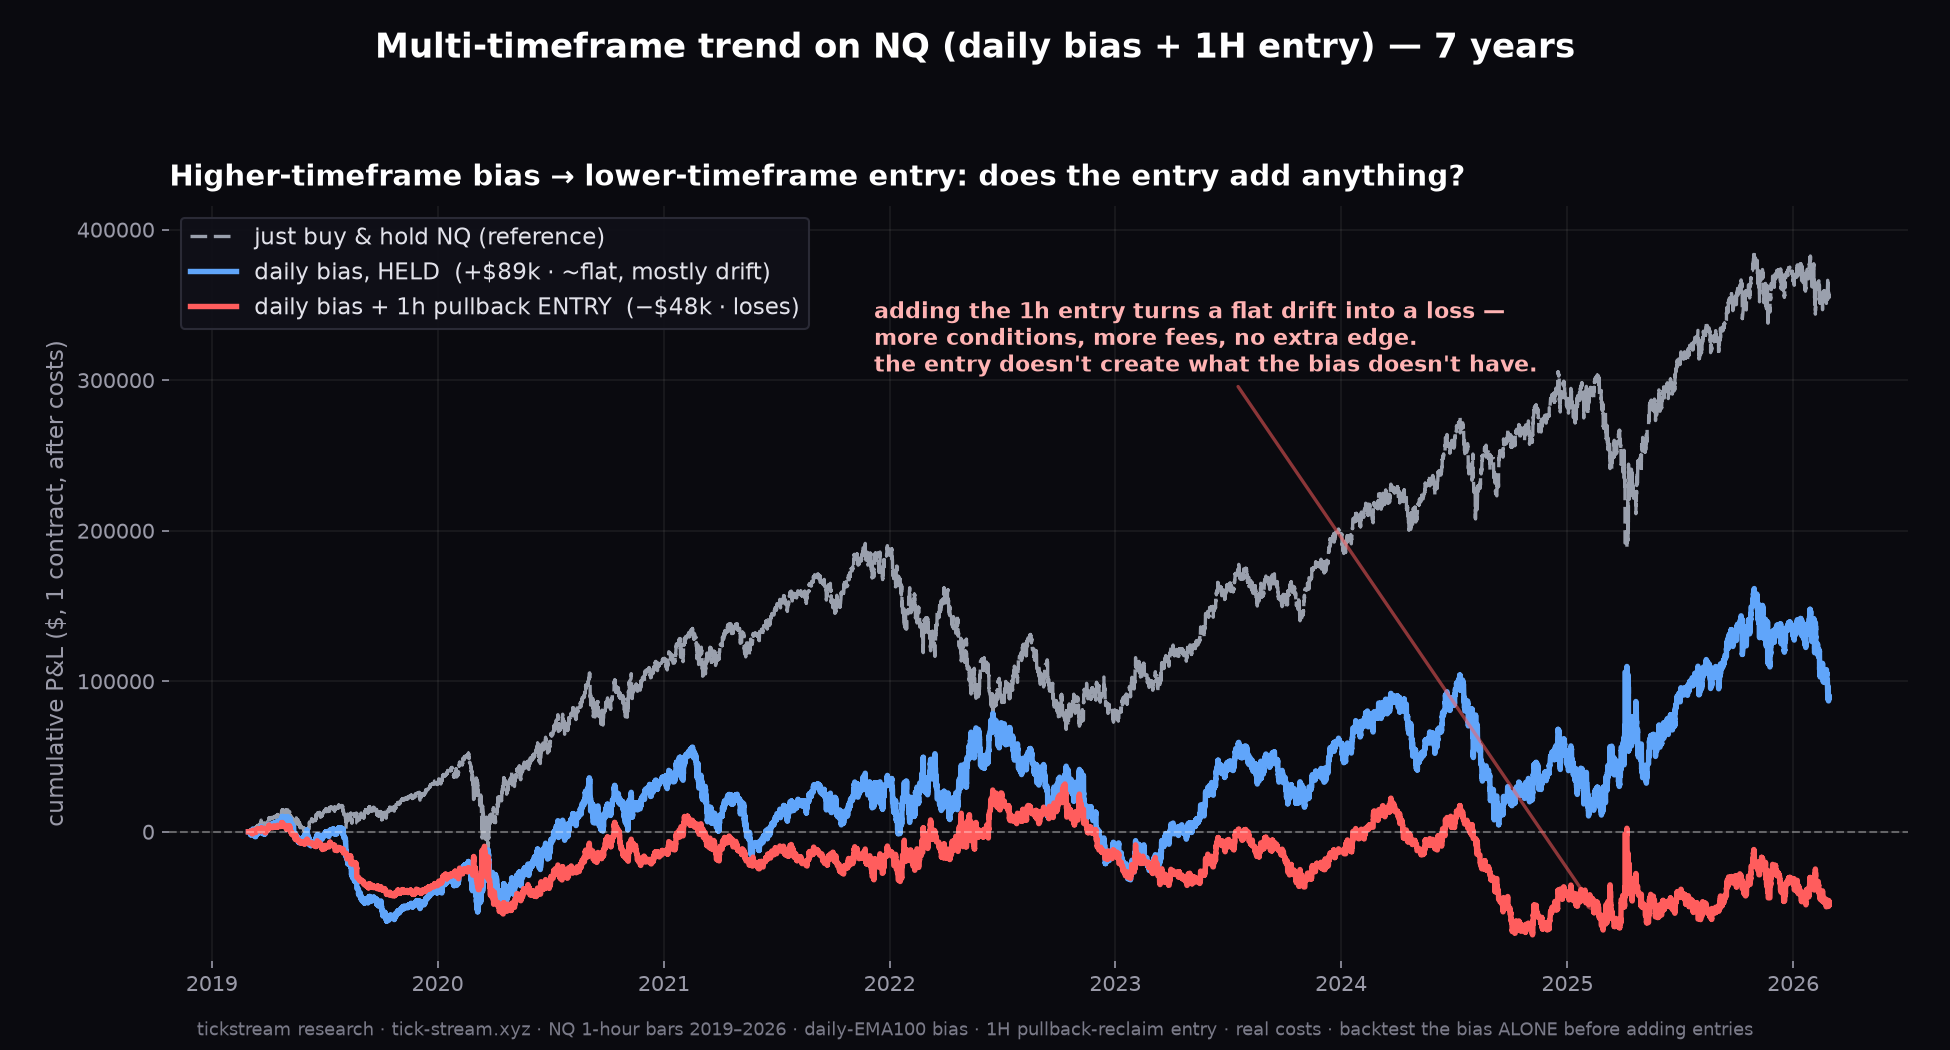
 Higher-Timeframe Bias, Lower-Timeframe Entry: Does the Entry Actually Add Anything?
It's the most universally taught structure in trading: form your bias on the daily, execute on the hourly for a 'better price'. We separated the two components on seven years of NQ — the daily bias held alone versus the same bias traded through 1-hour pullback entries. The bias earned +$89k. Adding the entry turned it into −$48k. The precision entry didn't refine the edge; it deleted it.
 Research
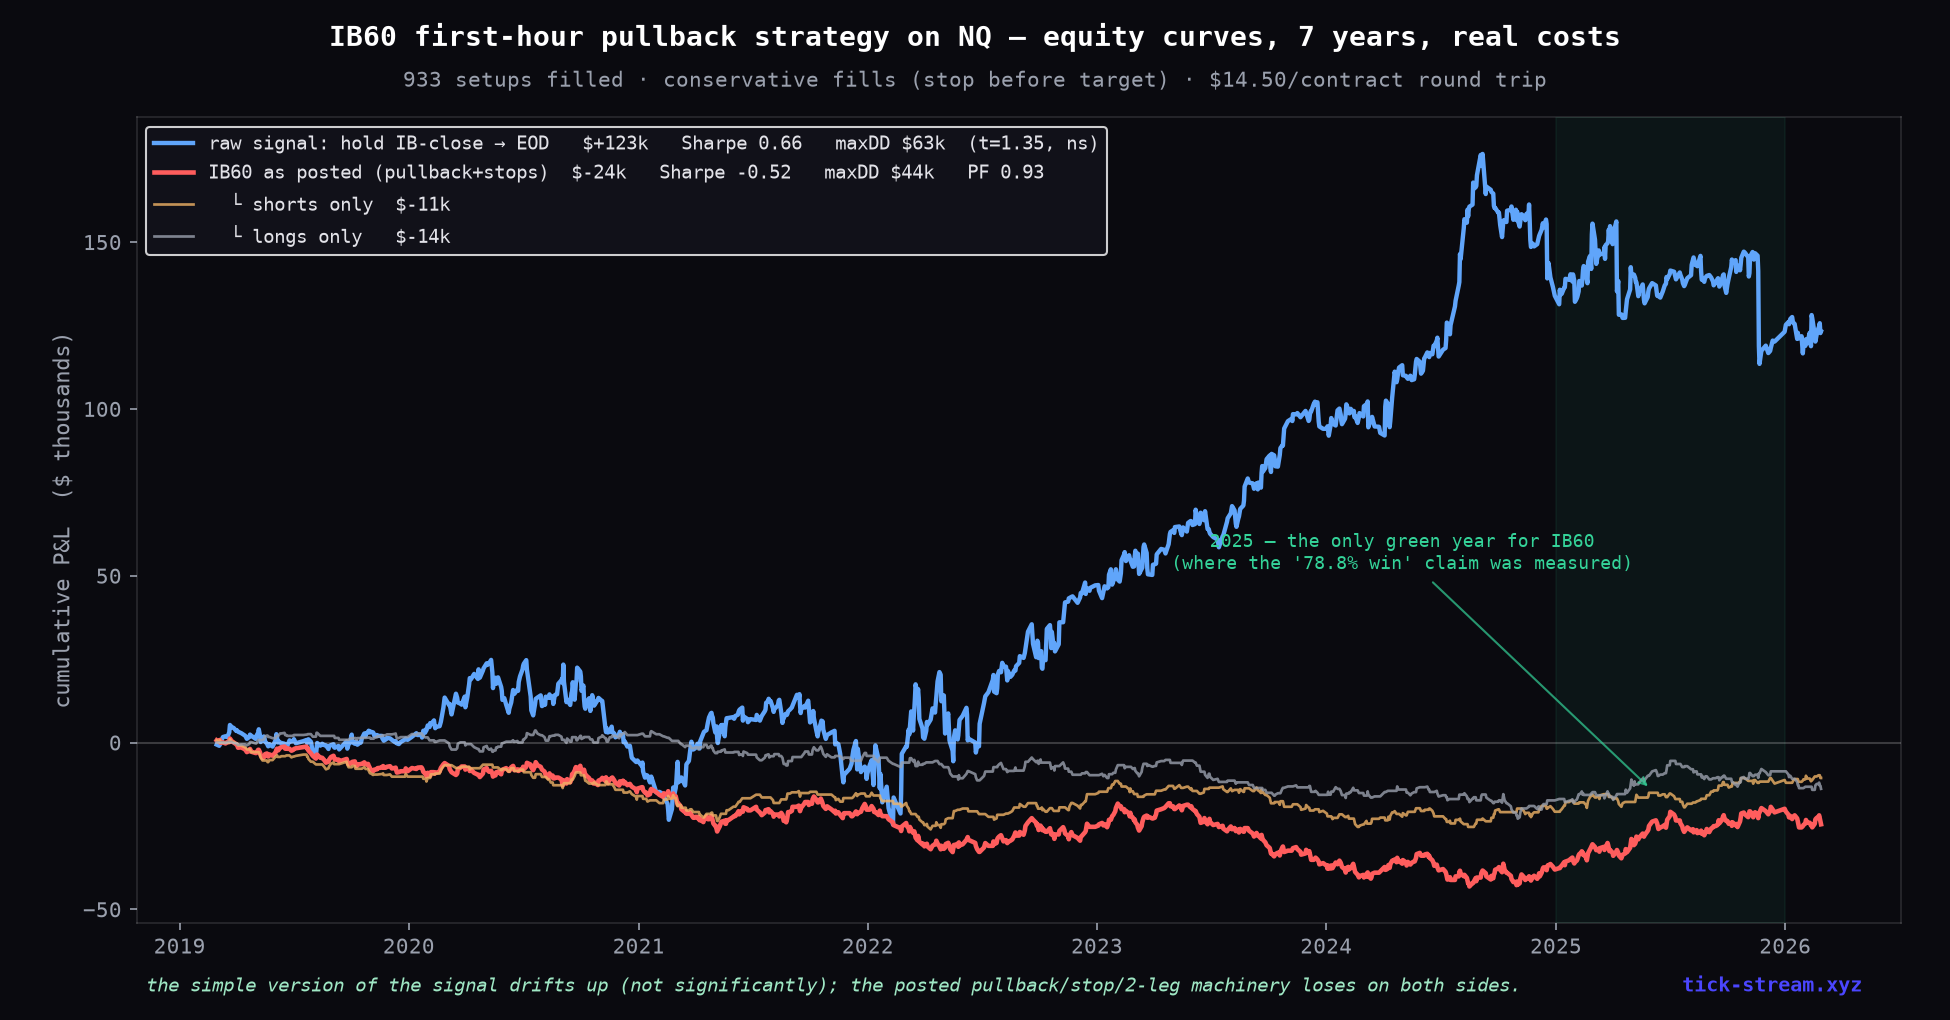
 A 78% Win-Rate First-Hour Strategy Went Viral. We Ran It on 7 Years of NQ.
The IB60 setup — first-hour initial balance, close outside the 15-minute opening range, dynamic pullback entry, two-leg exits — was posted with 33 trades, a 78.8% win rate and a 4.39 profit factor. We rebuilt the exact rules and ran them on seven years of NQ minute data with conservative fills and real costs: 38.6% win rate, profit factor 0.93, net negative. The interesting part is WHERE the edge leaks out — because the underlying signal is actually real.
 Research
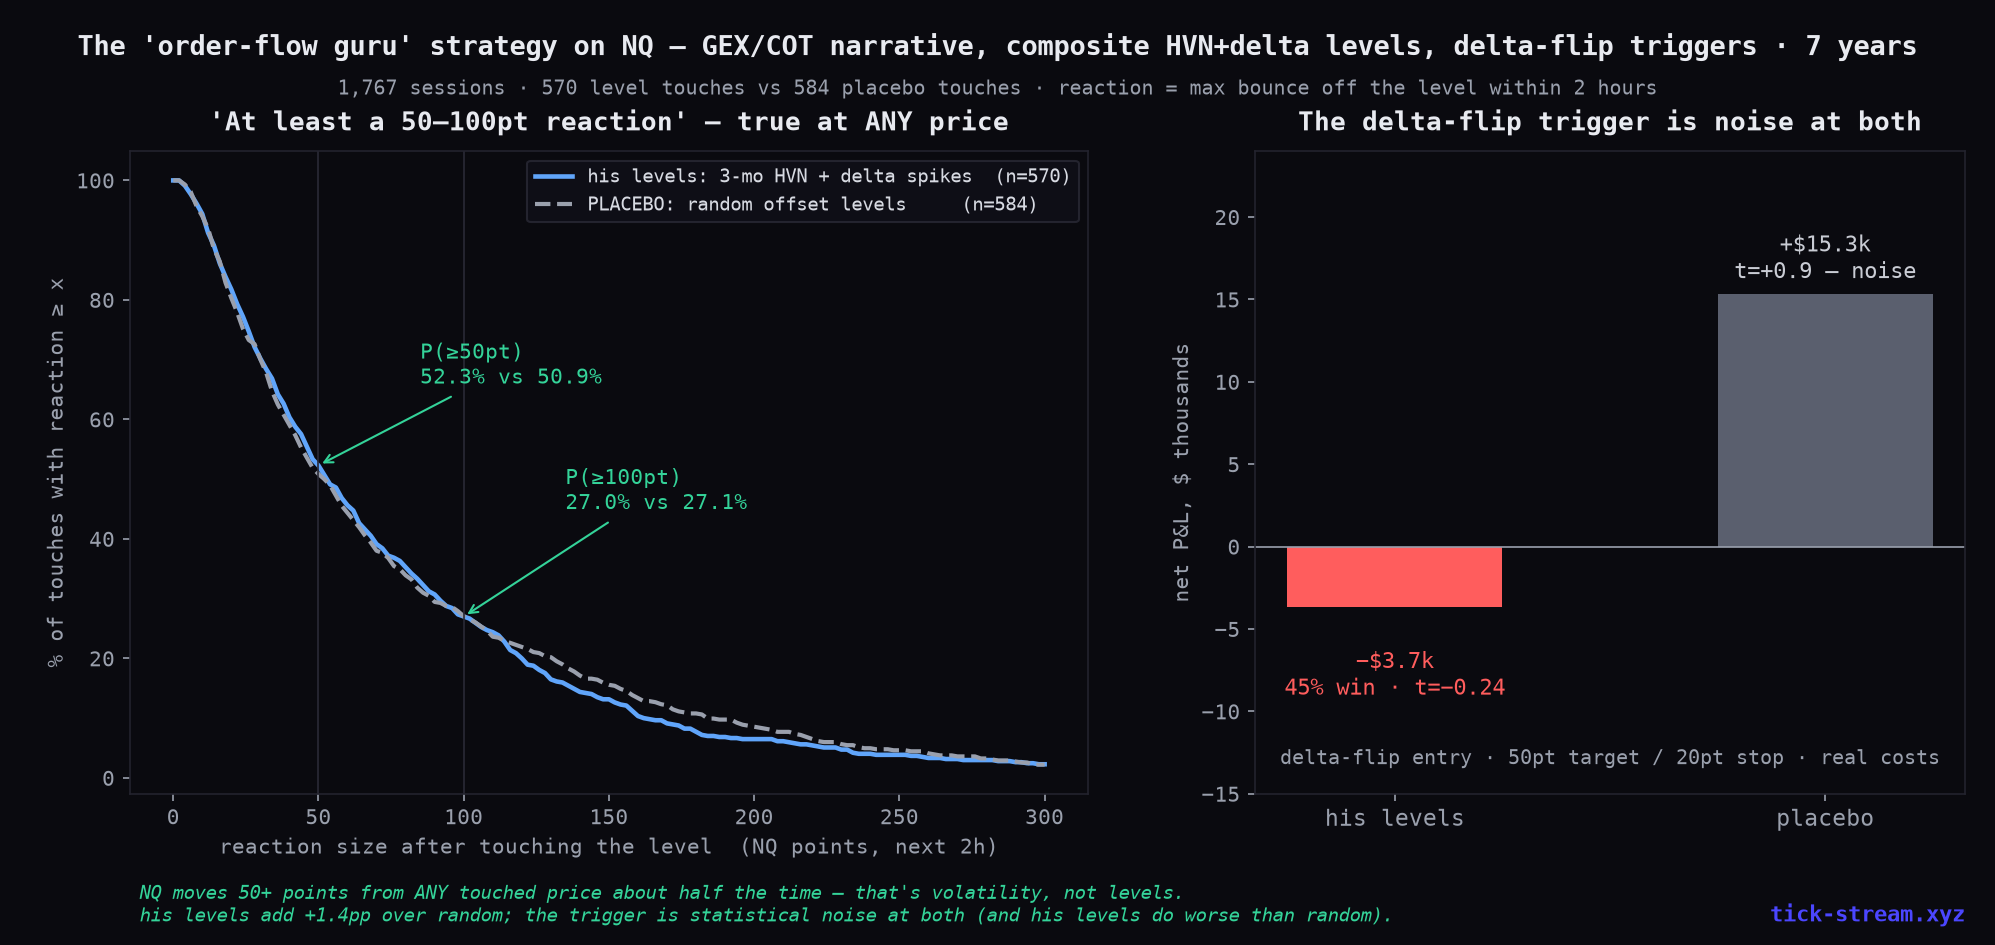
 A Viral Order-Flow Strategy Promised 50–100 Point Reactions. Random Levels Deliver the Same.
The strategy had everything: GEX and COT for the narrative, three-month composite-profile high-volume nodes with delta spikes for location, absorption-then-initiation on the footprint for the trigger — and one memorable promise: 'at least a 50–100 point reaction on Nasdaq' when price comes back to a level. We mechanized the whole stack on 7 years of NQ tick data and ran it against randomly placed levels. The 50-point reaction is real — at any price you pick. It's a base-rate illusion, and it's the most common trick in trading content.
 Research
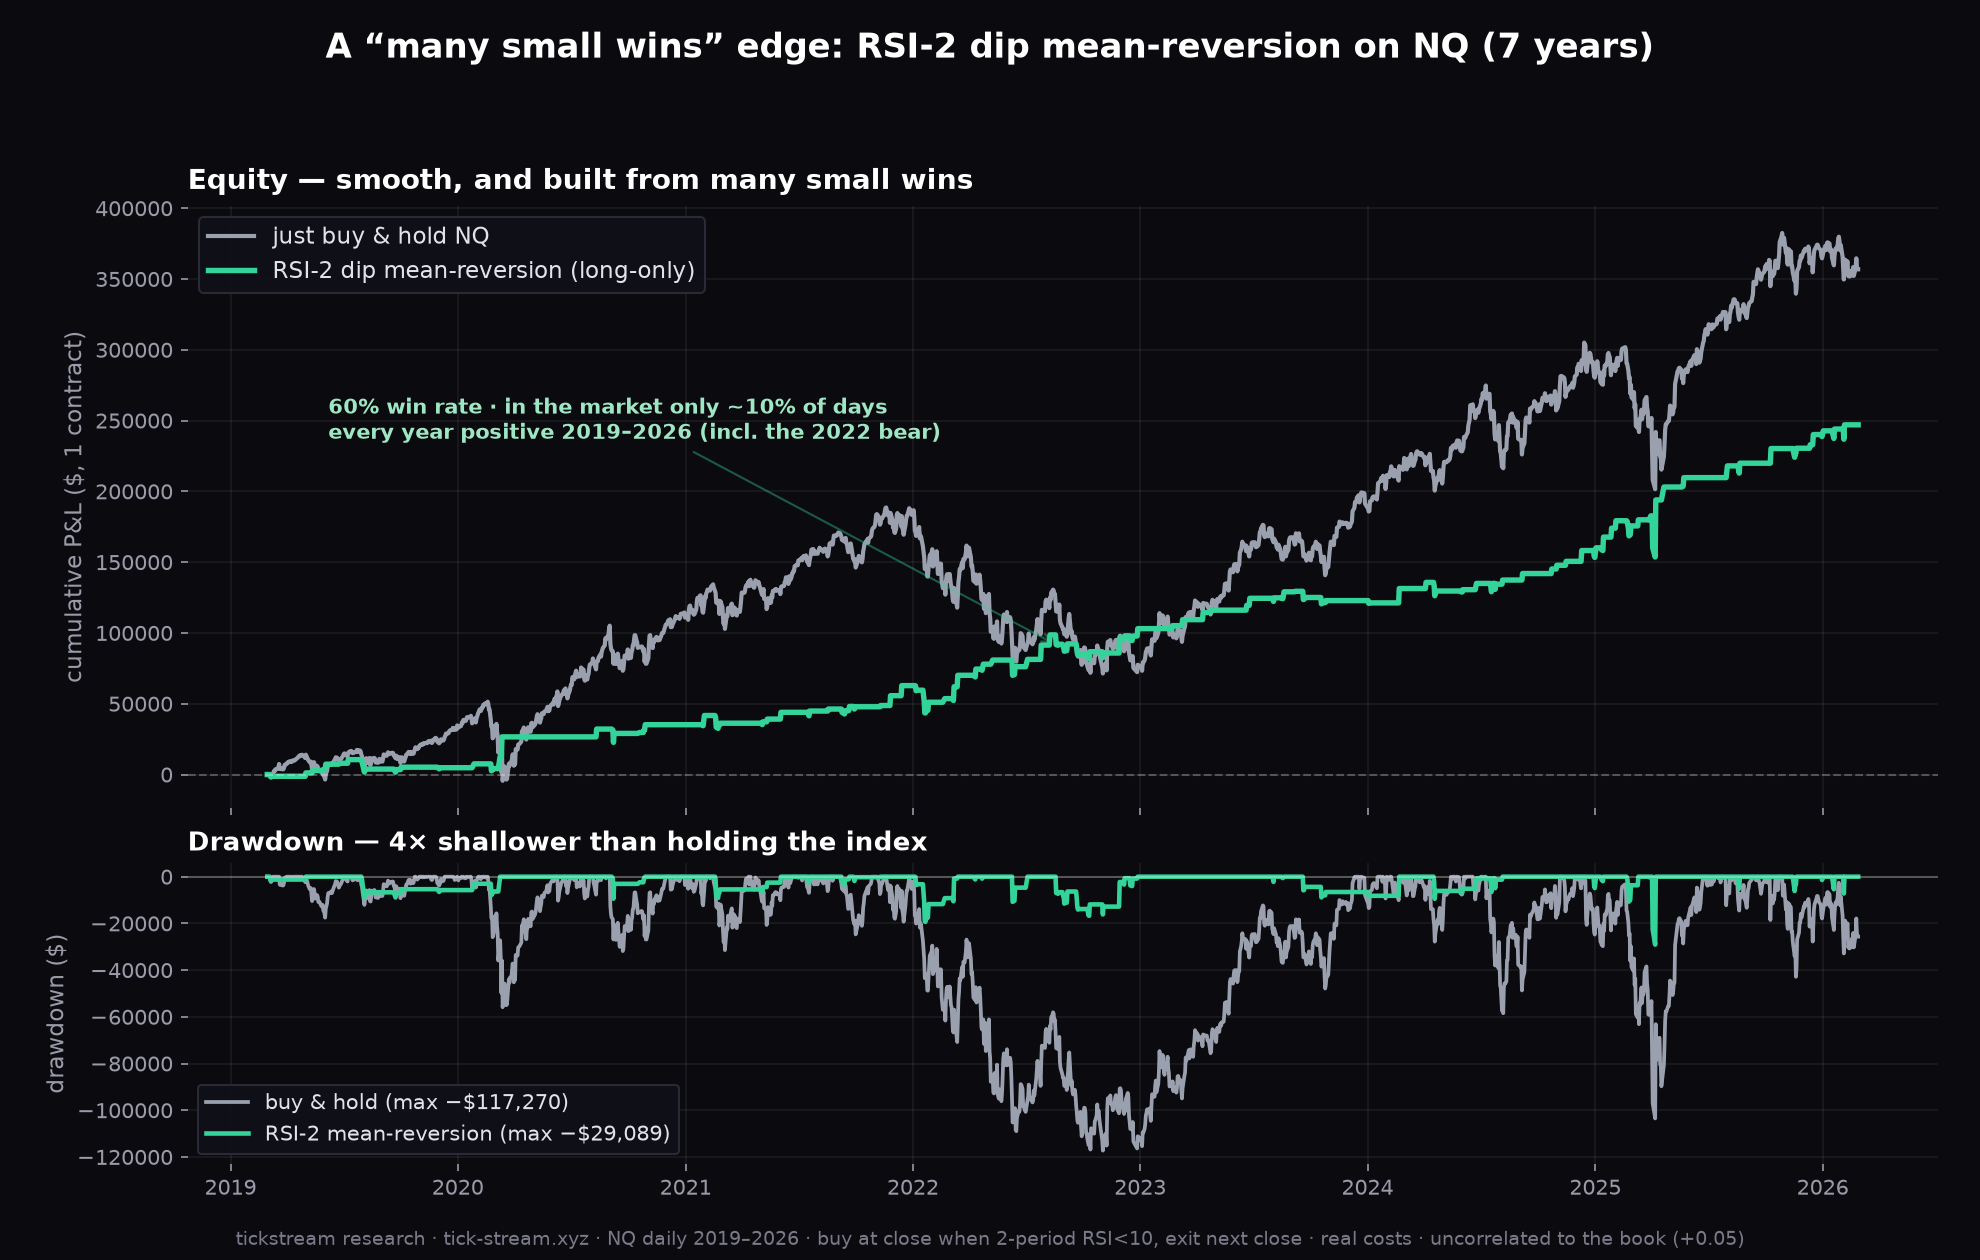
 The One Dip-Buying Rule That Was Positive Every Single Year: RSI-2 on NQ
We publish a lot of debunks, so here's the other kind of result. A reader asked for a 'many small wins' strategy, and we swept the whole mean-reversion family on seven years of NQ daily data. One classic rule survived everything we threw at it: buy the close when 2-period RSI drops below 10, exit the next close. 60% win rate, profit factor 2.13, positive every year from 2019 through 2026 — including the 2022 bear. Here's the full test, including the parts that DON'T work.
 Research
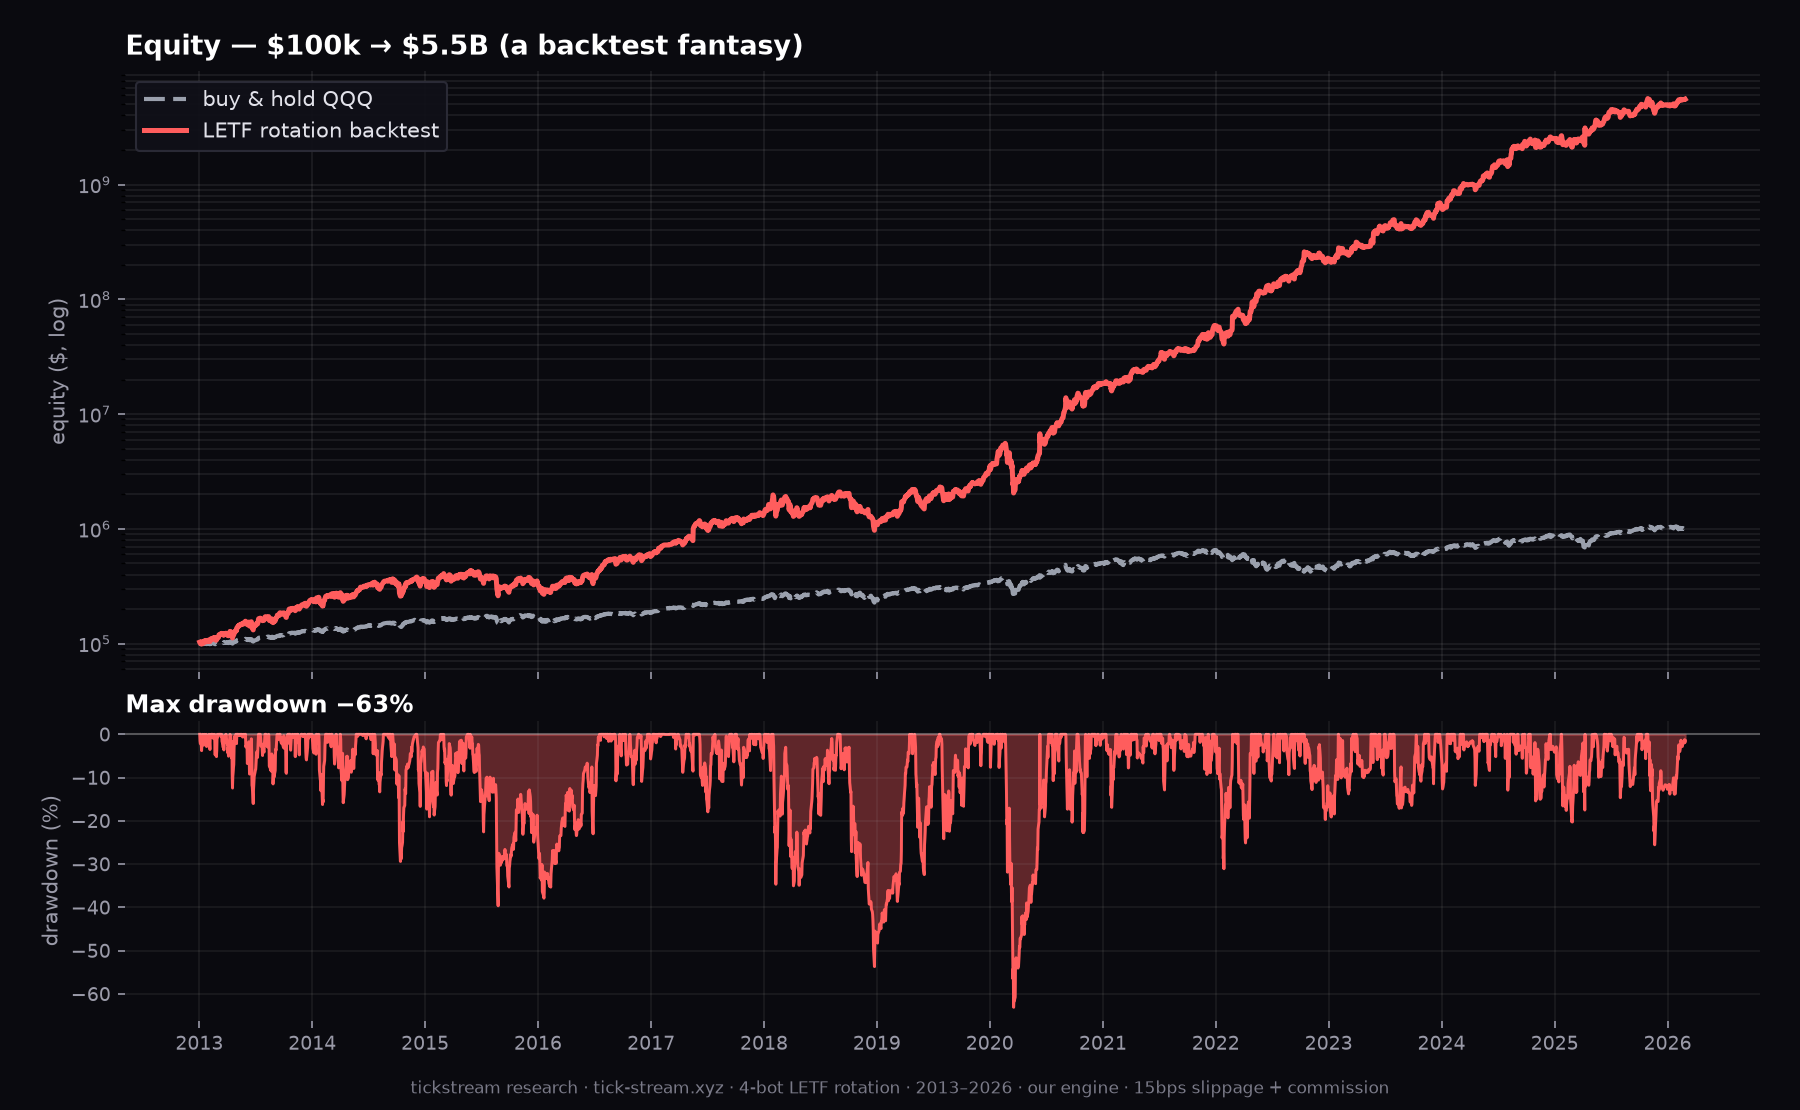
 The Leveraged-ETF Rotation Backtest That Turns $100k Into Billions — And Why You Can't Trade It
Leveraged-ETF rotation 'symphonies' — daily RSI/SMA bots flipping between TQQQ, SOXL and volatility hedges — are everywhere on retail trading forums, and their backtests look unreal. We ported one to our engine and ran it on 13 years of real data with real costs. It turns $100k into $5.5 billion. Here's exactly why that's a red flag and not an edge, and what a tradable version would look like.
 Research
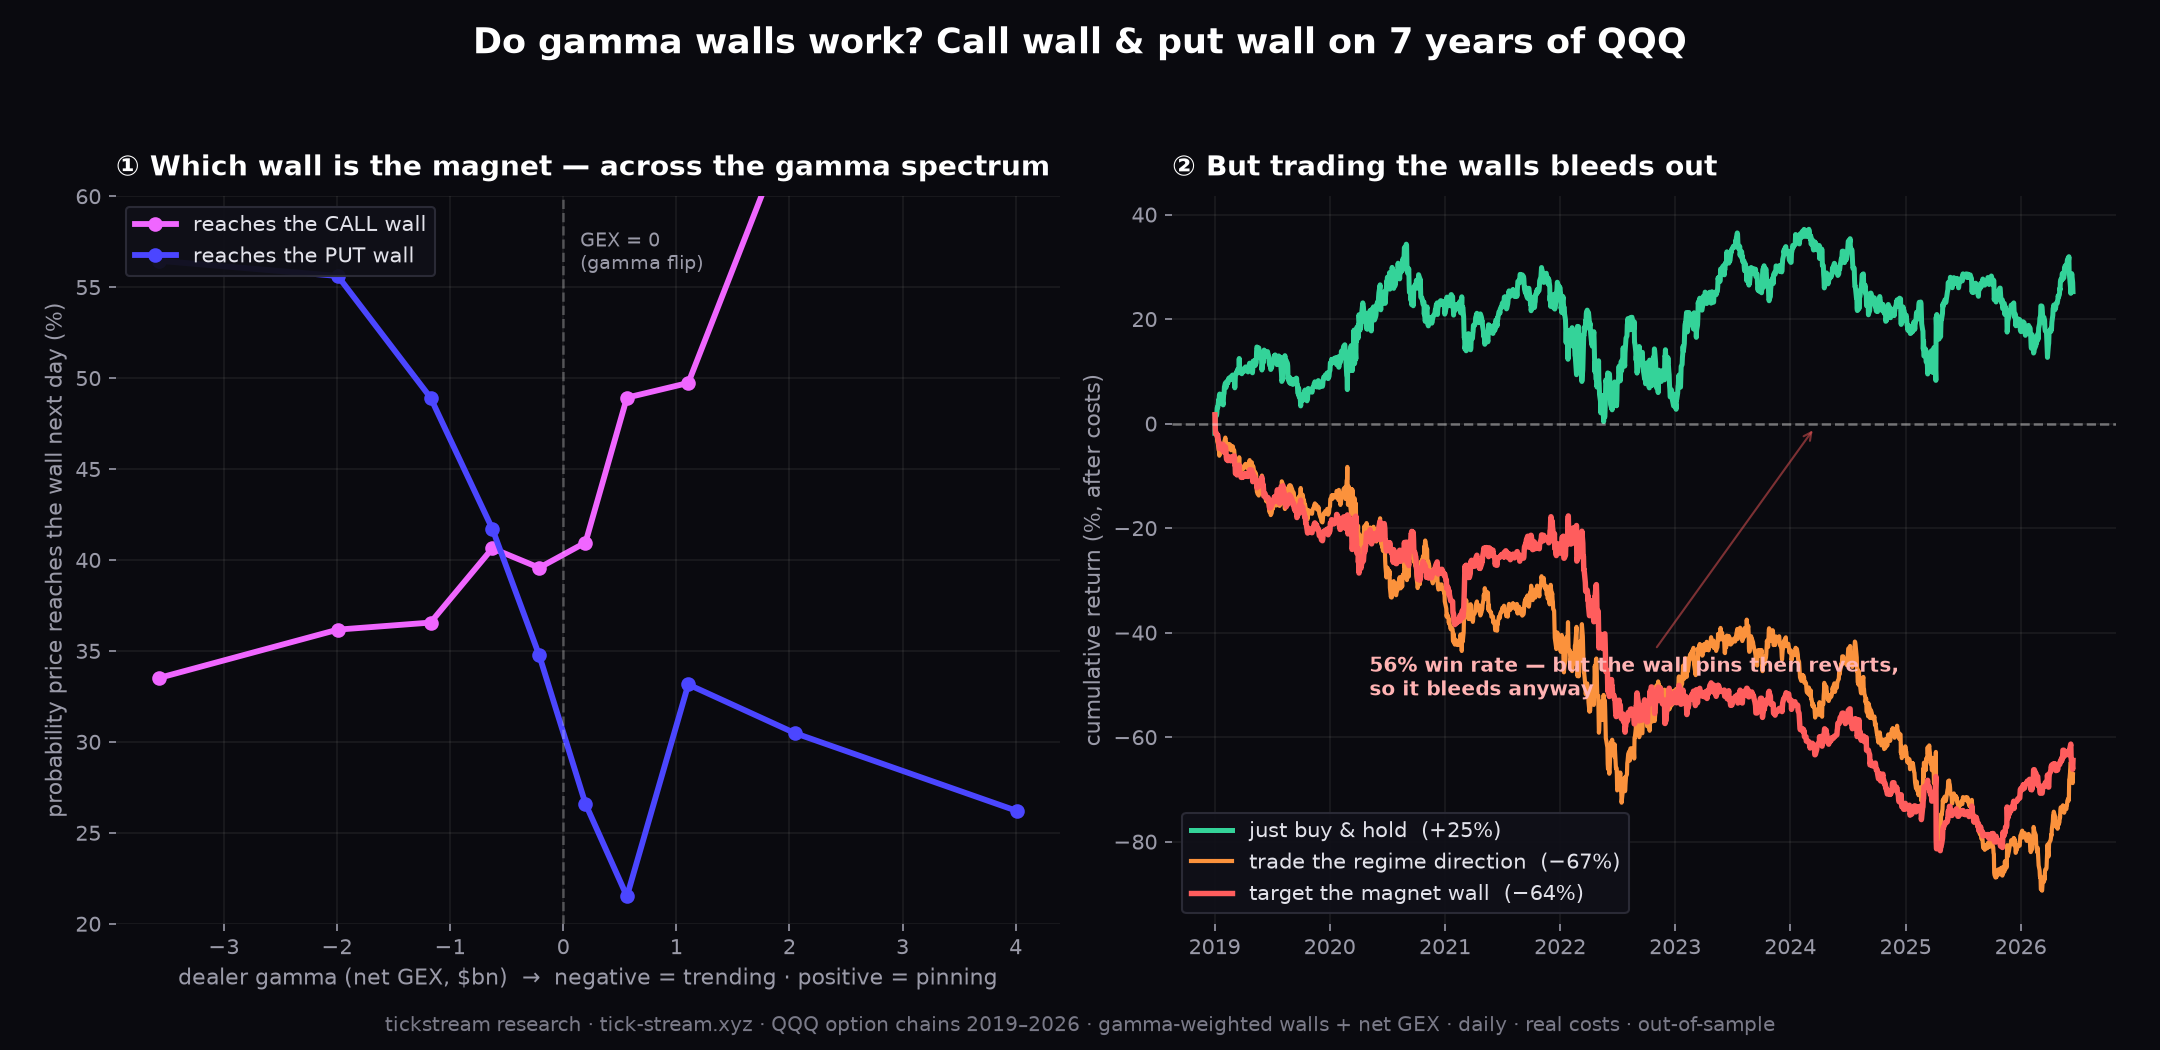
 Do Gamma Walls Actually Work? Call Wall & Put Wall Tested on 7 Years of QQQ
The call wall and put wall are everywhere in options-flow trading — 'price gets pinned to the call wall', 'the put wall is support'. We rebuilt gamma-weighted walls from 7.5 years of real QQQ option chains and tested them. The walls are genuinely informative about which way price drifts — but trying to trade them loses money. What's real, what's a trap, and how much it's actually worth.
 Research
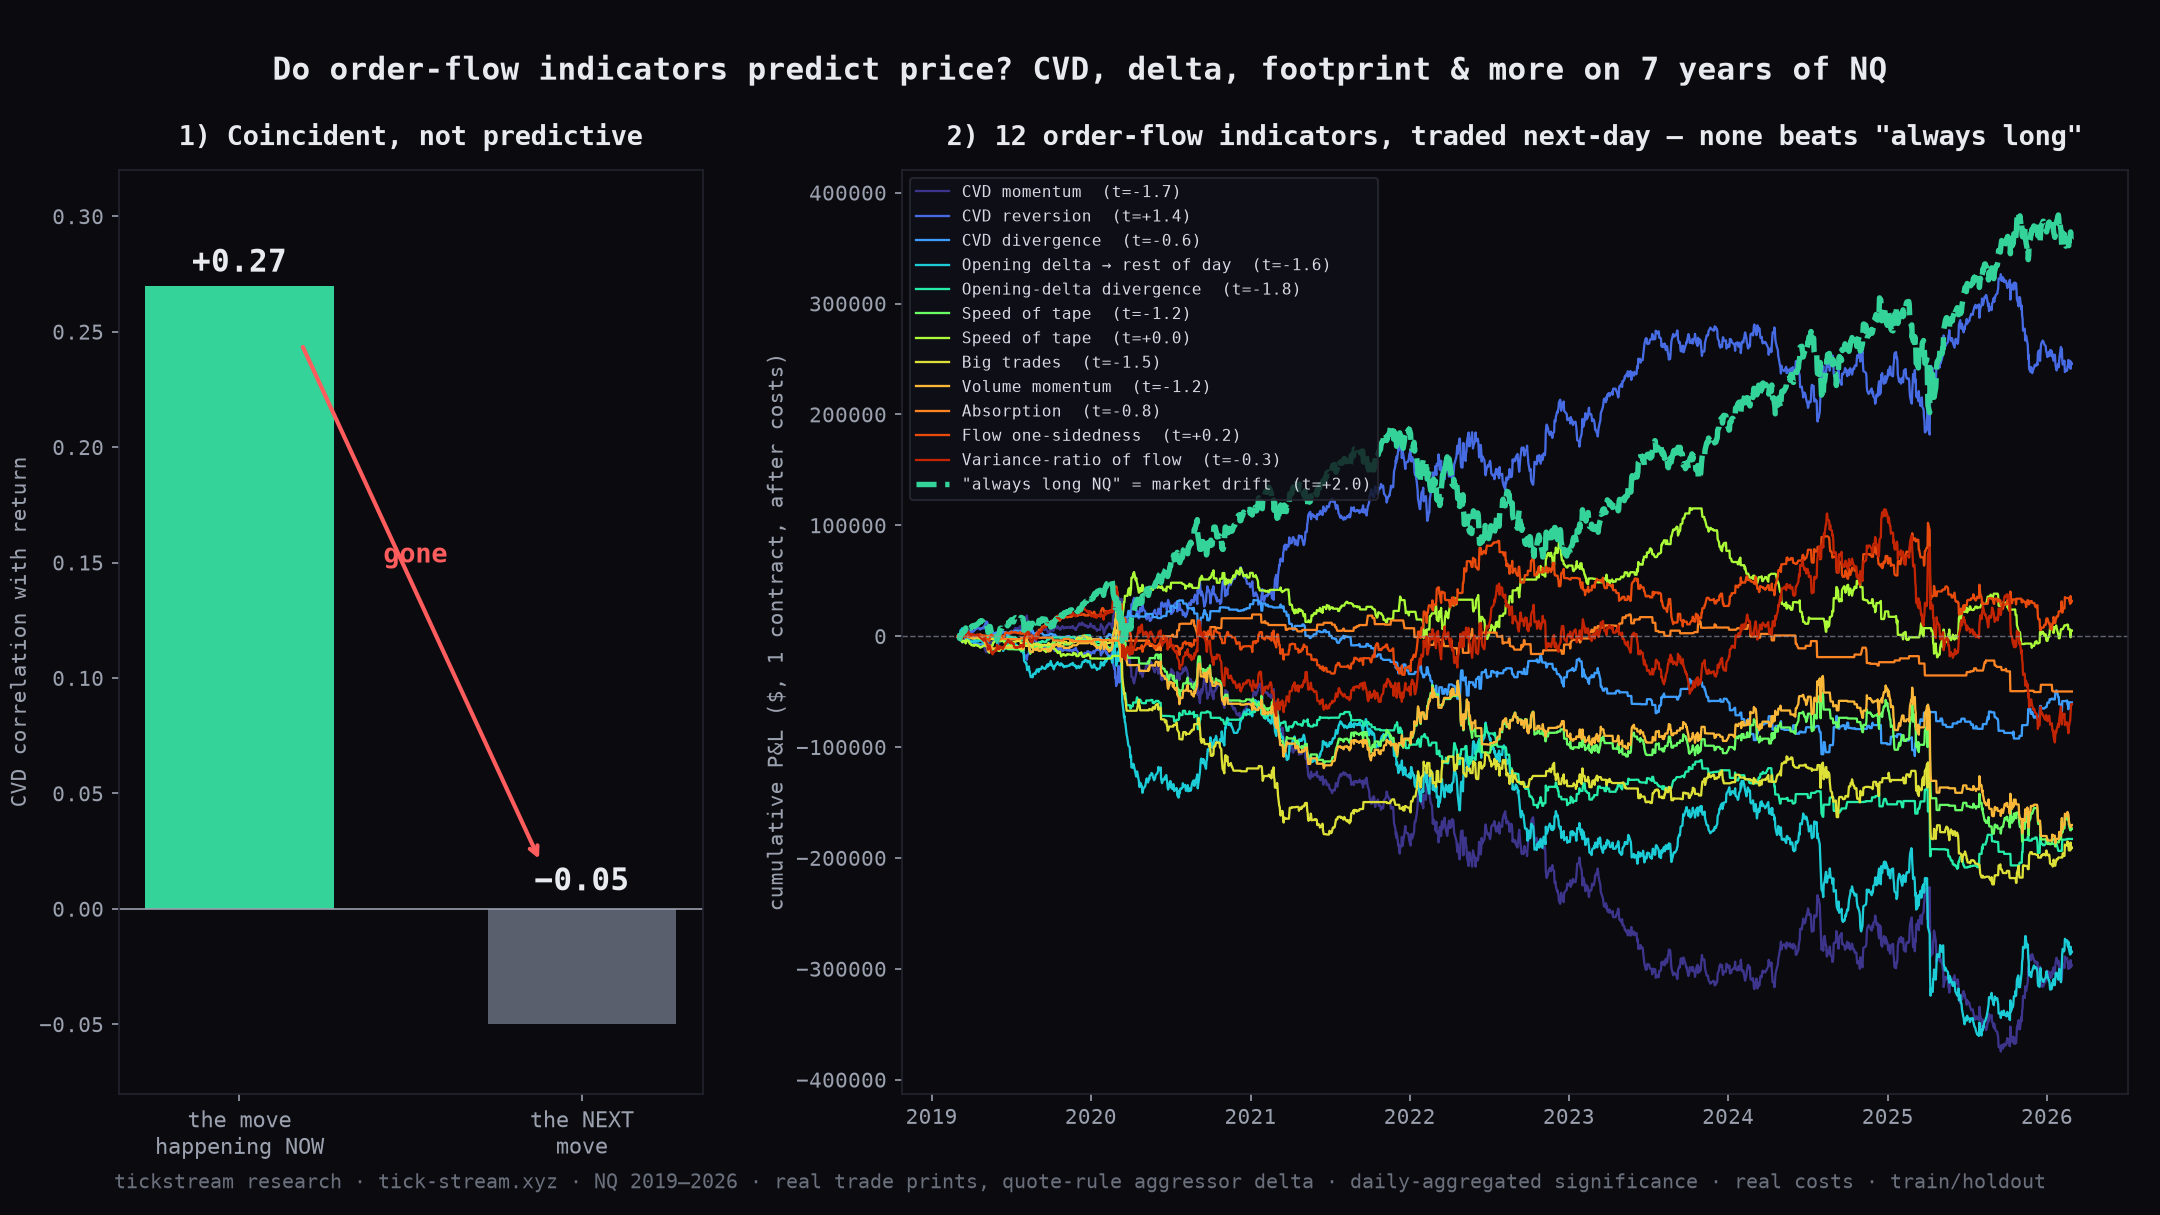
 Do Order-Flow Indicators Actually Work? We Backtested CVD, Delta & Footprint on 7 Years of NQ
Cumulative volume delta, footprint charts, order-book imbalance, 'follow the smart-money order flow' — it's the hottest thing in retail day-trading. We tested it on 7 years of real NQ trade prints (aggressor recovered tick-by-tick from the prevailing bid/ask), lookahead-free with real costs. Order flow turns out to be coincident, not predictive: it explains the move that's happening, not the next one. The data, with a control.
 Research
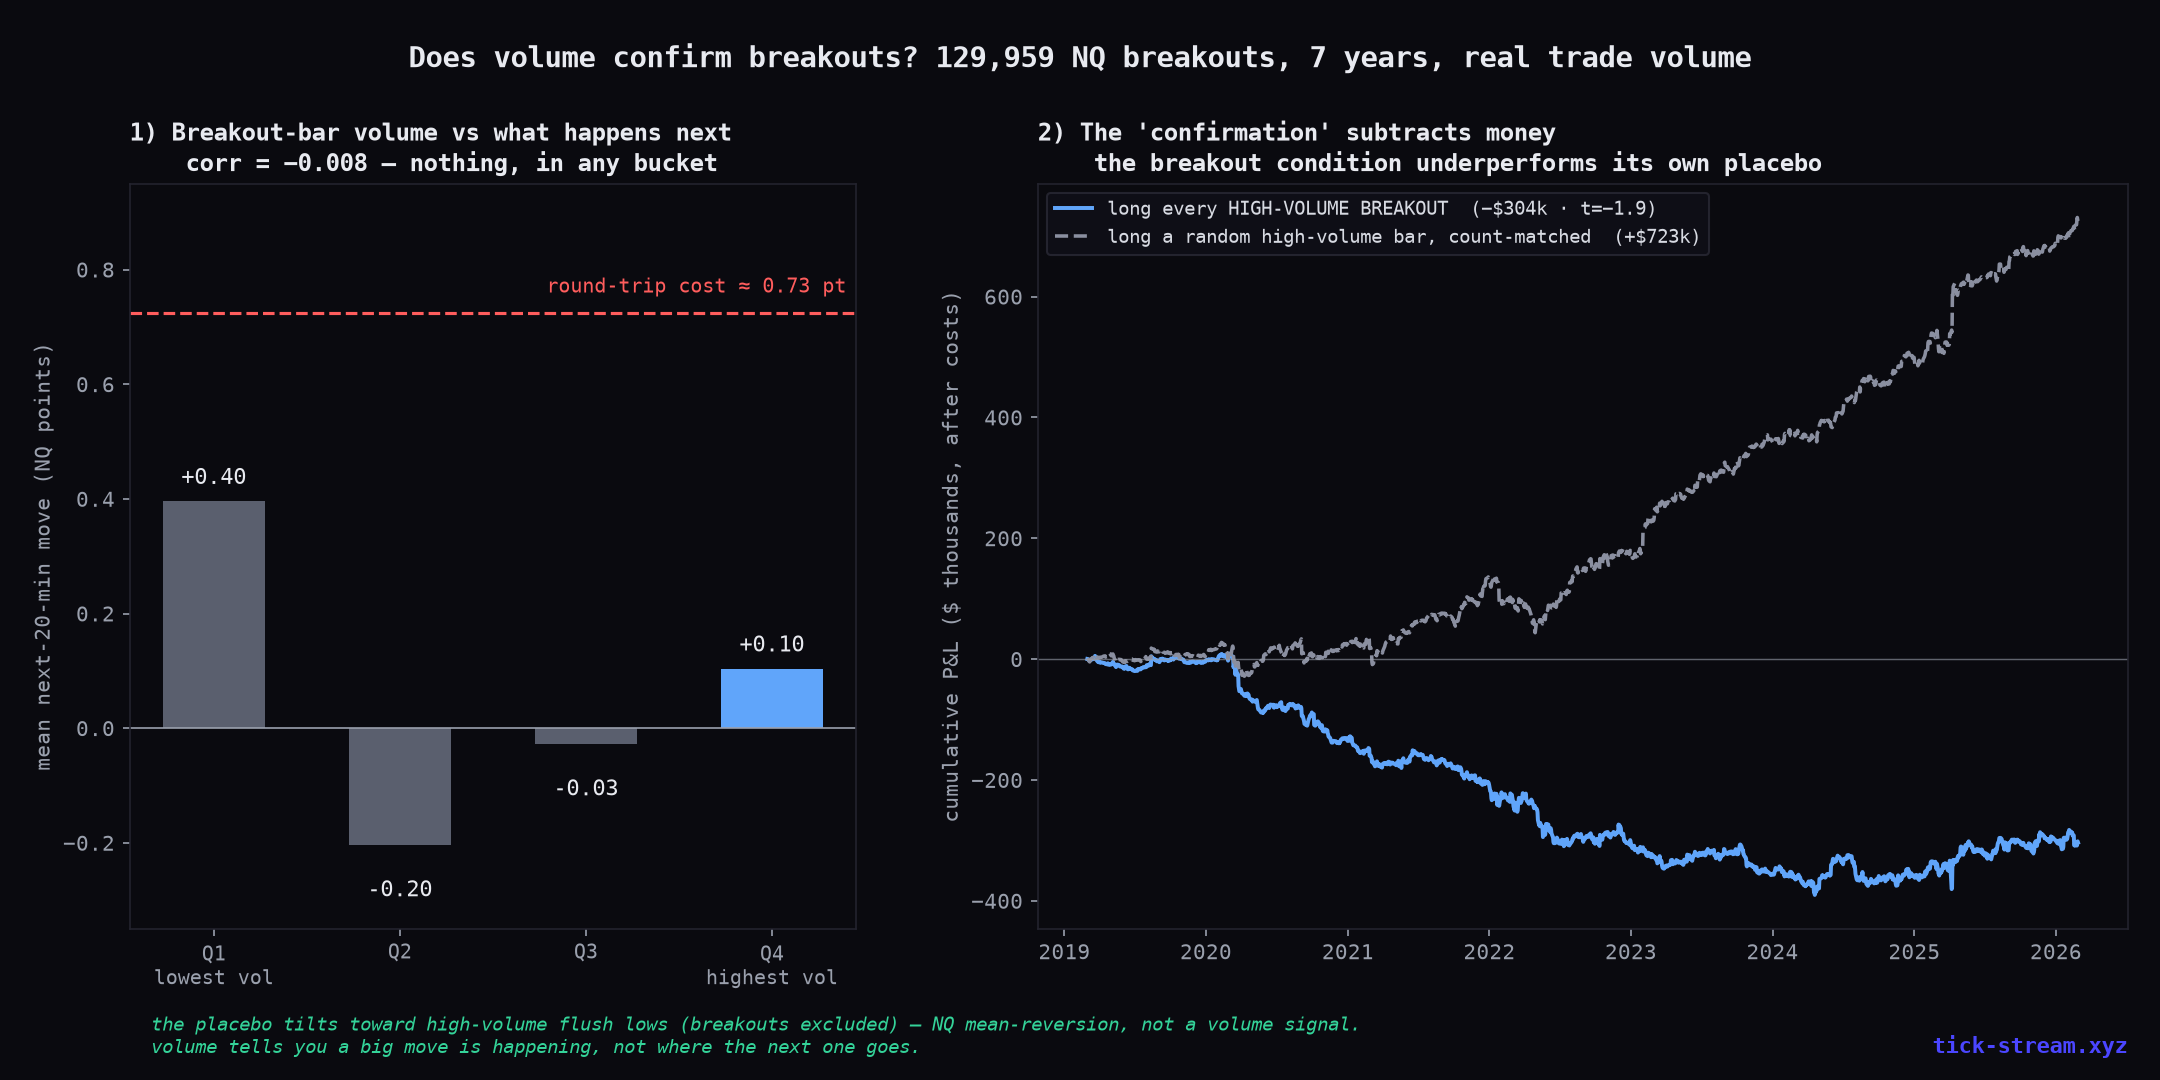
 Is Volume Really the Most Underrated Indicator? We Tested Volume Breakouts on 7 Years of NQ
‘Volume shows conviction.’ ‘A strong-volume breakout confirms the move.’ It's one of the most popular ideas in trading. We tested it properly on 7 years of NQ 1-minute data — 129,959 breakouts, placebo-controlled, on real trade volume. Volume is genuinely useful for one thing and useless for another, and most people have those two backwards.
 Research
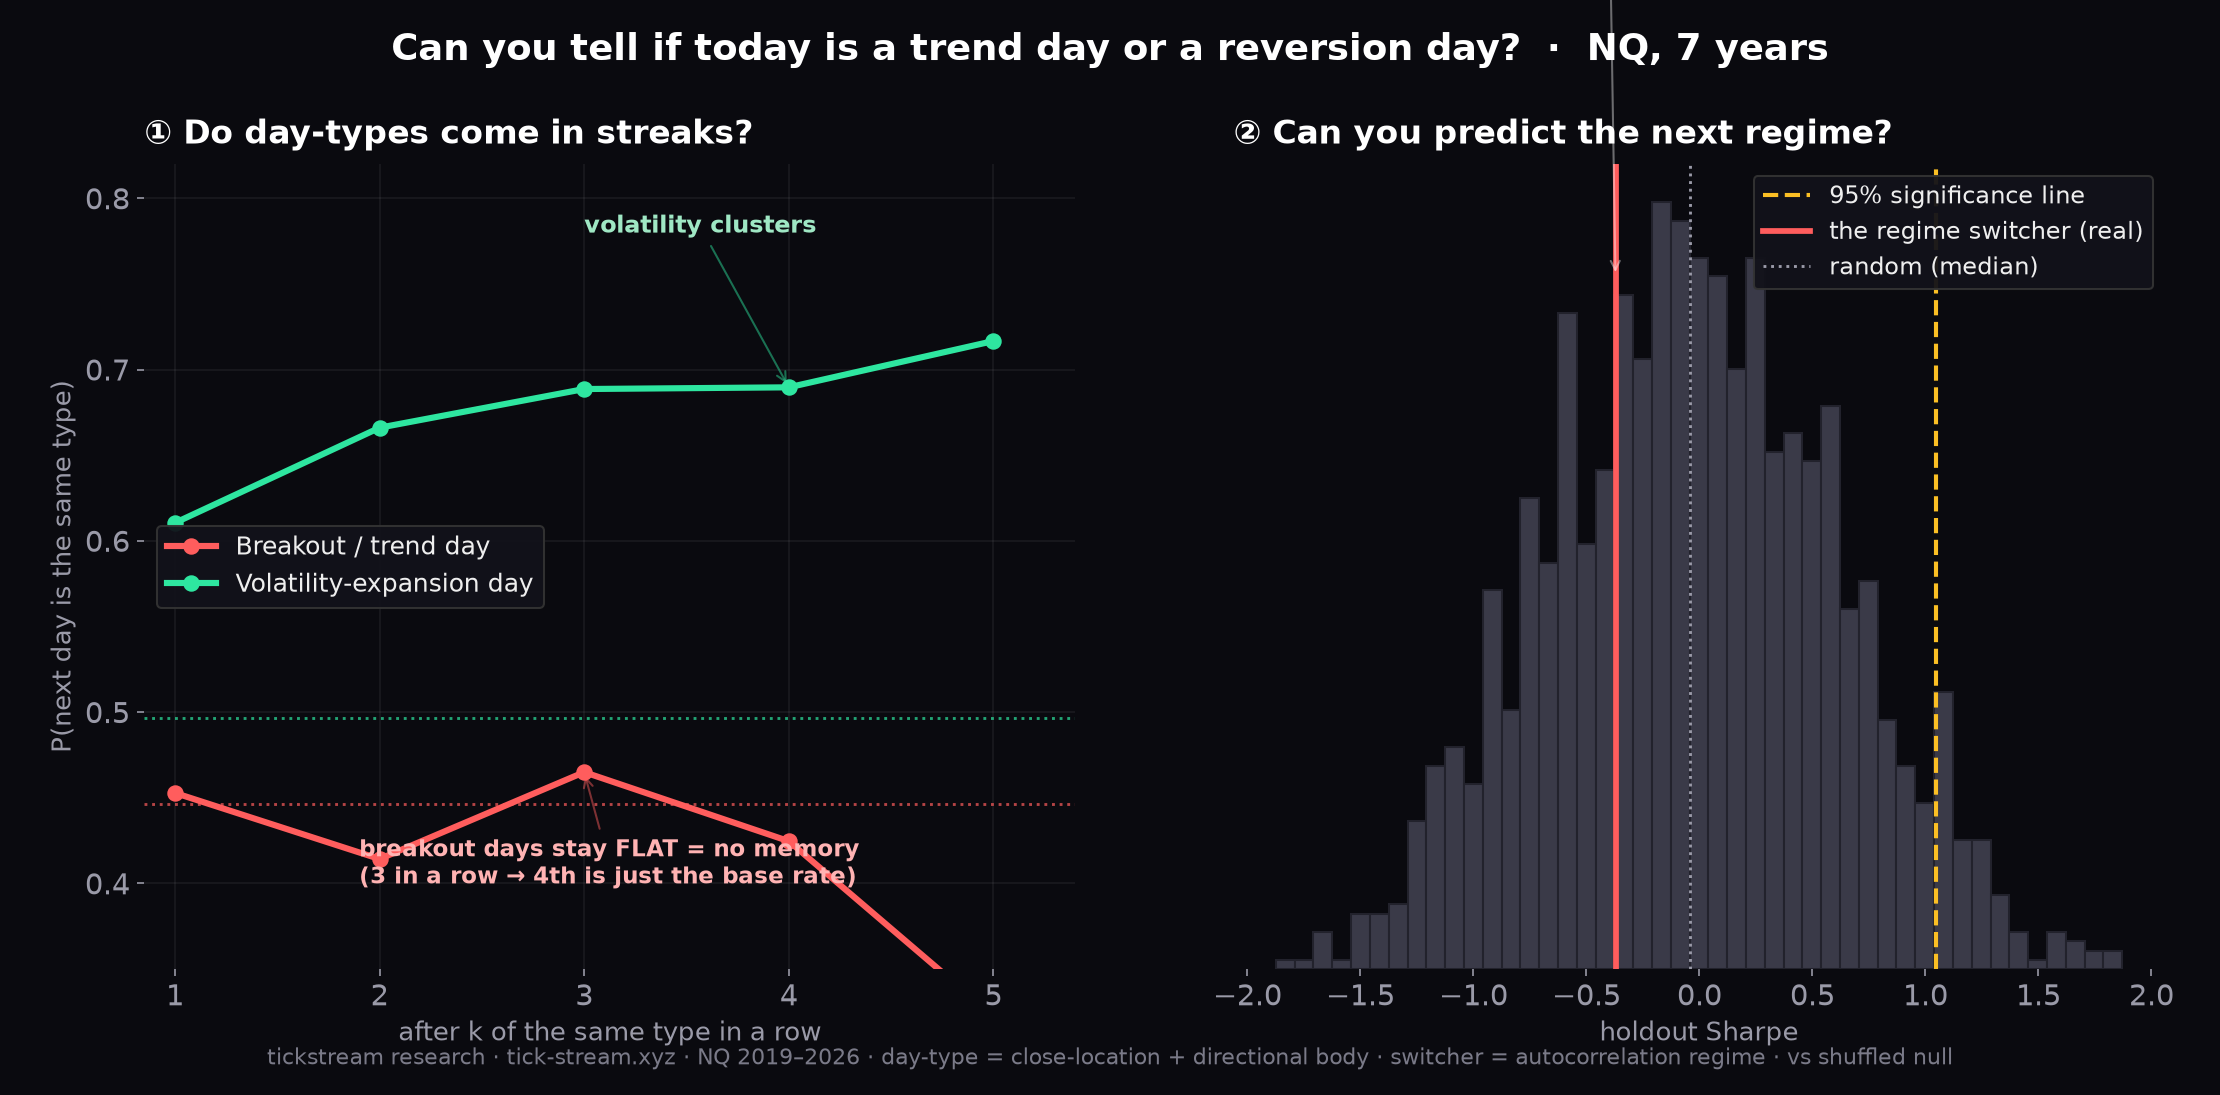
 Can You Tell If Today Is a Trend Day or a Reversion Day? We Tested It on 7 Years of NQ
Every trading course sells a 'regime filter' — know whether the market is trending or ranging, then trade breakout or mean-reversion accordingly. We tested it properly on 7 years of NQ futures: do breakout days come in streaks, and can any indicator tell you which style pays next? The regime is real but it's not forecastable. The data, with a placebo test.
 Research
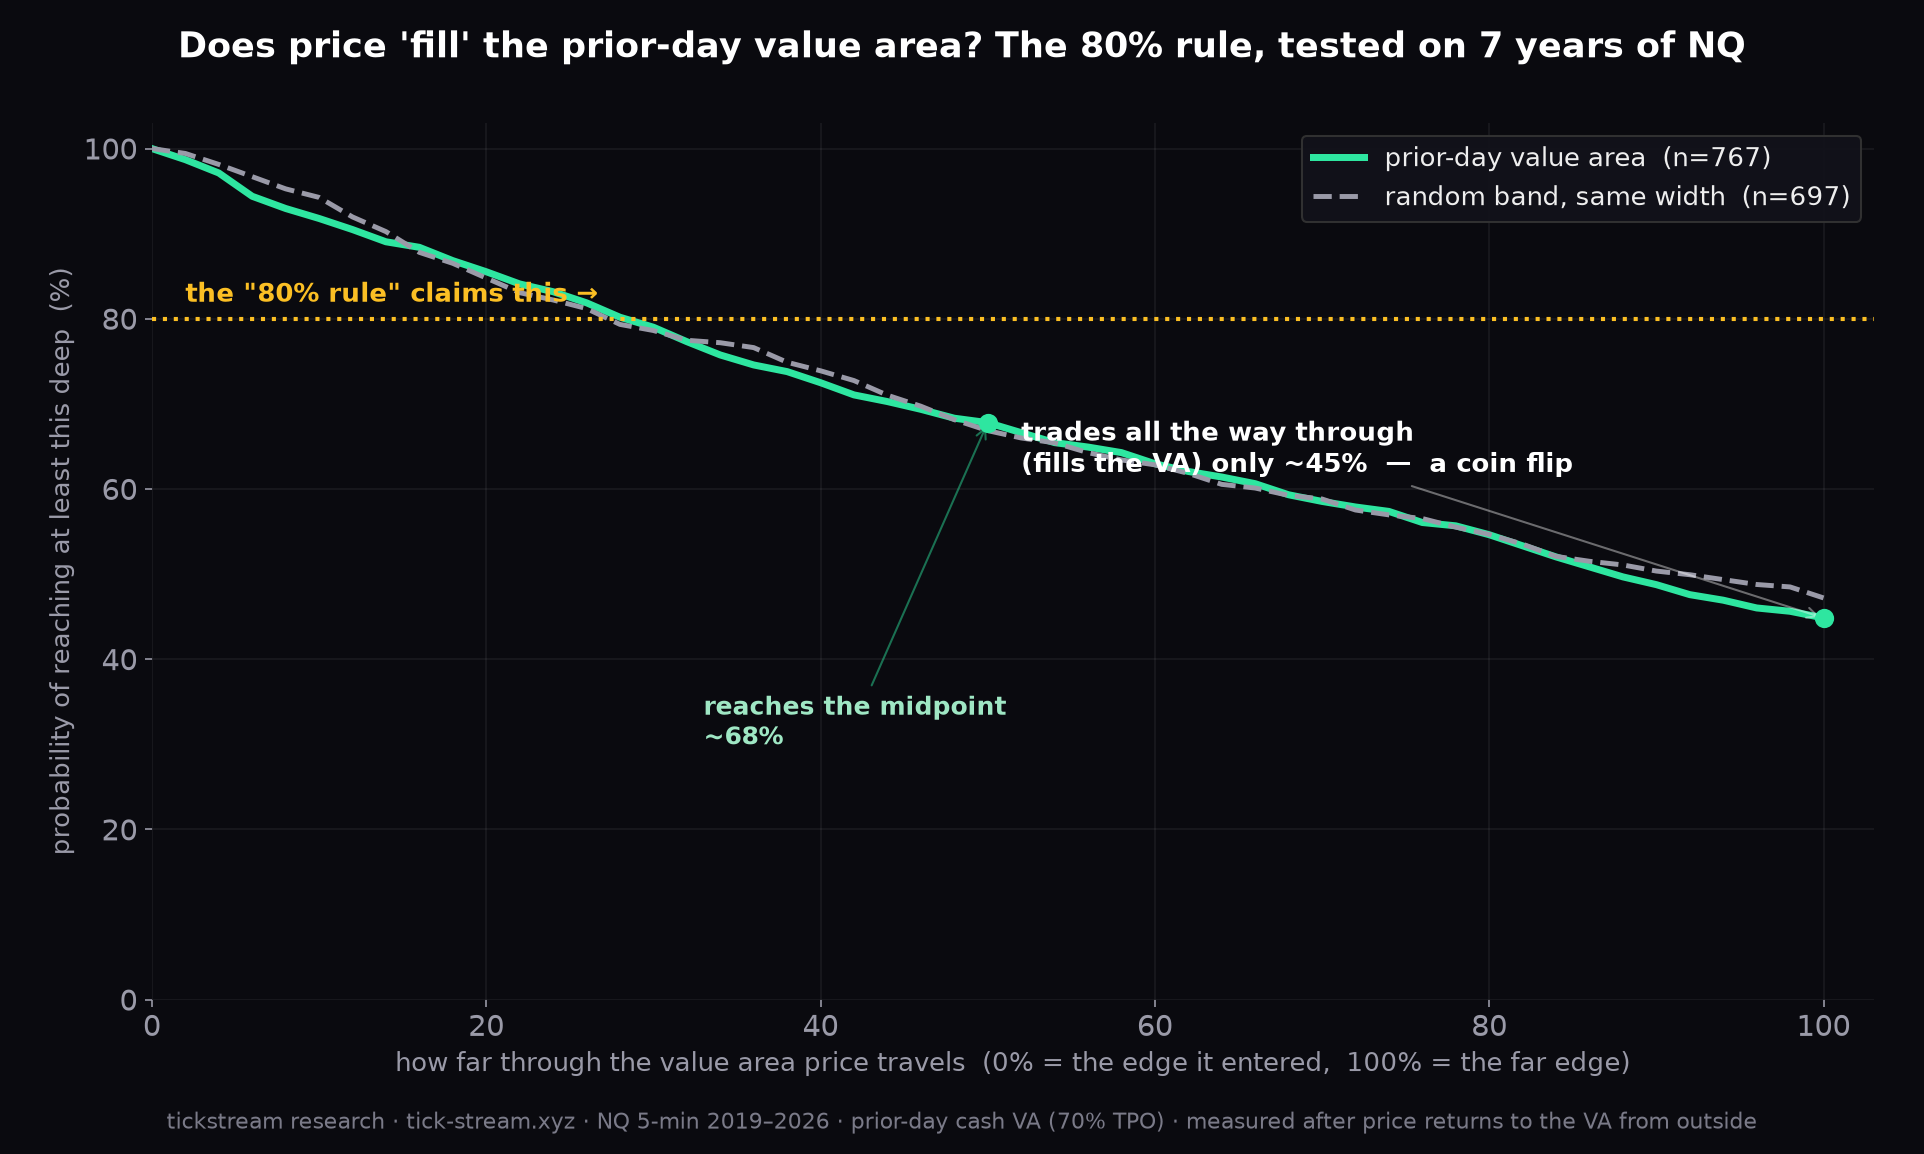
 Does Price 'Fill' the Prior-Day Value Area? We Tested the 80% Rule on 7 Years of NQ
Market Profile's famous '80% rule' says that when price returns to the prior day's value area, it trades all the way through it ~80% of the time. We measured it on 7 years of NQ futures: the real number is about 45–50% — a coin flip — and a random band of the same width fills just as often. The value area isn't special. The data, with a control.
 Research
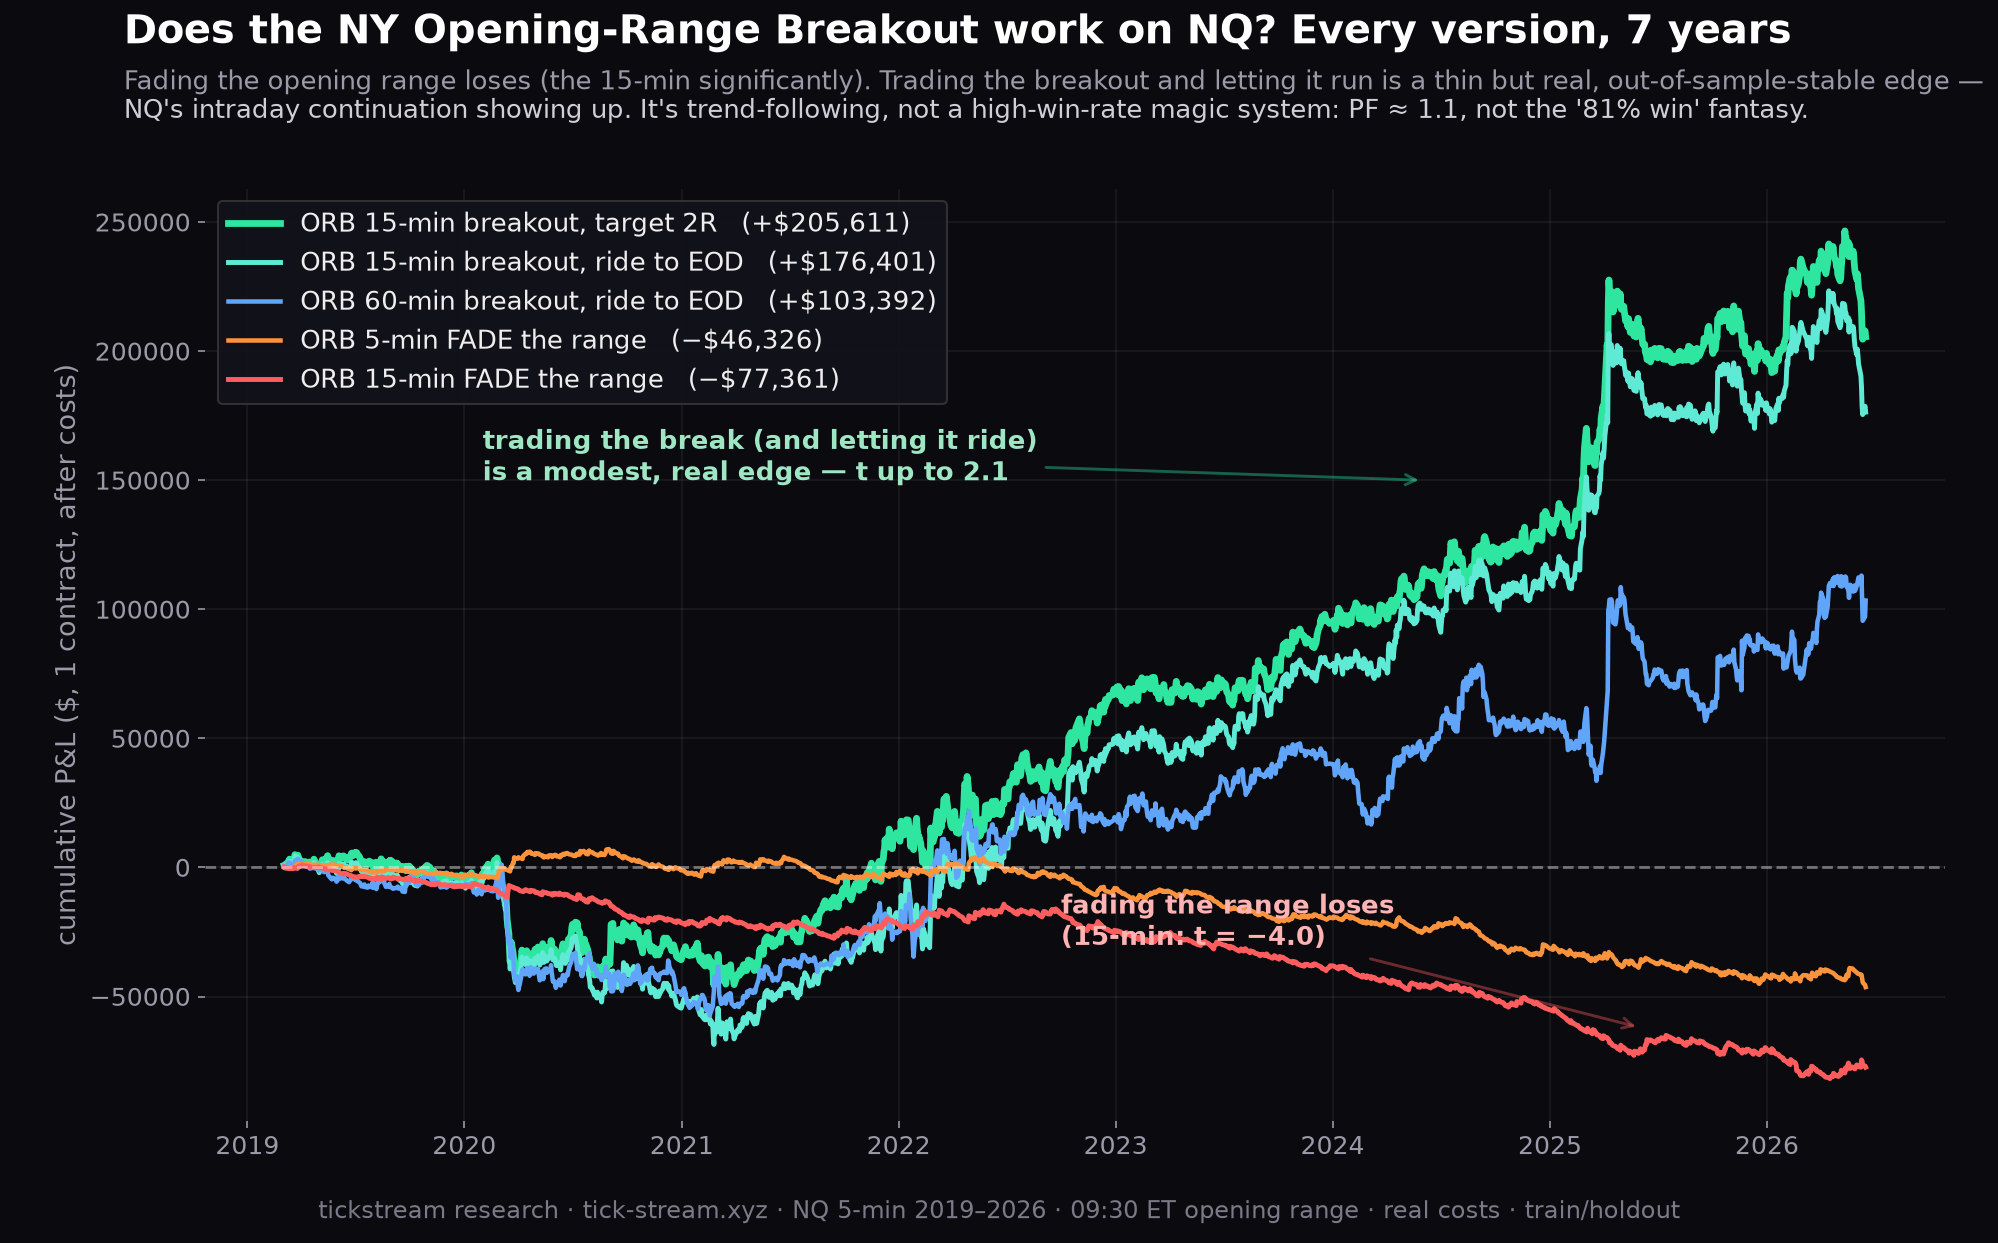
 Does the NY Opening-Range Breakout Actually Work? We Tested Every Version on 7 Years of NQ
Fade the opening range for an 81% win rate, or trade the breakout for easy money — the NY ORB is one of the most-sold day-trading strategies online. We tested every version on 7 years of NQ futures, lookahead-free with real costs and a train/holdout split. The result isn't a clean debunk: the popular versions are invalidated, but one version holds up as a thin, real edge. Here's the full data.
 Research
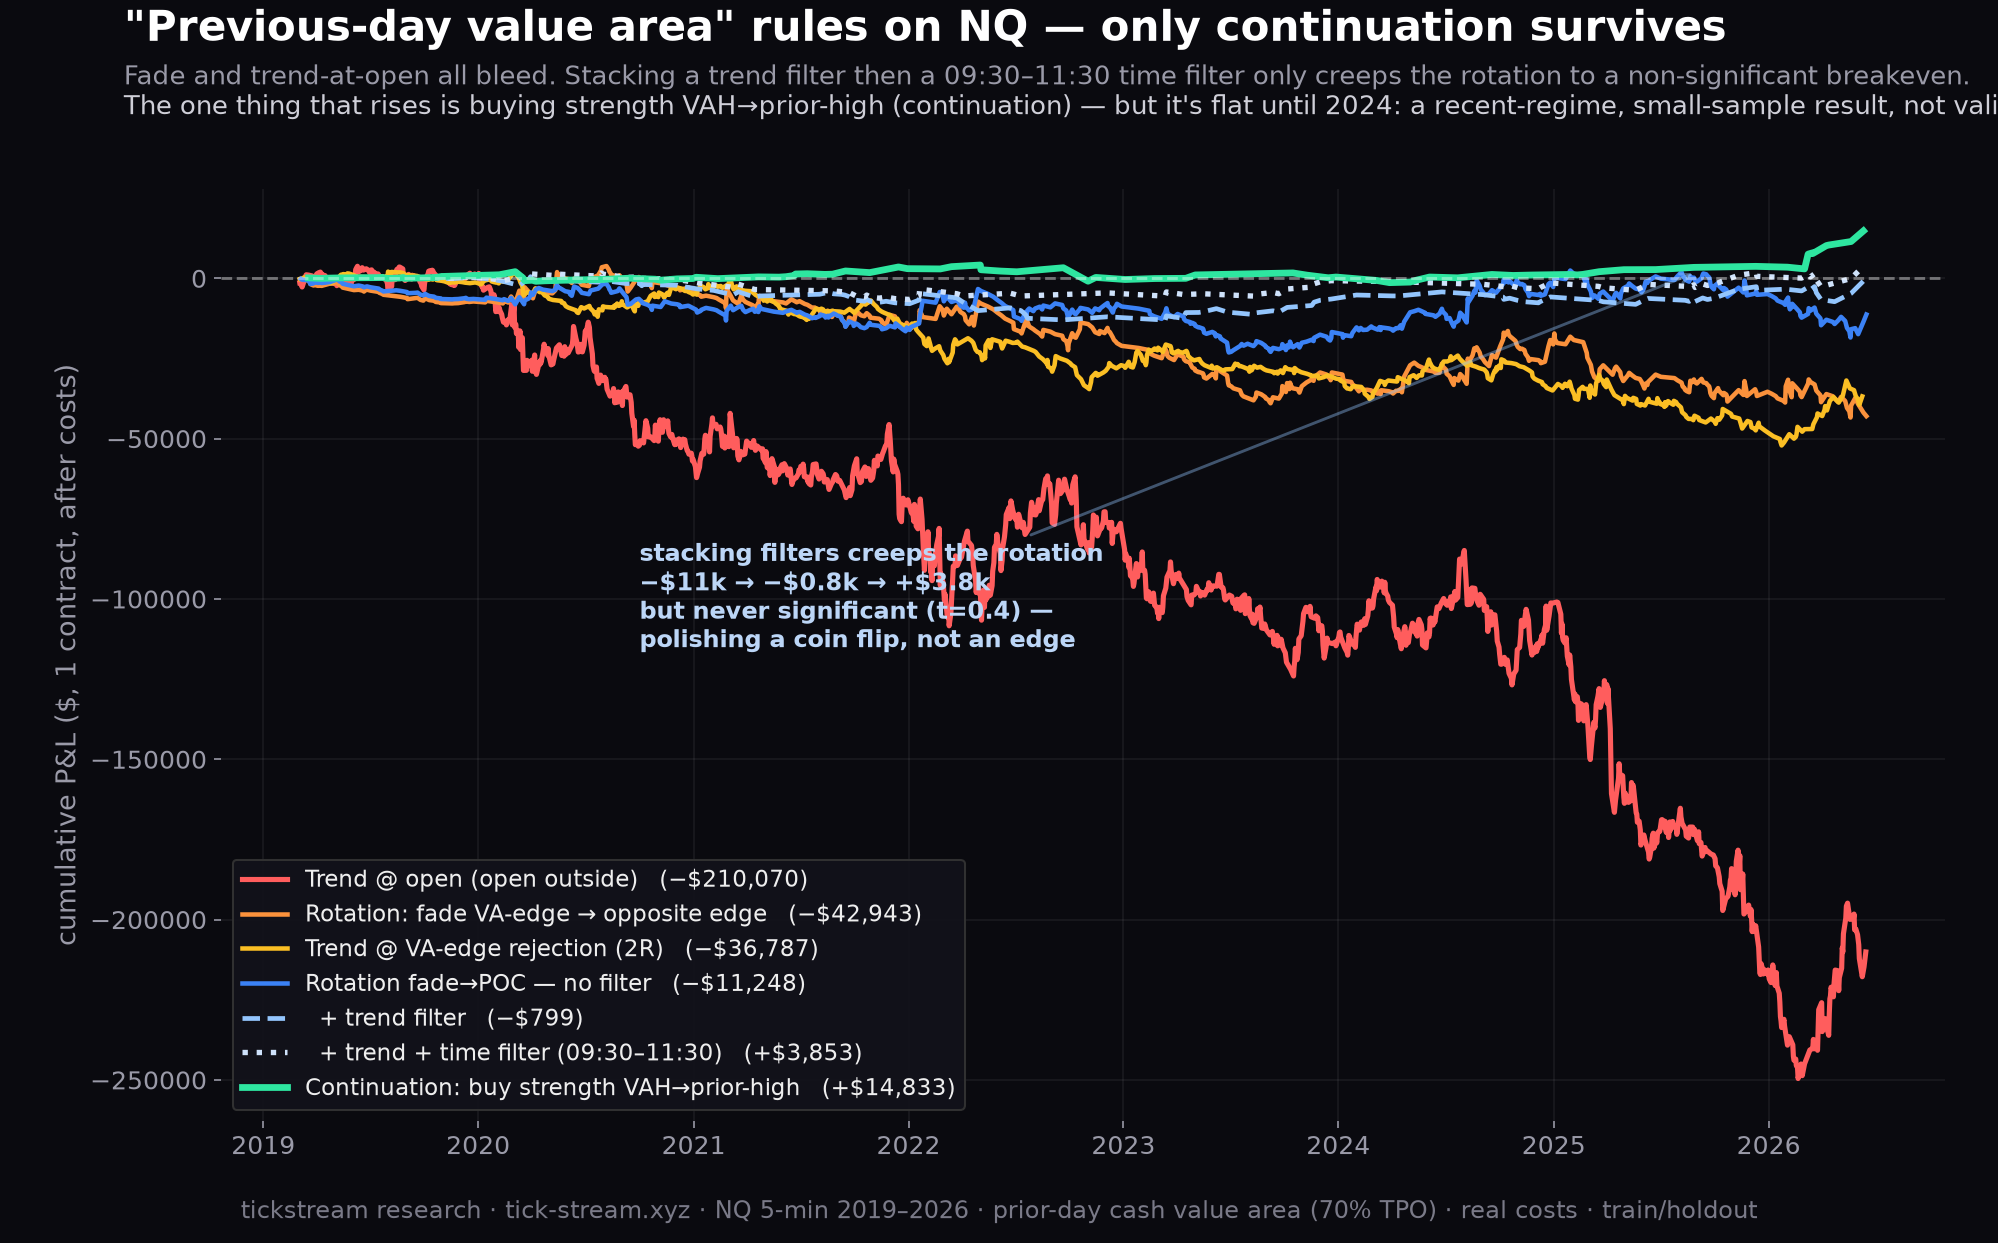
 Does the 'Previous-Day Value Area' Strategy Work? We Tested Every Version on 7 Years of NQ
Open inside the prior day's value area → fade back to value; open outside → trade the trend. It's one of the most popular Market Profile day-trading frameworks. We tested every version mechanically on 7 years of NQ futures — lookahead-free, real costs, train/holdout. The premise is a coin flip and every rule loses. Here's the data, and why 'it's just my psychology' is the wrong diagnosis.
 Research
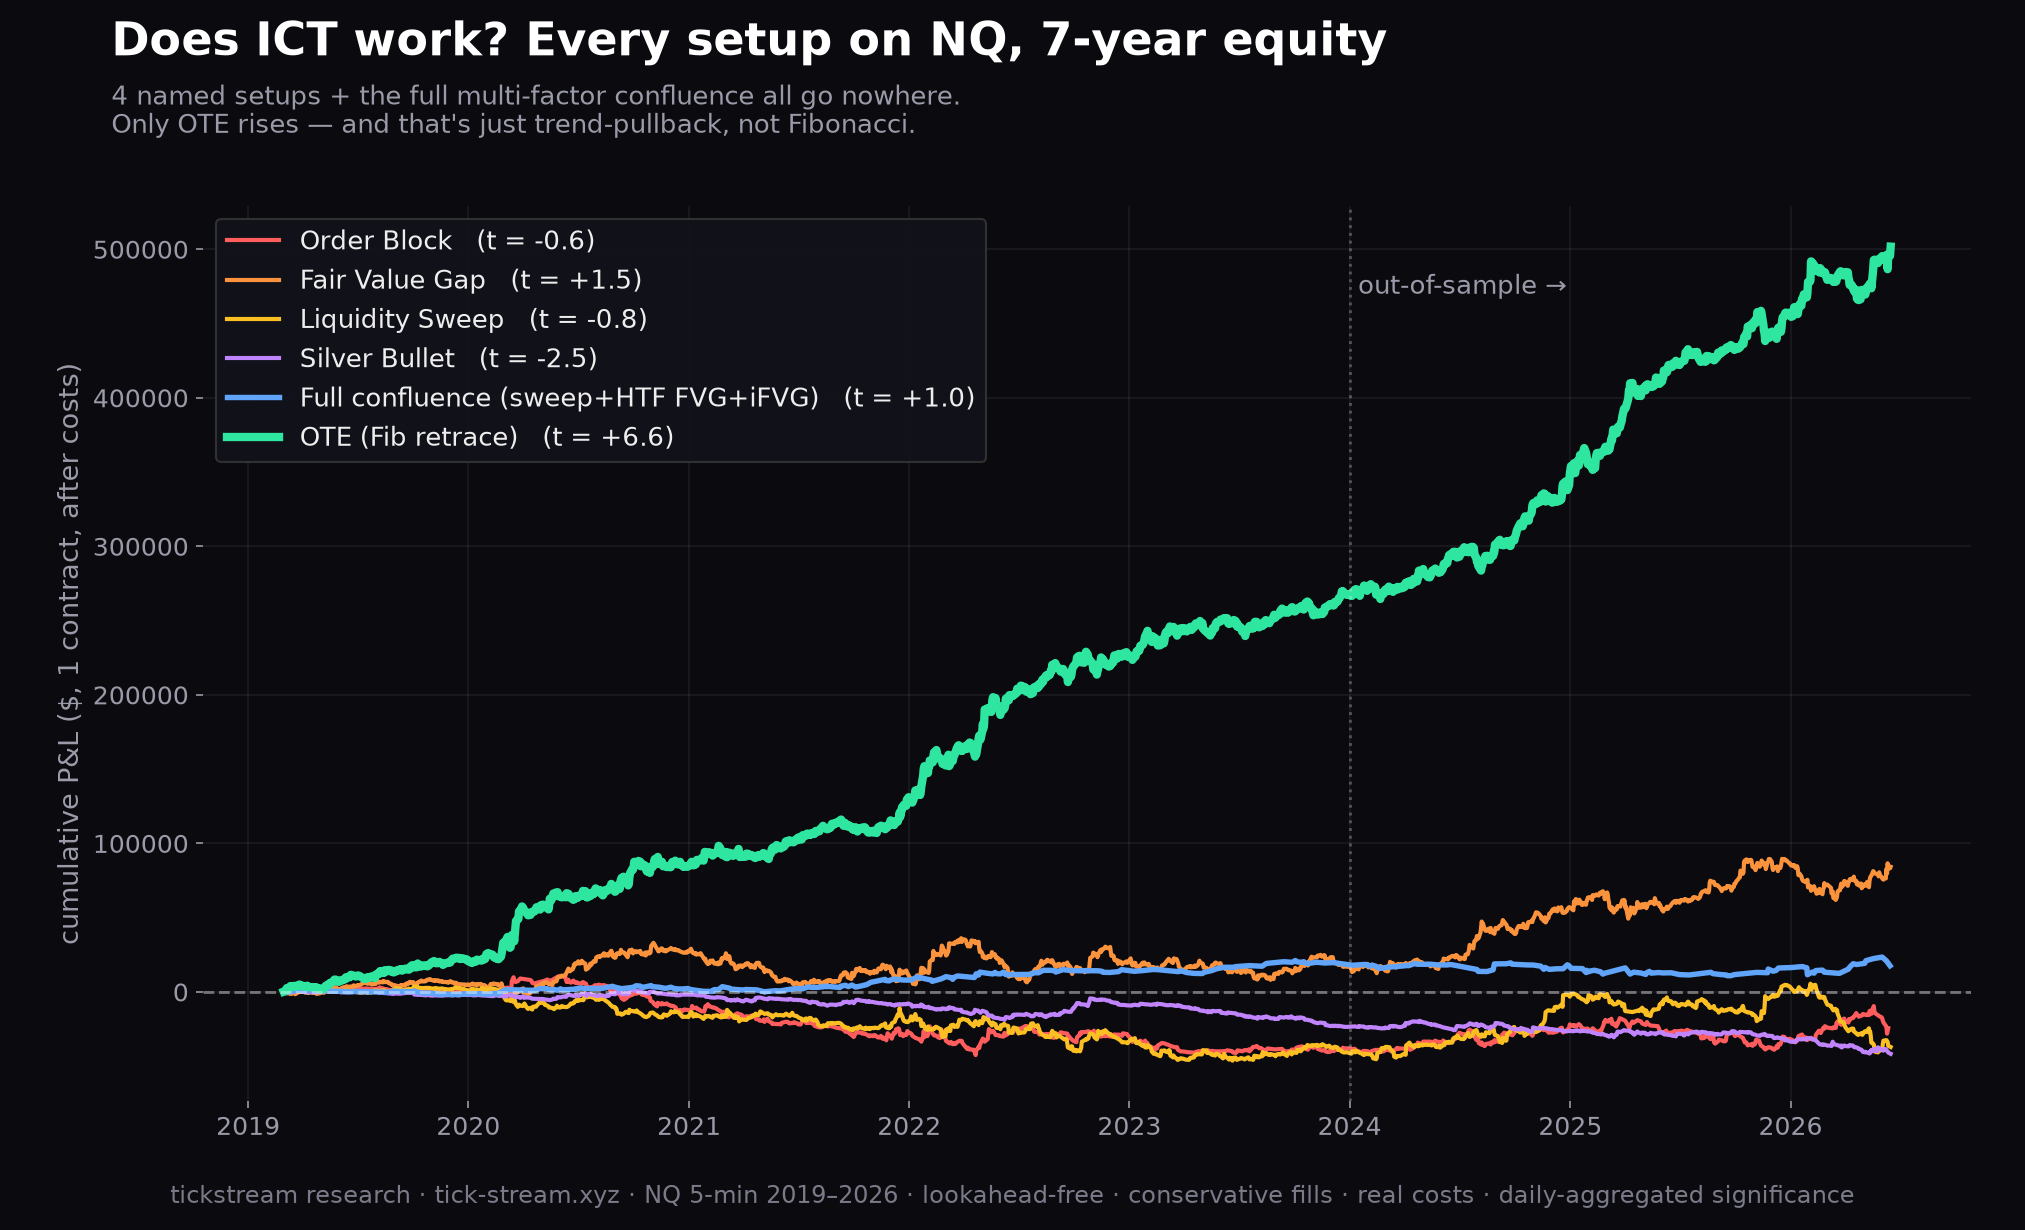
 Does ICT Actually Work? We Backtested the 5 Core Setups on 7 Years of NQ
Order Blocks, Fair Value Gaps, Liquidity Sweeps, the Silver Bullet and OTE — we backtested the core ICT (Inner Circle Trader) concepts lookahead-free on 7 years of NQ futures, with real costs and daily-aggregated significance. Four of five fail outright, and the one that 'works' has nothing to do with Fibonacci. The data, in full.
 Research
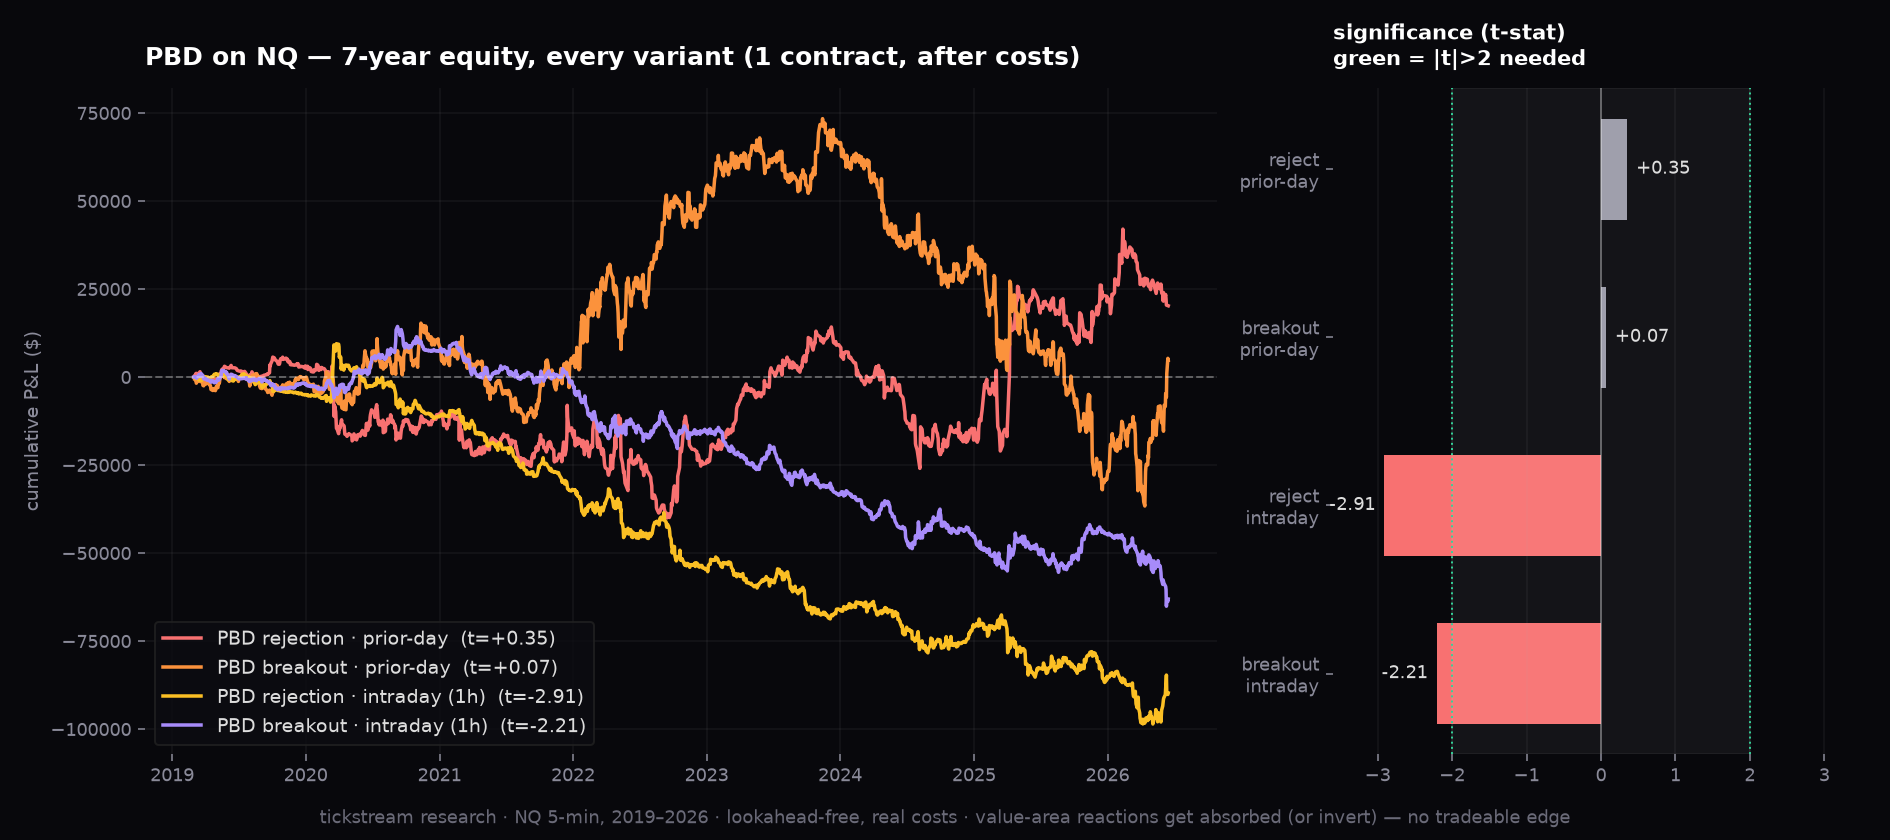
 Why PBD Is Failing: We Backtested the Market-Profile Model on 7 Years of NQ
The viral PBD (P / b / D) market-profile model promises a daily edge from value-area rejections and acceptance breakouts. We backtested it lookahead-free on 7 years of NQ futures — every variant and timeframe failed, and the intraday version loses with significance. Here's the data.
Market DataCME Market Data Pricing 2026: The Real Price List, From Exchange Fees to $19/mo APIs
What CME market data actually costs in 2026, with numbers: non-professional vs professional exchange fees, Level 2 depth surcharges, what CME Direct, terminals, legacy vendors and developer APIs really charge — and how to get a real-time CME futures feed from $19/month flat.
AI & AgentsConnecting AI Agents to Live Market Data with MCP (Claude, Cursor)
How to give Claude, Cursor and other AI agents real-time market data using the Model Context Protocol (MCP) — what MCP is, why it fits market data, and how to wire it up.
OptionsFutures Options Data via API: Greeks, Implied Volatility and Gamma Exposure
How to access futures and index options data over an API — option chains, the Greeks, implied volatility and gamma exposure (GEX) — and what each one is actually good for.
BacktestingHistorical Tick Data for Backtesting: The Complete Guide
How to source, clean and use historical tick data for backtesting futures strategies — resolution, survivorship, weekend gaps and the mistakes that make backtests lie.
Market DataLevel 2 Market Data Explained: Reading Order Book Depth in Futures
What Level 2 market data really shows, how to read order book depth and imbalance, and where the edge is — and isn't — for futures traders and quants.
Market DataReal-Time Futures Market Data API: How to Stream CME Ticks in 2026
A developer's guide to streaming real-time CME futures market data over a WebSocket API — latency, normalization, symbol rolls and the gotchas nobody warns you about.
Nothing under this topic yet.