

Order flow, option flow, execution, AI, indicators and automated strategies. Data included.
Footprint and depth from CME futures, the OPRA option tape and dealer gamma, orders on your own Rithmic account, an AI assistant that reads the session, and your own scripts that draw or trade. The live market data is part of the plan, with no separate feed to pay for.
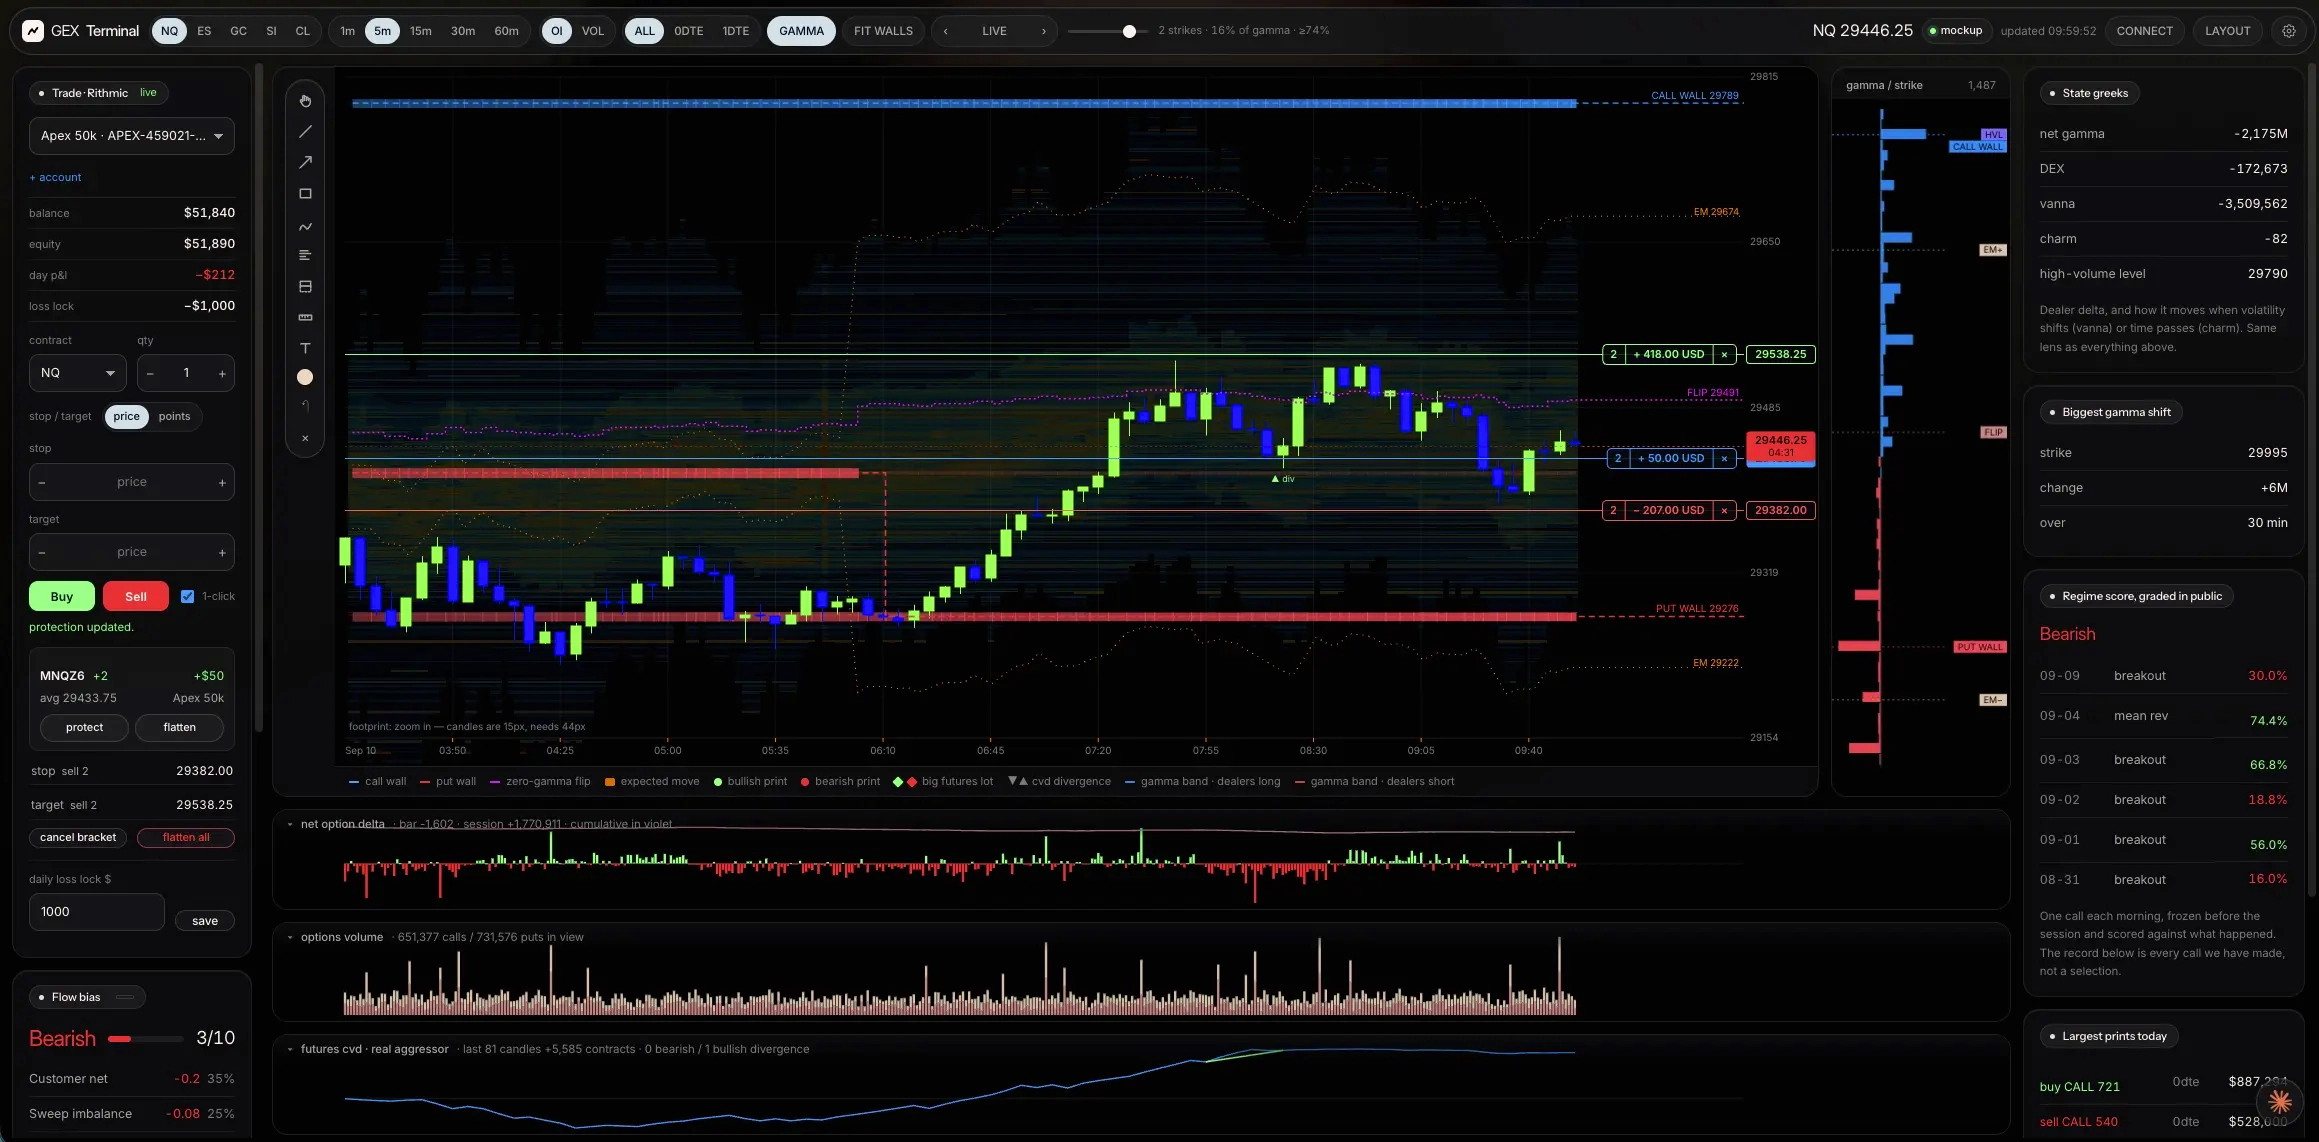

tickstream is a trading platform built on our own recording: CME futures ticks with the exchange's aggressor flag on every print, the order book, and the OPRA option tape. That data comes with the plan, so there is no separate market-data feed to buy before the screen means anything.
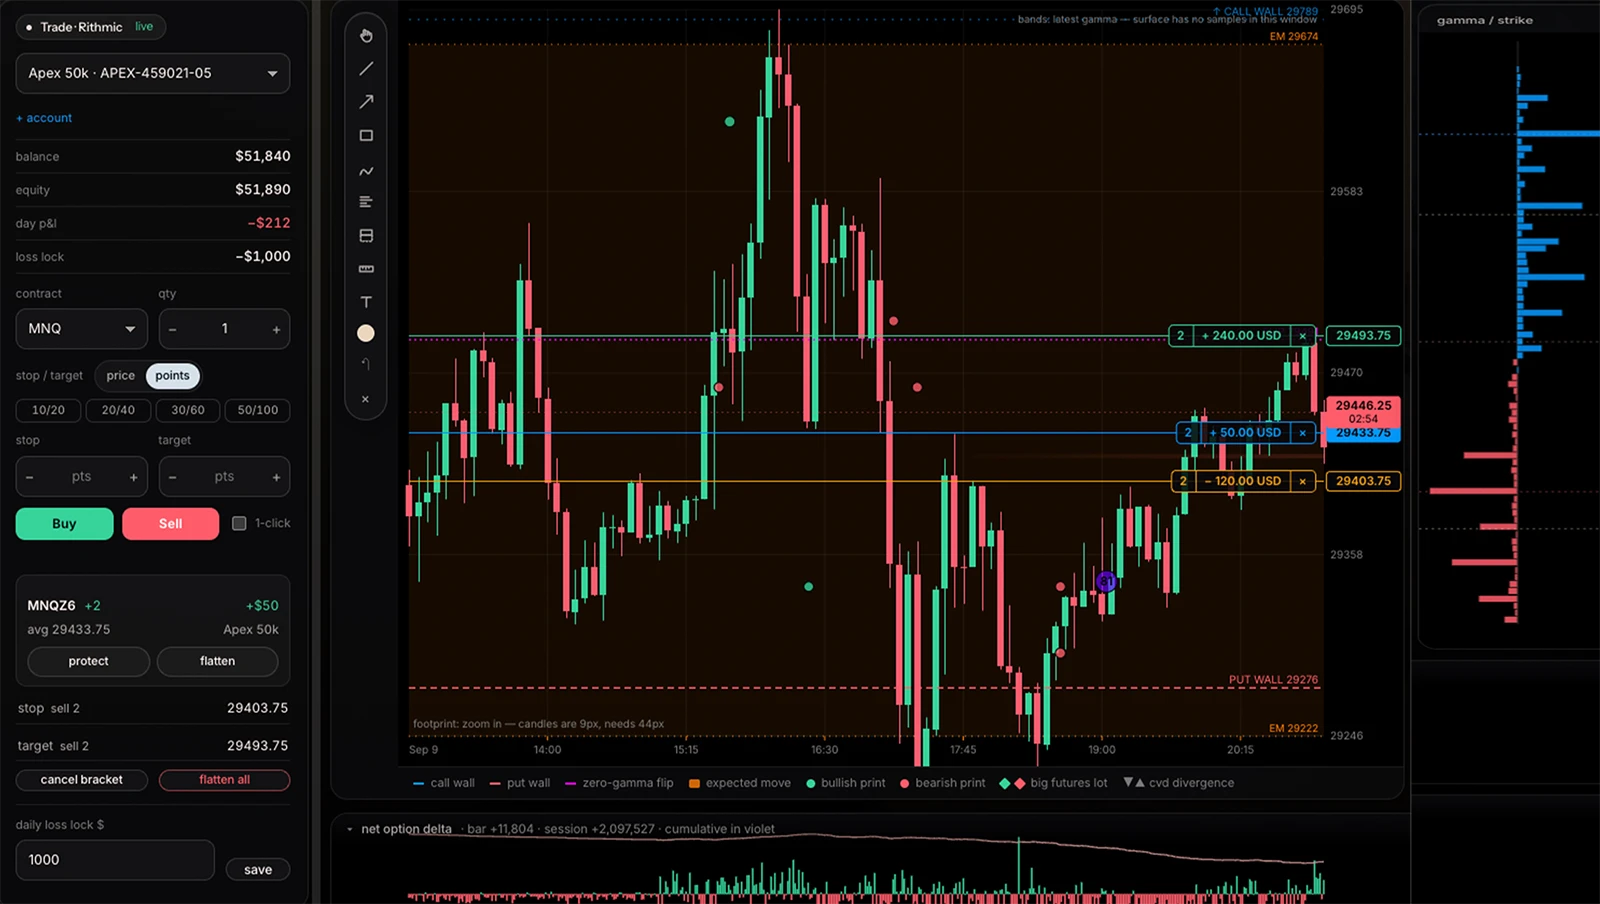
Order flow and option flow share one price axis with the candles. Footprint, resting liquidity, dealer gamma and the day's largest option prints are drawn on the same scale, so what lines up on screen lines up in the market.
Reading and acting happen in the same window: orders go to your own Rithmic account with the bracket resting at the broker, an AI assistant answers from the session's own numbers, and indicators and automated strategies are a few lines of JavaScript you write yourself.
Order flow, option flow, execution. One screen.
Order flow on the chart, option flow in the gamma profile and the tape, execution in the ticket: the same screen with a different panel in front, on market data that comes with the plan. Nothing is redrawn on a second axis, so what lines up here lines up in the market.
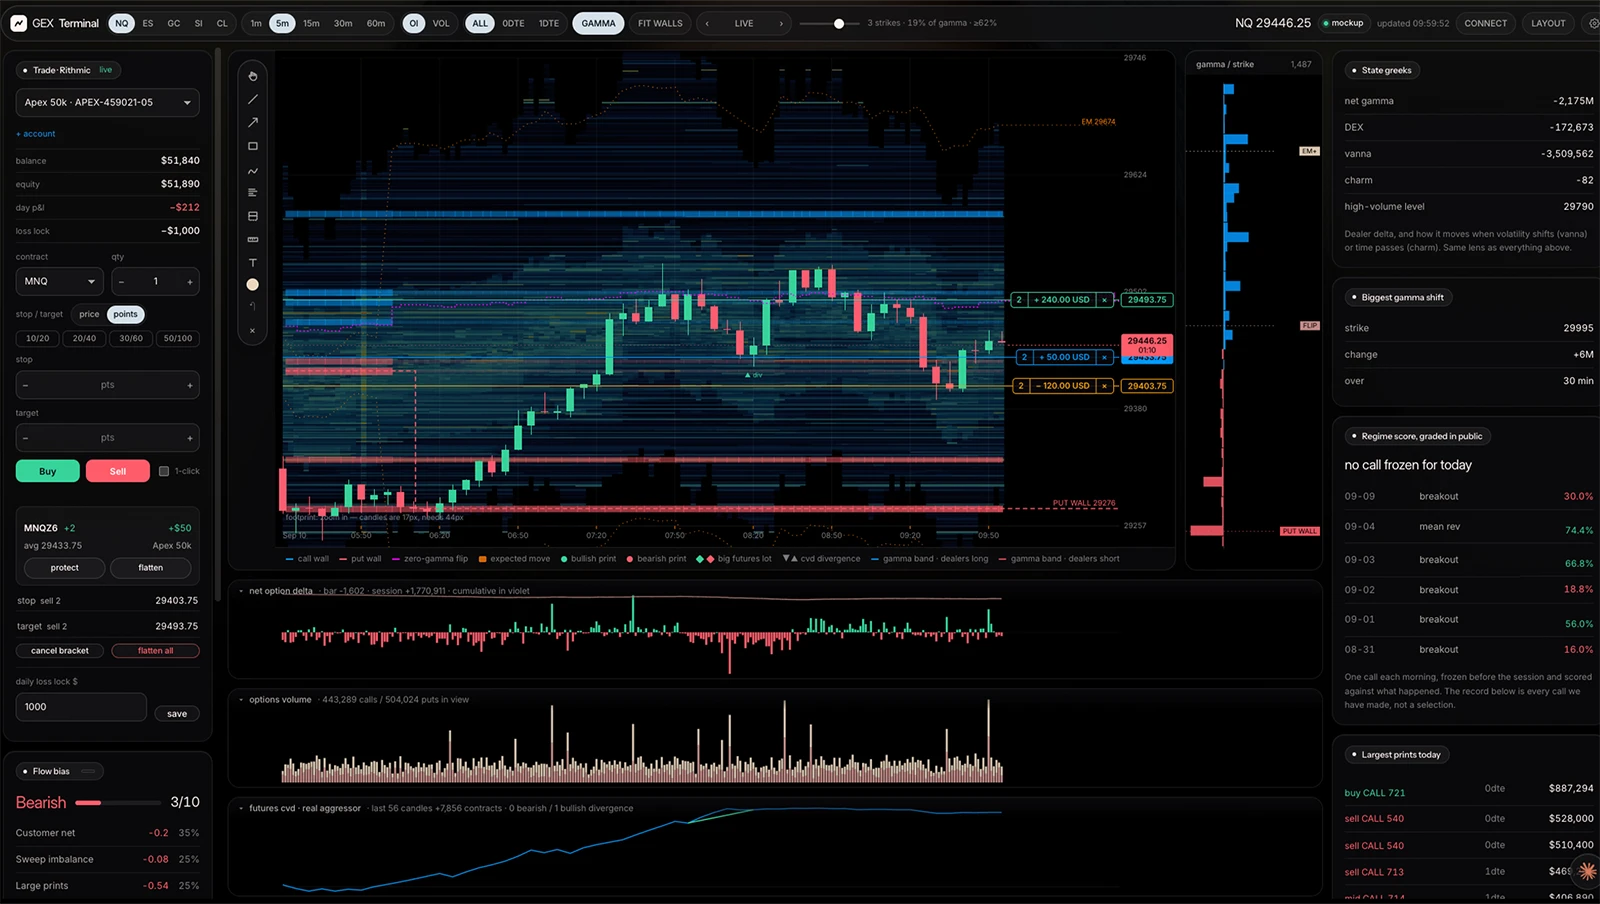
Nineteen panels,
one price axis.
Order flow, option flow and your orders are drawn on the same price scale, so what lines up on screen lines up in the market. Every number below is computed from market data that comes with the plan (the OPRA tape for the chain, our own Level 2 for the book), and where the data cannot answer a question, the panel says so instead of guessing.
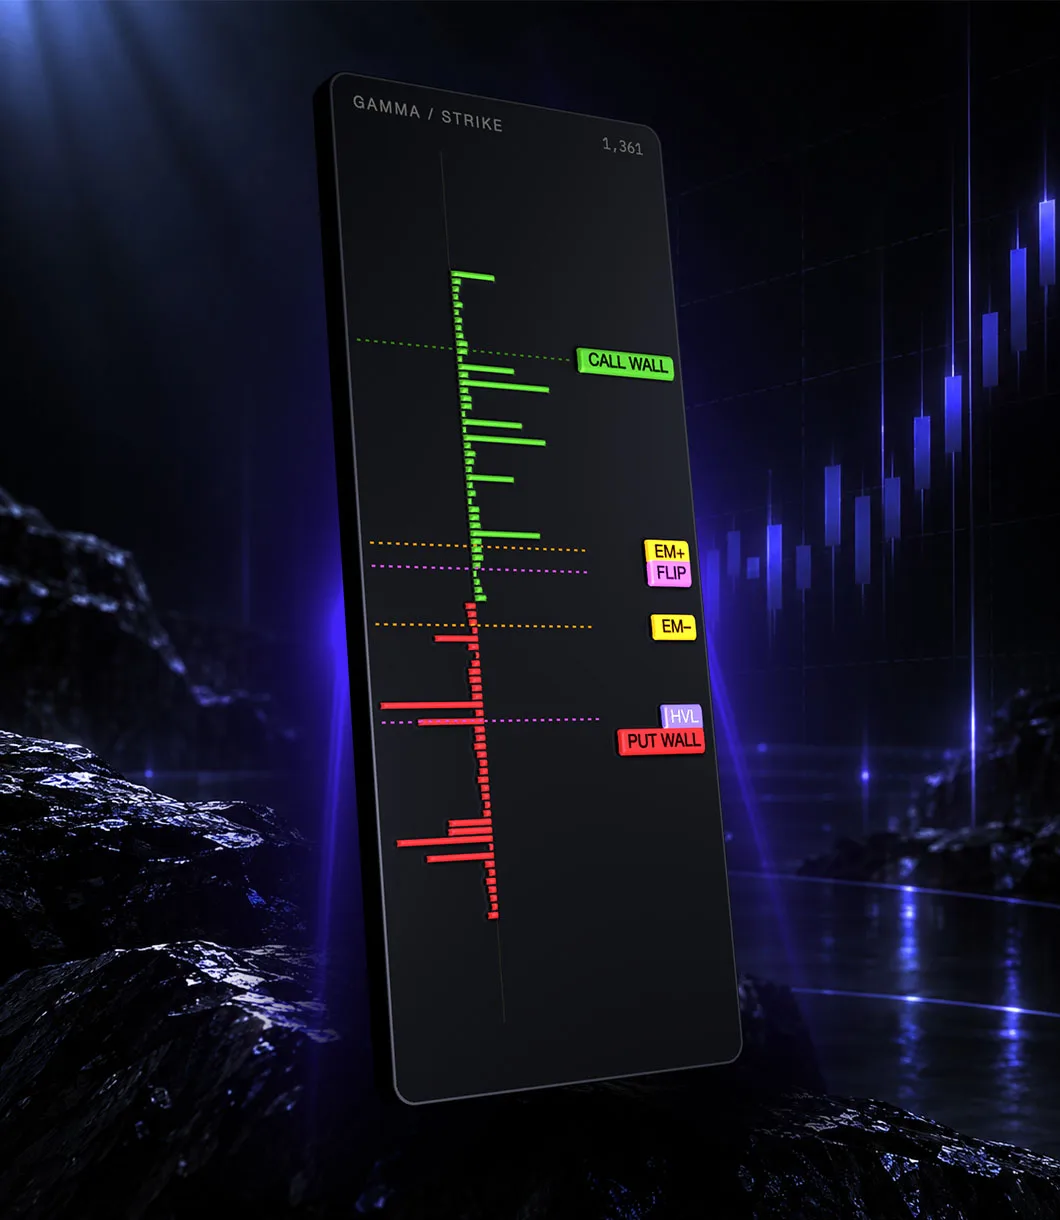
The ladder, not a heatmap.
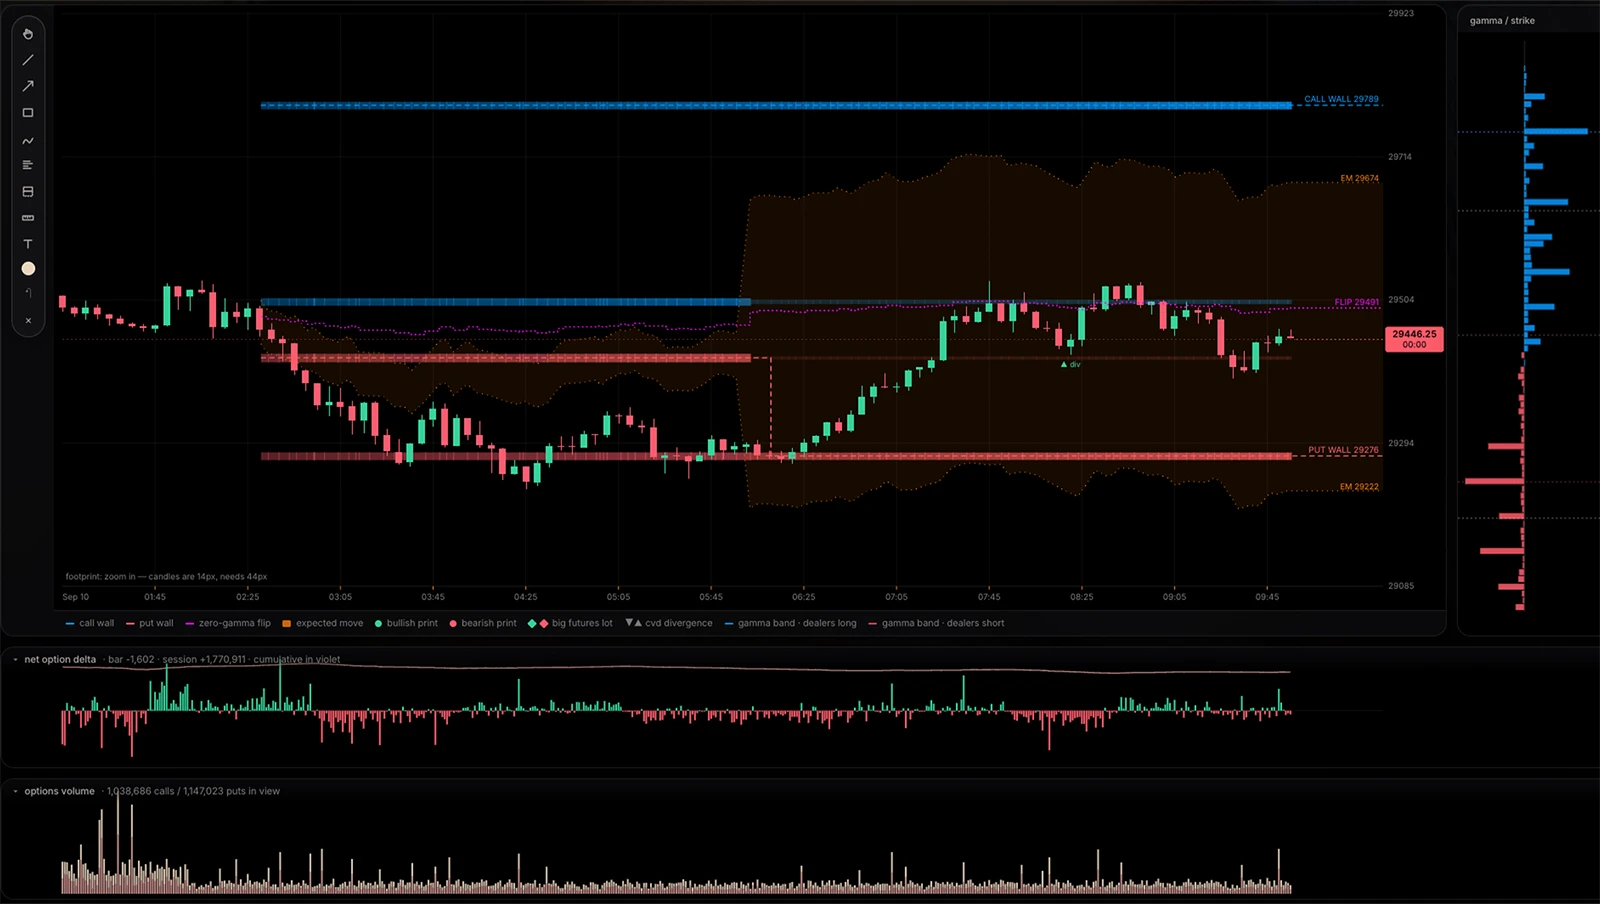
Open interest is published once a day, so a heatmap of it is the same ladder drawn a hundred times. This shares the chart's price scale and nothing else: call gamma above the flip, put gamma below, each strike at its own height. Six lenses: open interest or traded volume, all expiries, 0DTE or 1DTE.
Call wall, zero-gamma flip, expected move and the high-volume level, marked where they sit.
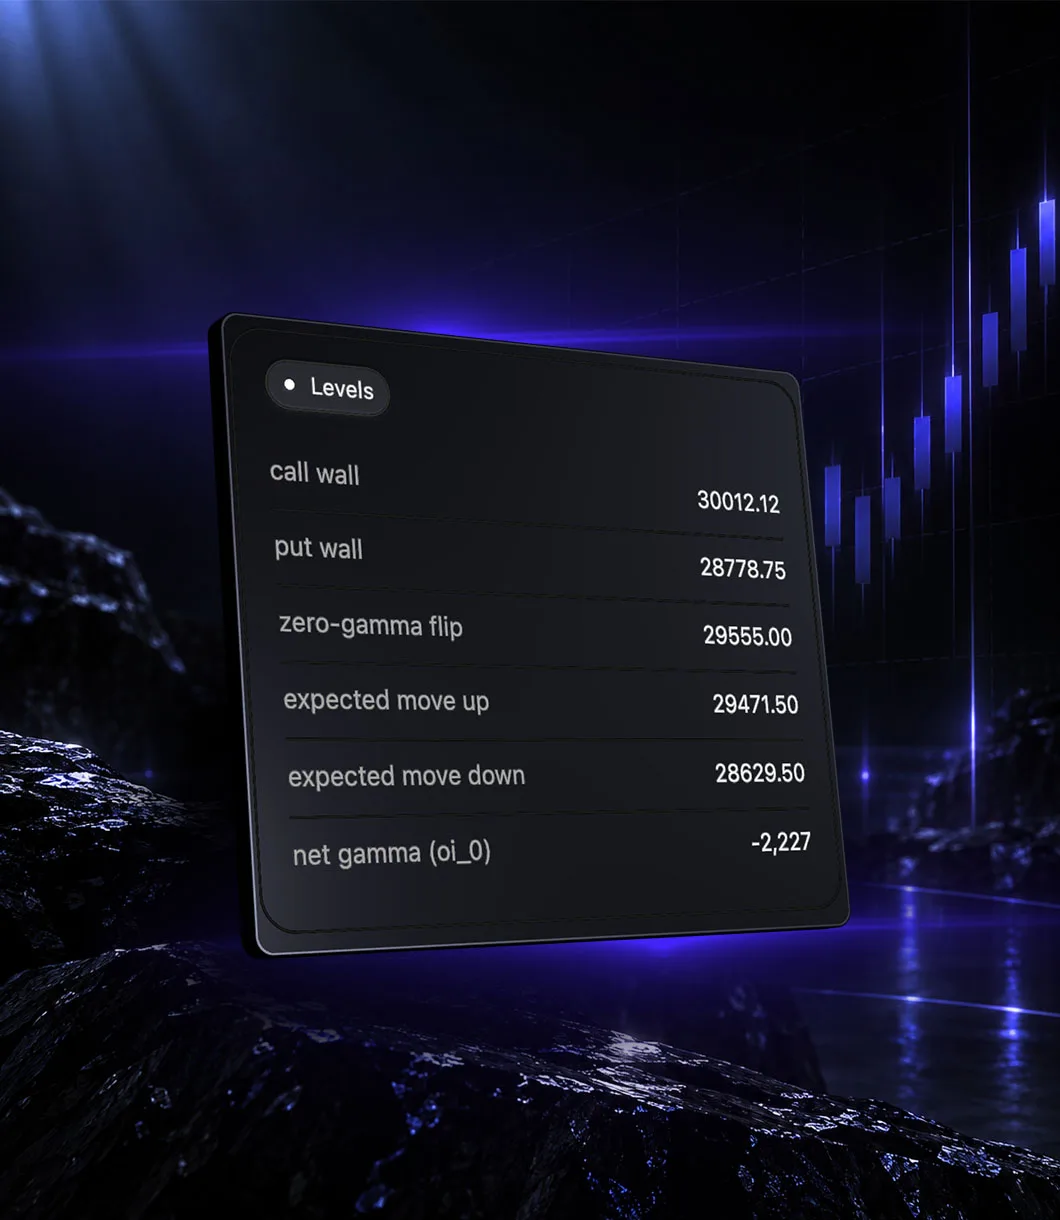
The whole board as six numbers.
Call wall, put wall, the zero-gamma flip, expected move up and down, and net gamma, read off the same chain the profile is built from, for whichever lens the bar is set to. Across sixteen years the call wall was crossed about as often as a random level the same distance away, so it is drawn as a place to measure from, never as a floor.
The same six values the API returns as JSON. No interpretation, no arrows, no target.
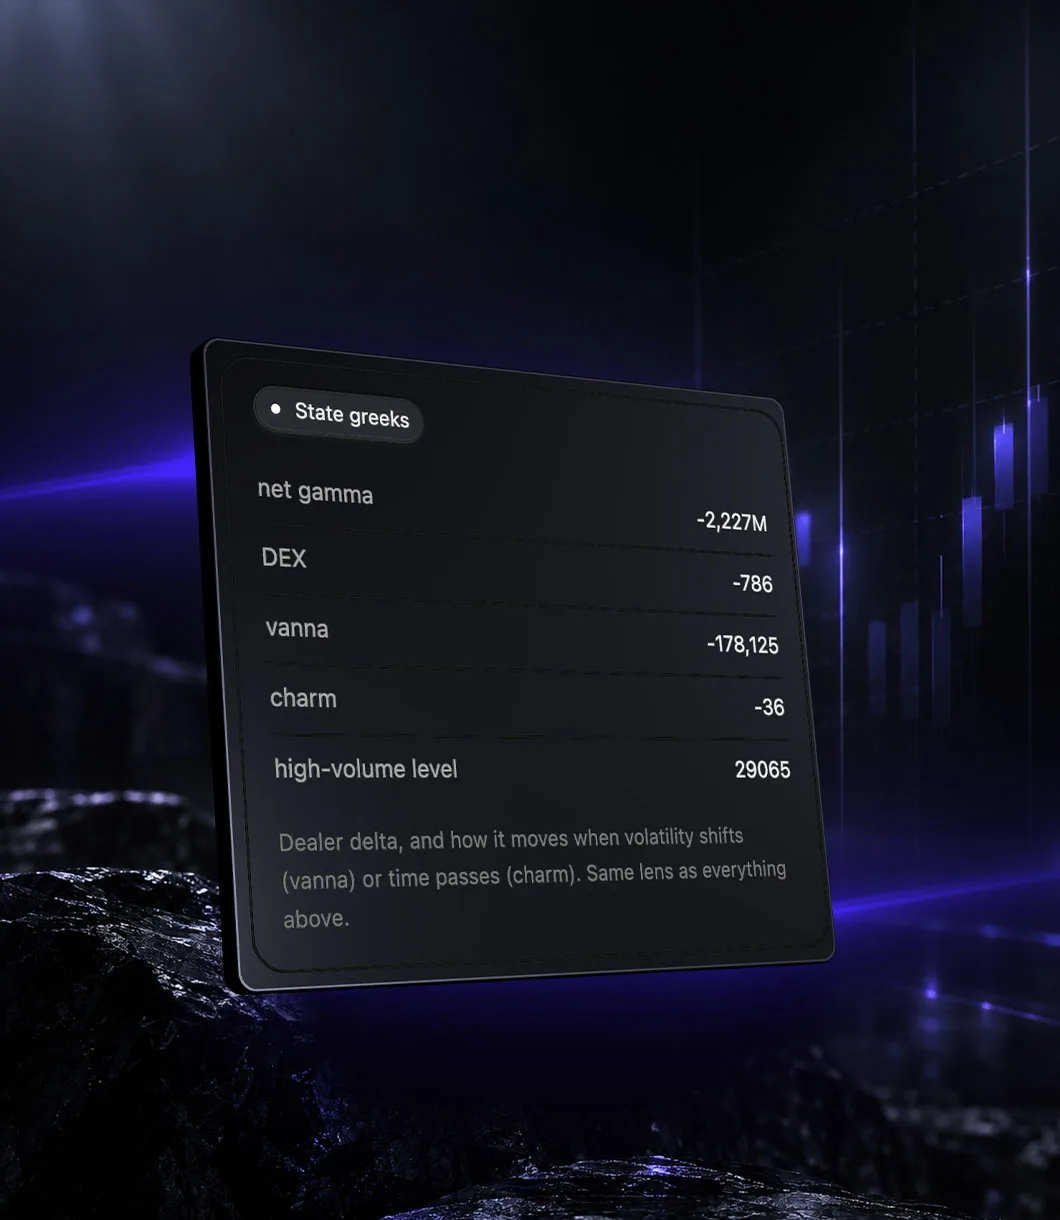
How dealer delta drifts.
Net gamma and DEX for where the book sits now; vanna and charm for how that position moves when volatility shifts or time simply passes. The high-volume level sits underneath. Same lens as the profile above it, so the numbers and the ladder always agree.
Vanna for a shift in volatility, charm for the passing of time. Magnitude, not a direction.
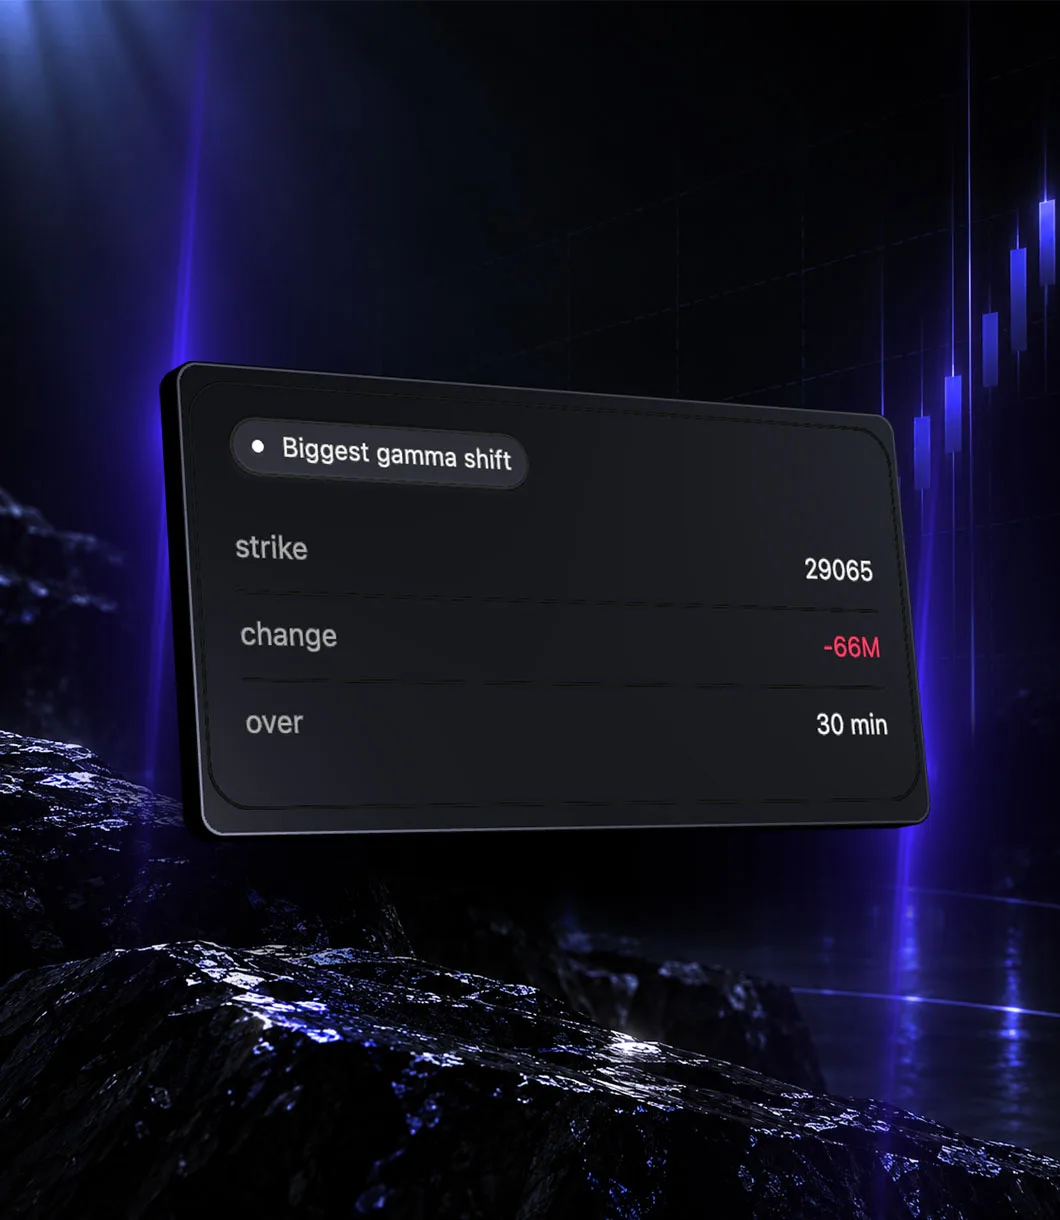
Where the board moved, and by how much.
The strike whose gamma changed most over the last window, the size of the change, and the window it was measured over. Standing open interest tells you where the board is; this tells you where it is being rebuilt while the session runs.
A wall being built or dismantled is worth more than one that has sat there since the open.
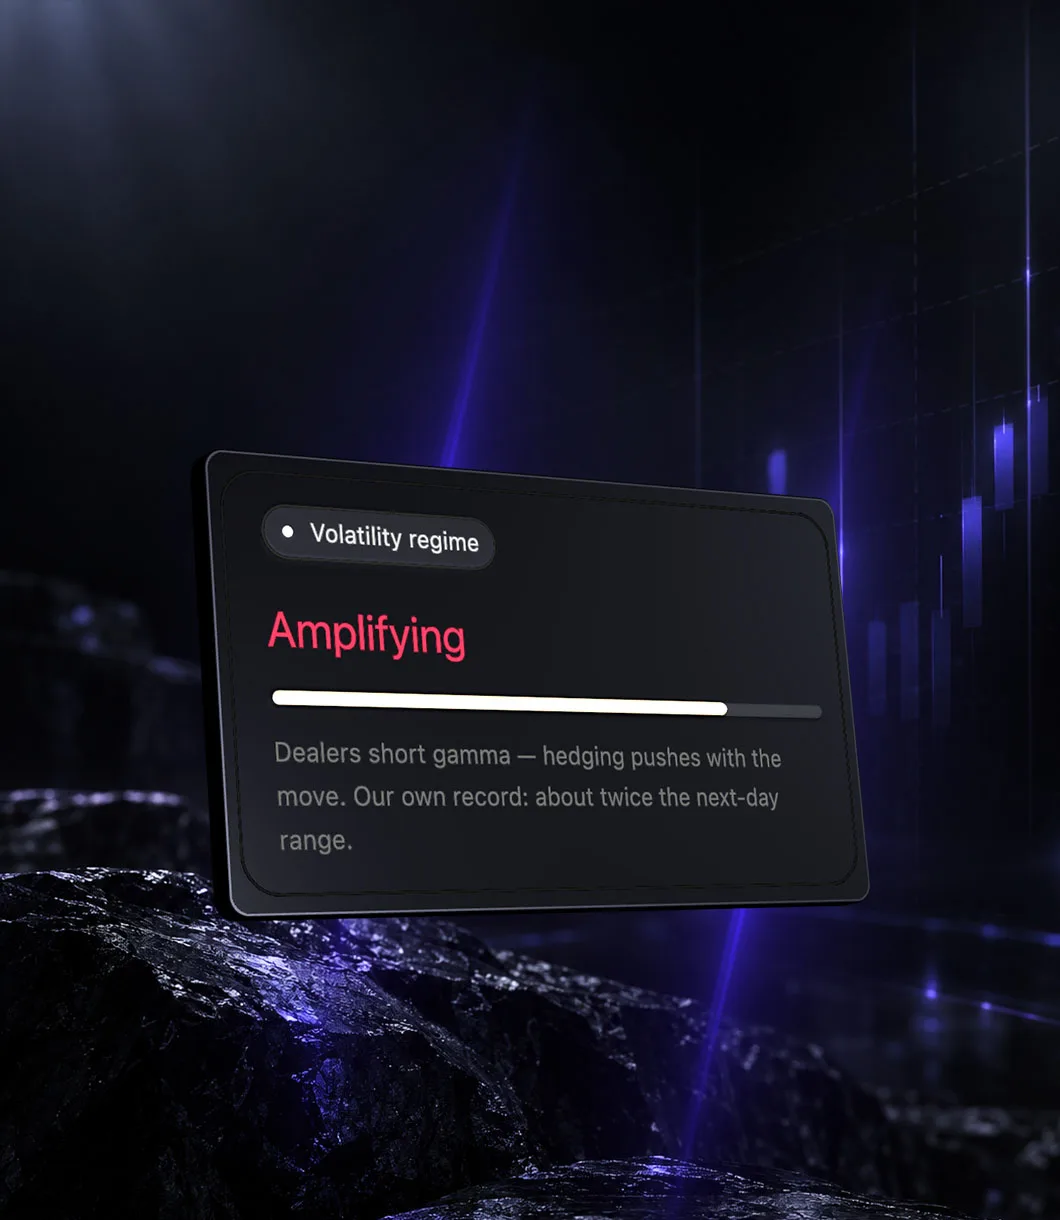
Amplifying: dealers short gamma.
Short gamma means dealers hedge in the direction of the move, and the move carries further than the flow that started it. This is a magnitude reading and the panel says so: it will never tell you which way to lean, only how hard the tape is likely to swing.
Hedging pushes with the move. On our own record that preceded about twice the next-day range.
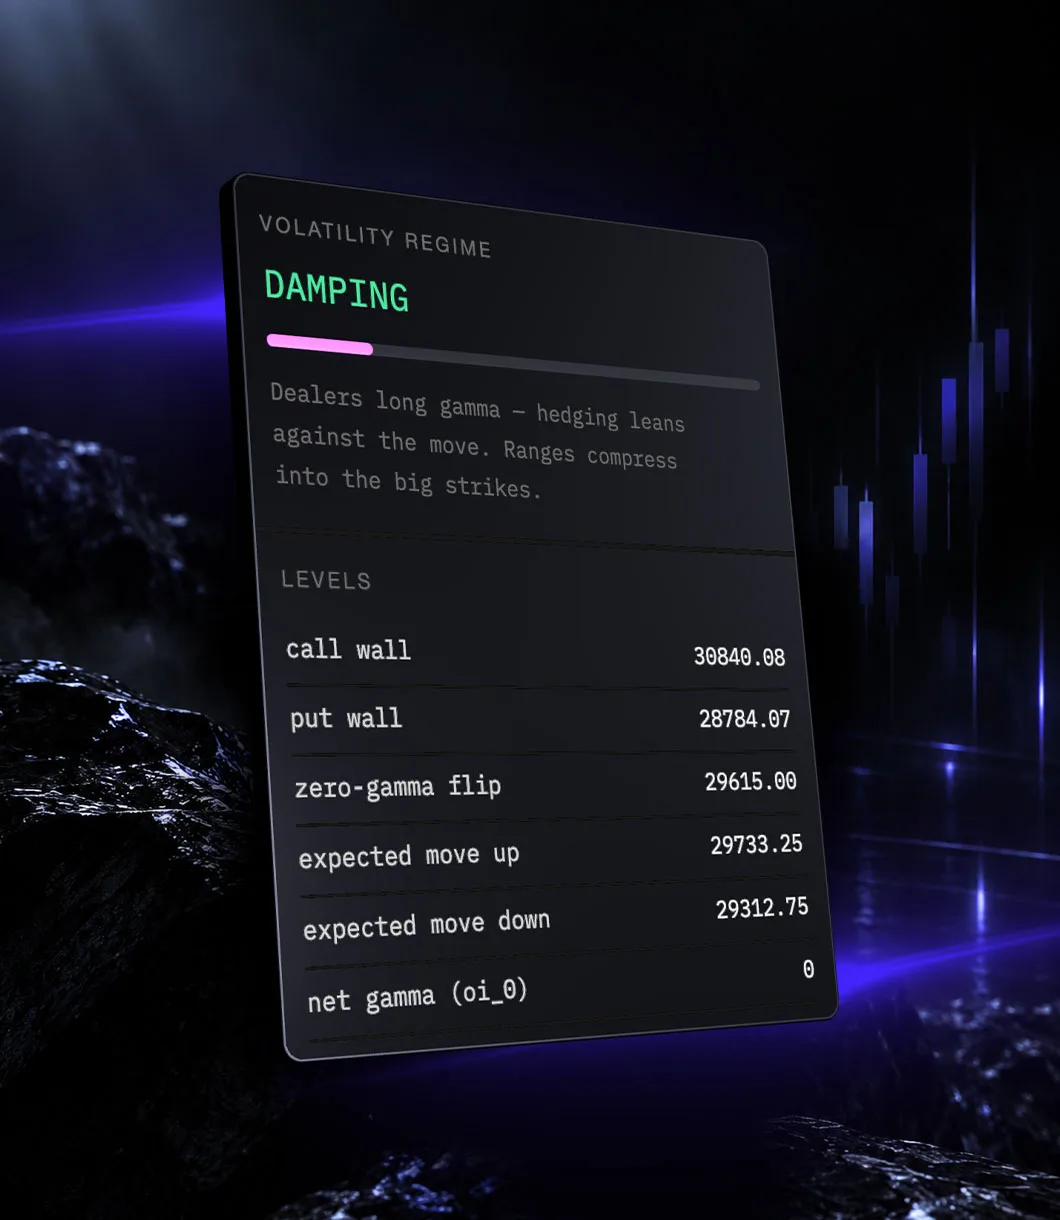
Damping: dealers long gamma.
Long gamma means the hedging flow leans against the move, and price tends to settle between the big strikes rather than run past them. The levels are printed underneath so the compression has somewhere to happen.
Hedging leans against the move and ranges compress into the big strikes. The levels sit underneath.
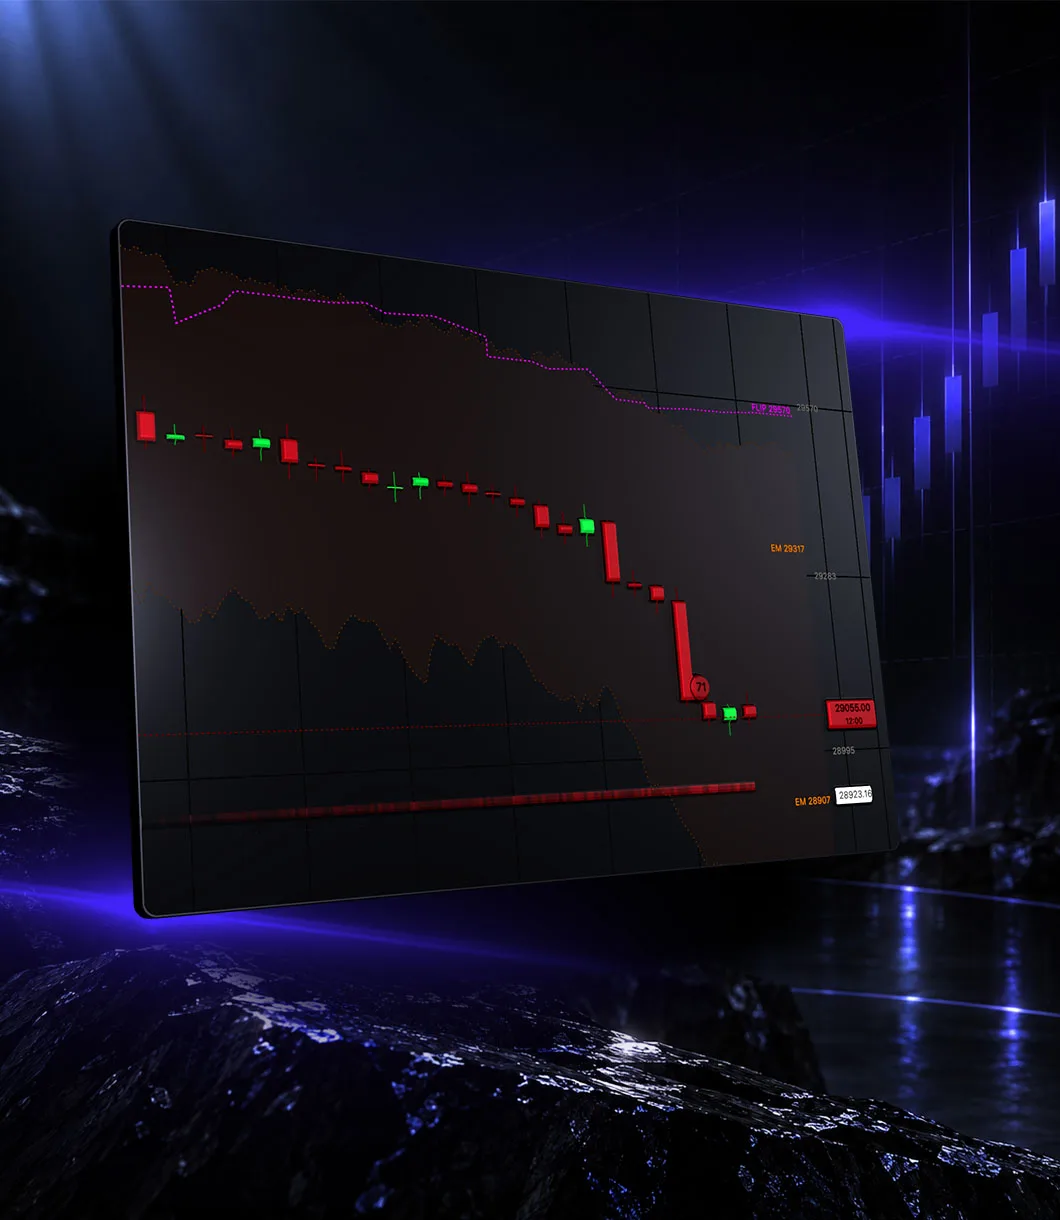
The candles carry the state.
The regime is not a separate widget you have to remember to check. Negative gamma tints the candles, the zero-gamma flip runs as a line above or below price, and the expected move bands move with the chain as it updates through the session.
Negative gamma tints the chart, the flip line runs above price, and the expected move bands travel with the chain.
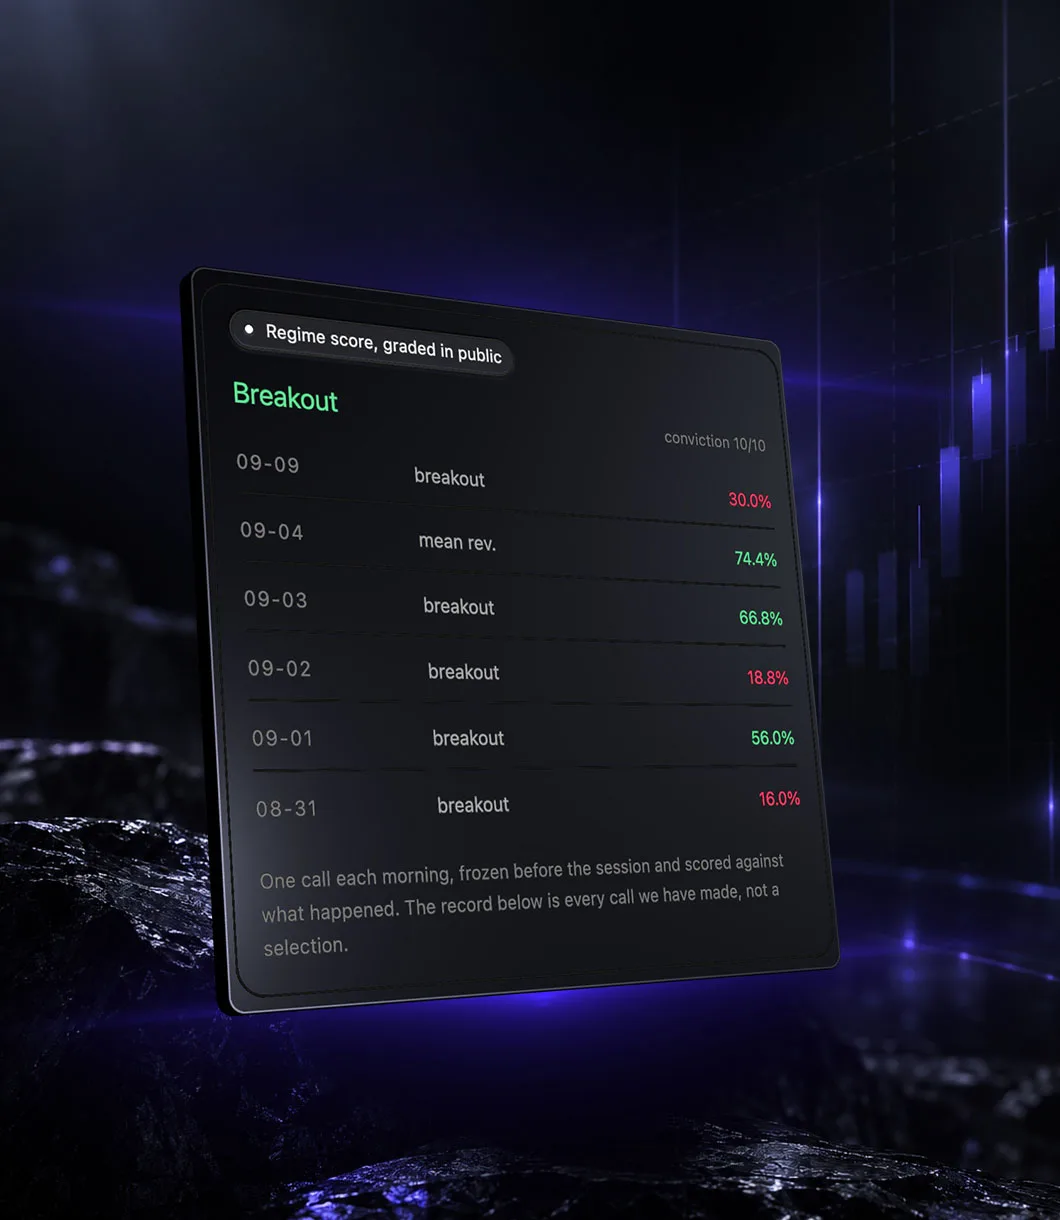
One call a morning, graded in public.
Breakout or mean reversion, with a conviction number, frozen before the session opens and scored against what actually happened. Every past call stays on the list, including the ones that missed. The record is the product; a single call is only a sample of it.
Breakout or mean reversion, frozen before the open. The list is every call we made, not a selection.
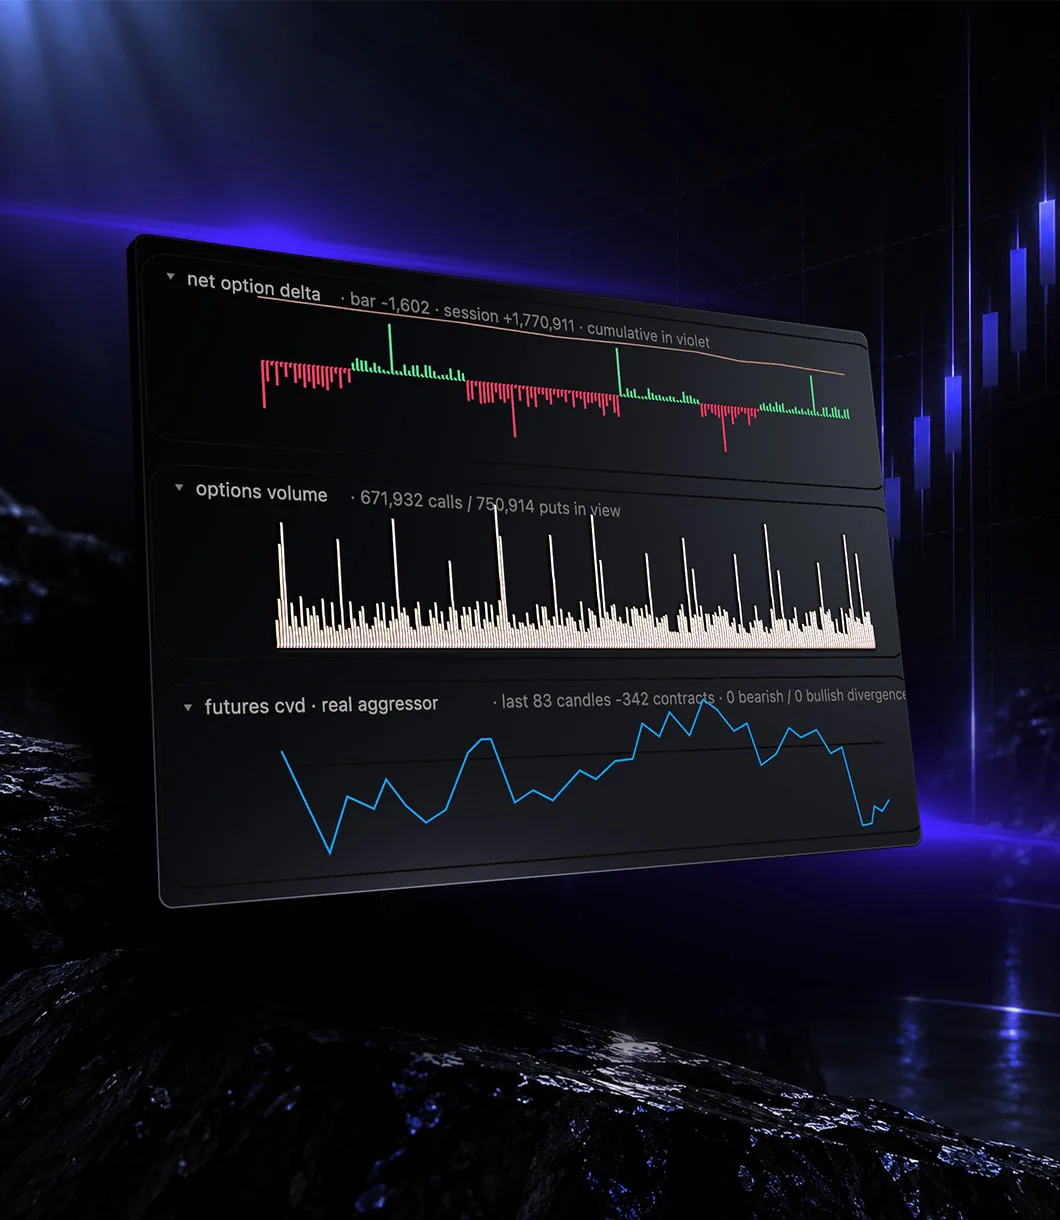
Net option delta, per bar.
The delta customers put on per minute, the call and put volume behind it, and futures CVD built from the exchange's own recorded aggressor rather than a tick rule that guesses. Three panels, one time axis, and no smoothing that hides an individual print.
The call and put volume behind it, and futures CVD built from the exchange's own aggressor flag.
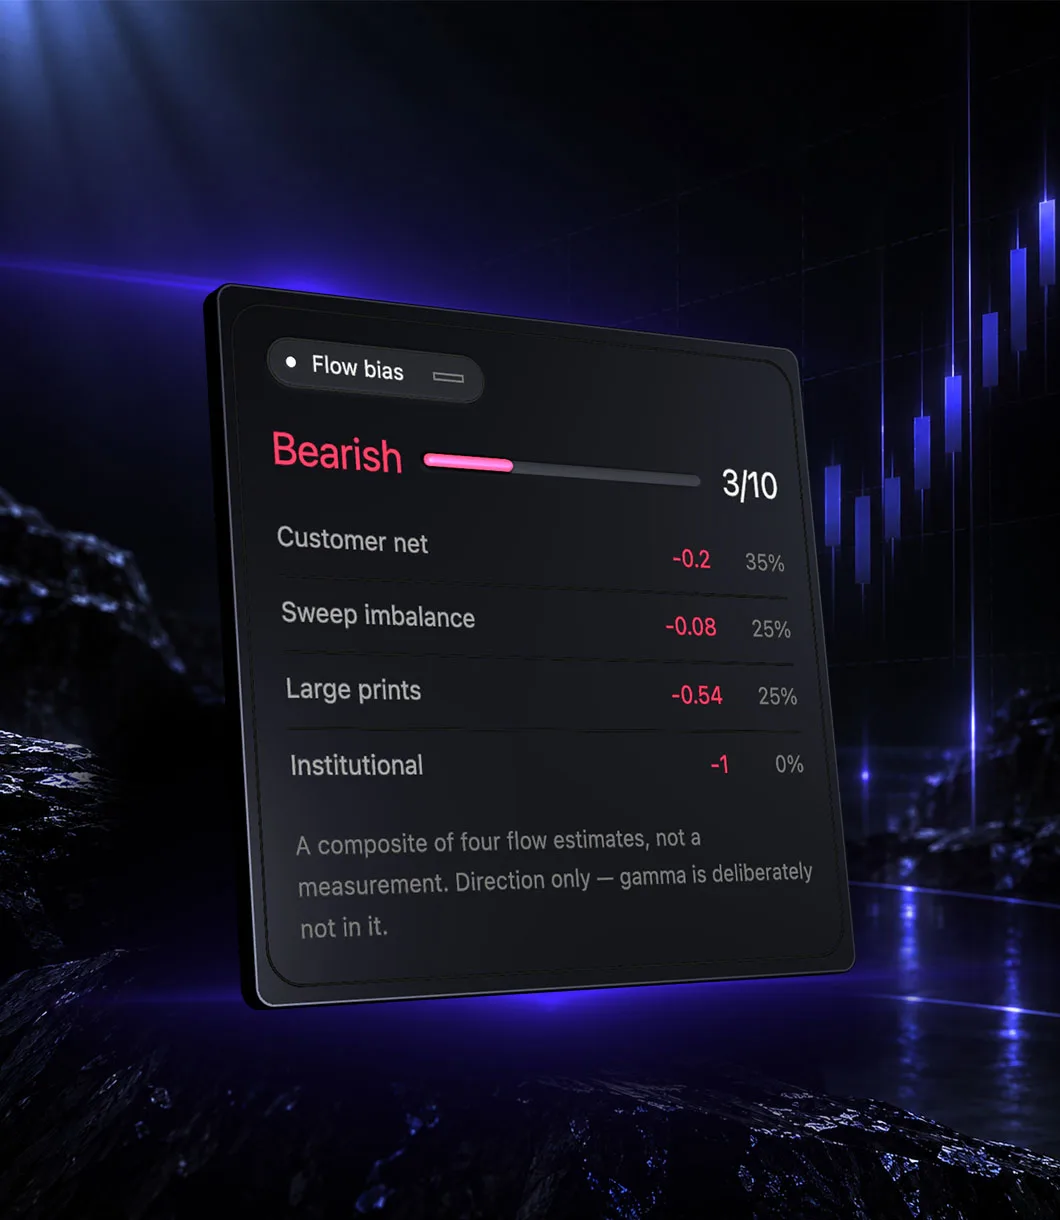
Four estimates, one reading.
Customer net, sweep imbalance, large prints and the institutional split, combined into one score with every input shown beside it. Dealer gamma is deliberately left out: mixing a magnitude signal into a direction score is how these readings start to lie.
Customer net, sweeps, large prints and the institutional split. It says estimate because it is one.
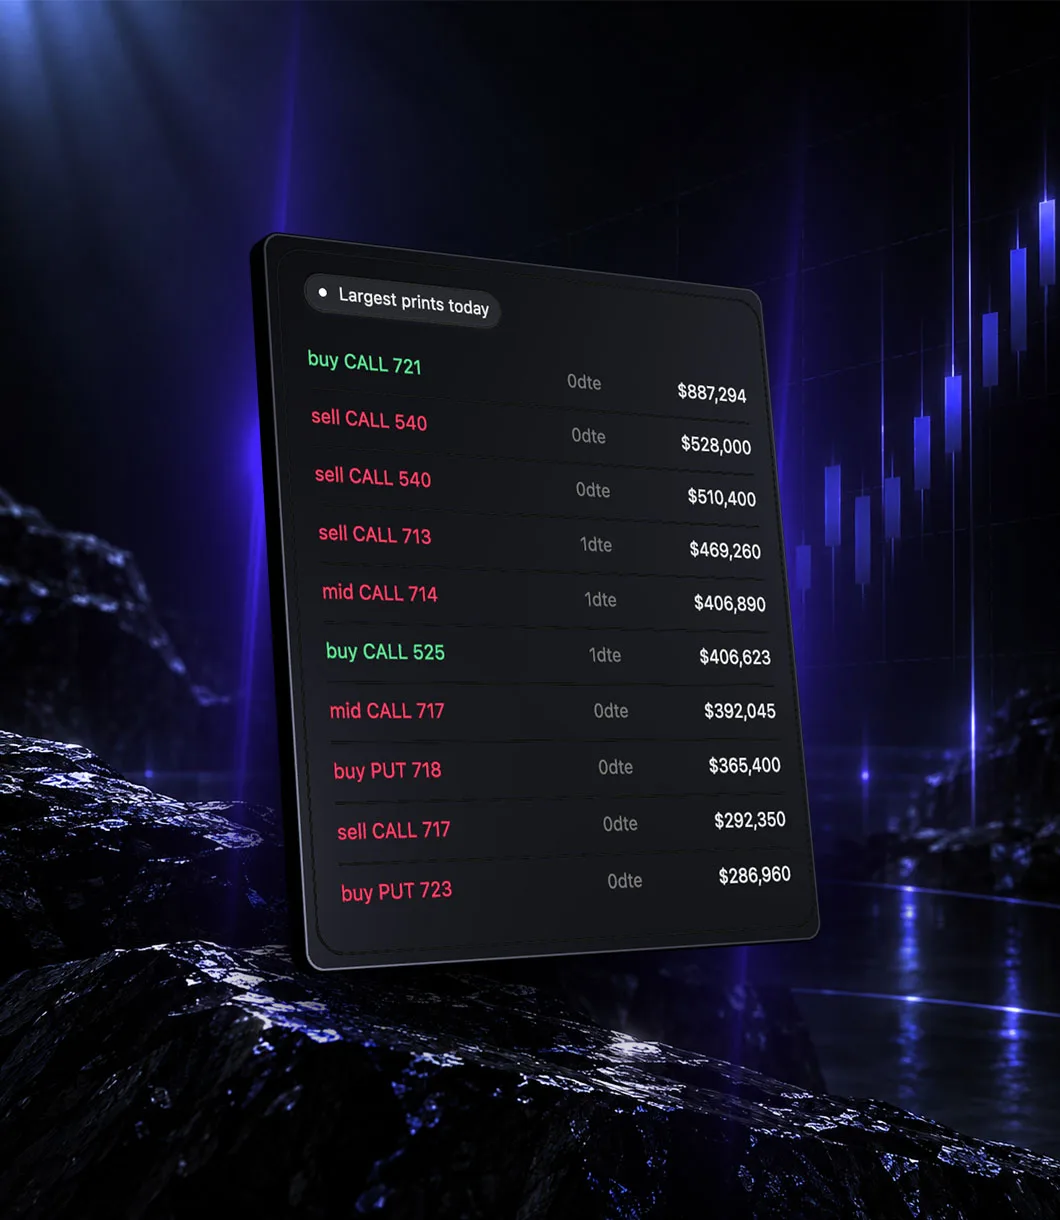
Sorted by what it cost to put on.
Every large option print of the session with its side, strike, expiry and notional, newest first. Expiry is on every row because a million dollars of 0DTE and a million dollars of four-week paper are not the same trade, and a list that hides the difference is worse than no list.
Side, strike and expiry on every row, with 0DTE and 1DTE marked where the money actually went.
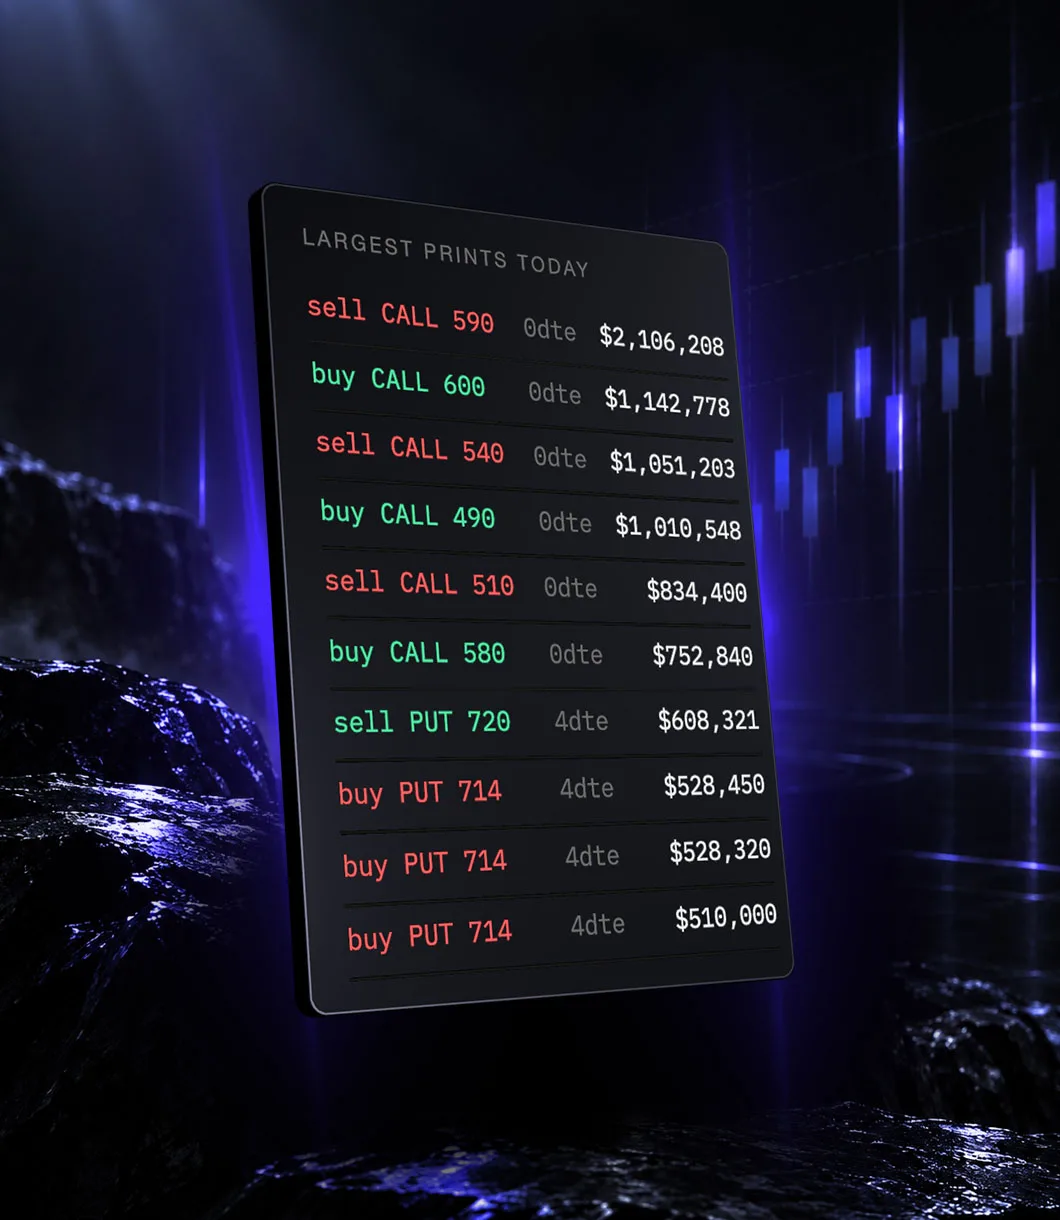
The list is the tape, not a shortlist.
What is on the list is what crossed the tape, including the prints that argue against whatever the bias above is reading. Nothing is dropped for being inconvenient, because a tape you have curated is no longer a tape.
Including the prints that argue against whatever the bias says. Nothing is filtered out for looking wrong.
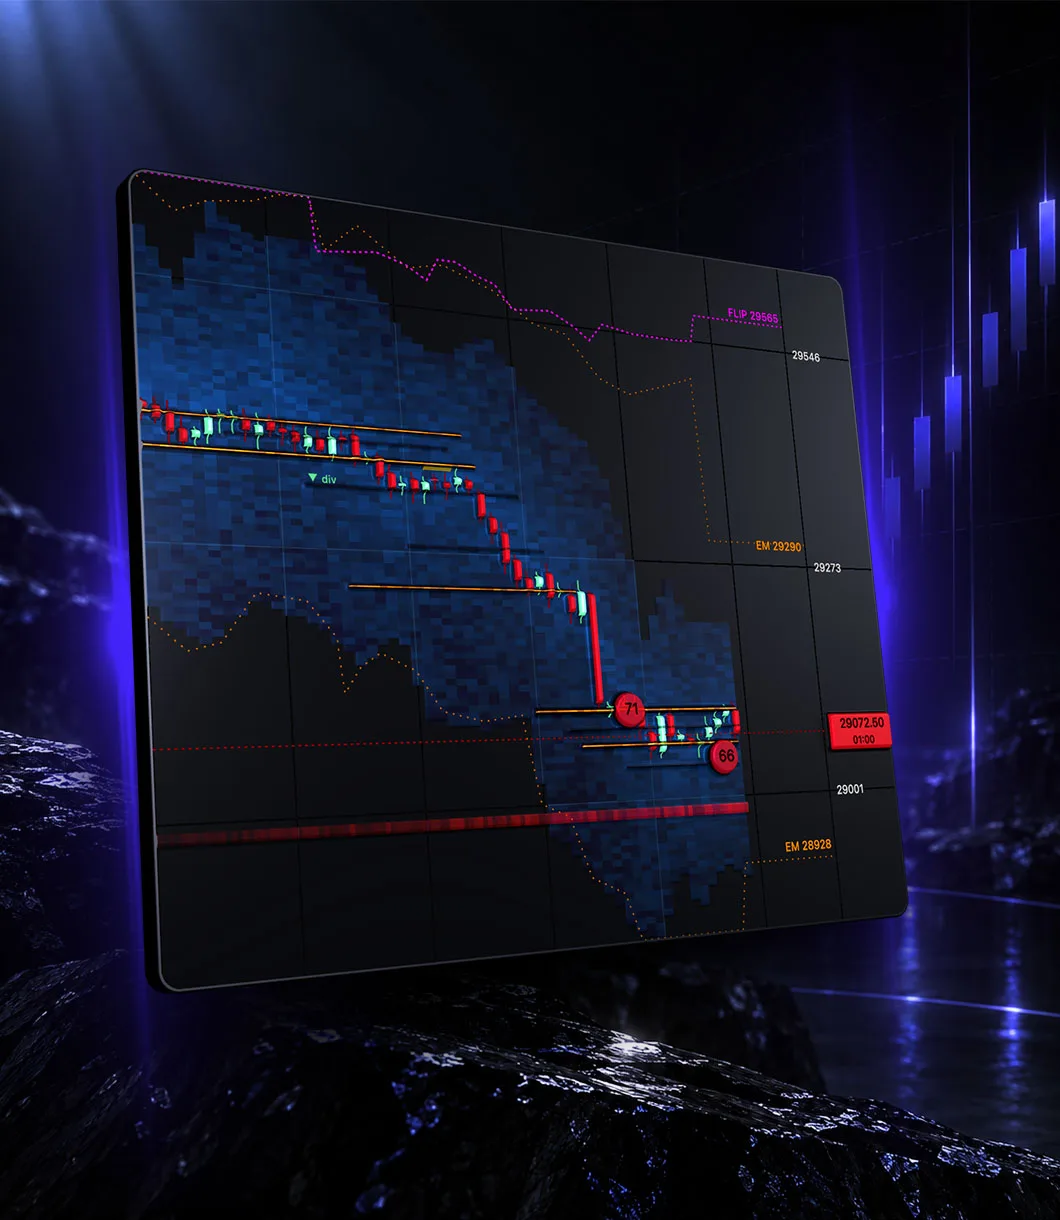
Resting depth, behind the candles.
Resting depth from our own Level 2 recording, drawn at the price where it actually sits: bright where the queue is deep, dark where it is thin, behind the candles instead of beside them. Size that leaves the book leaves the picture in the same instant.
From our own Level 2 recording. Size that leaves the book leaves the picture the moment it goes.
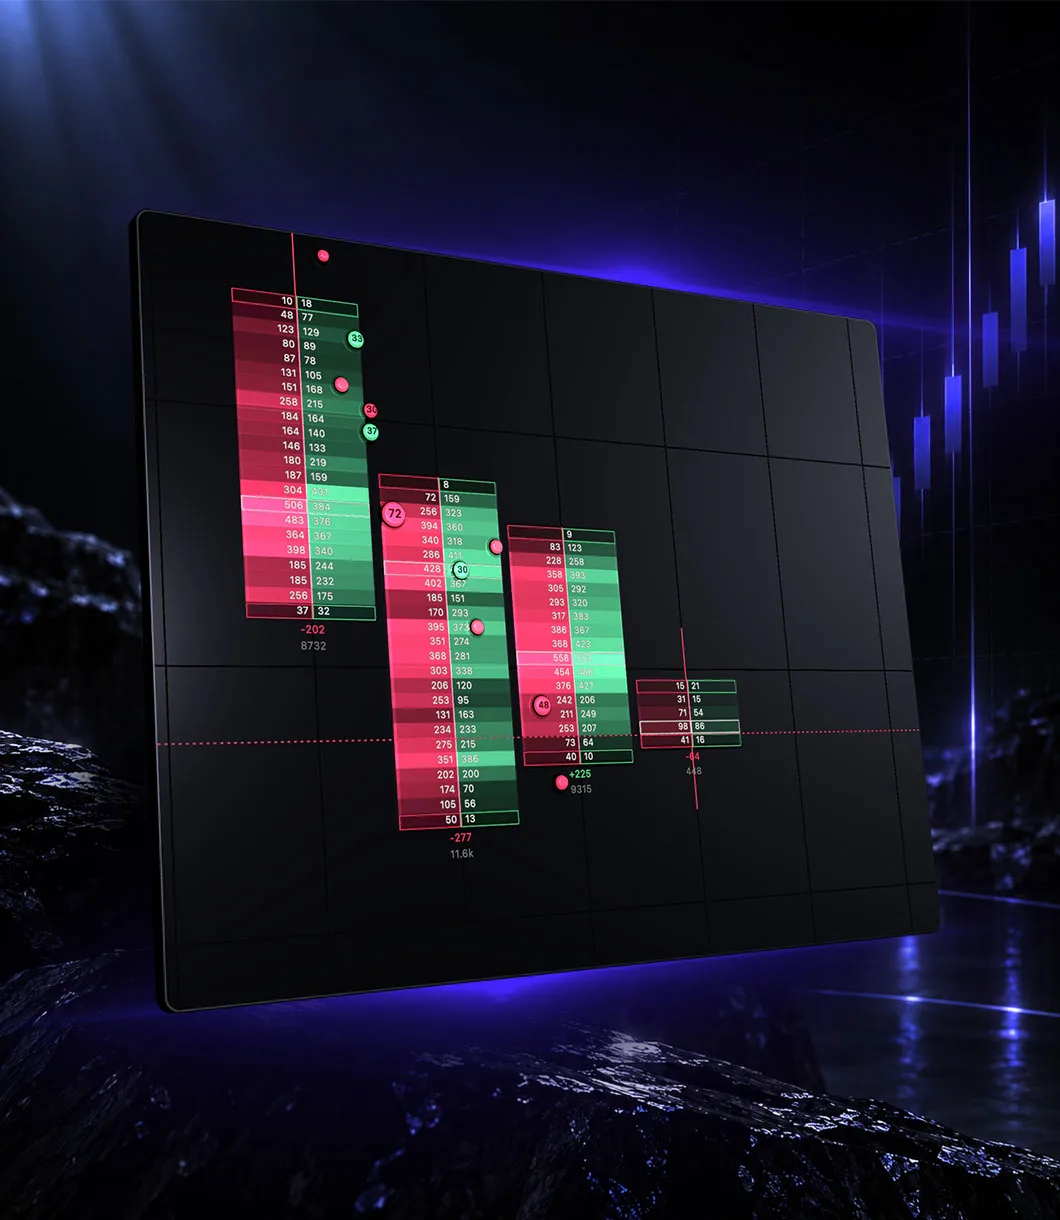
Bid and ask at every price, inside the bar.
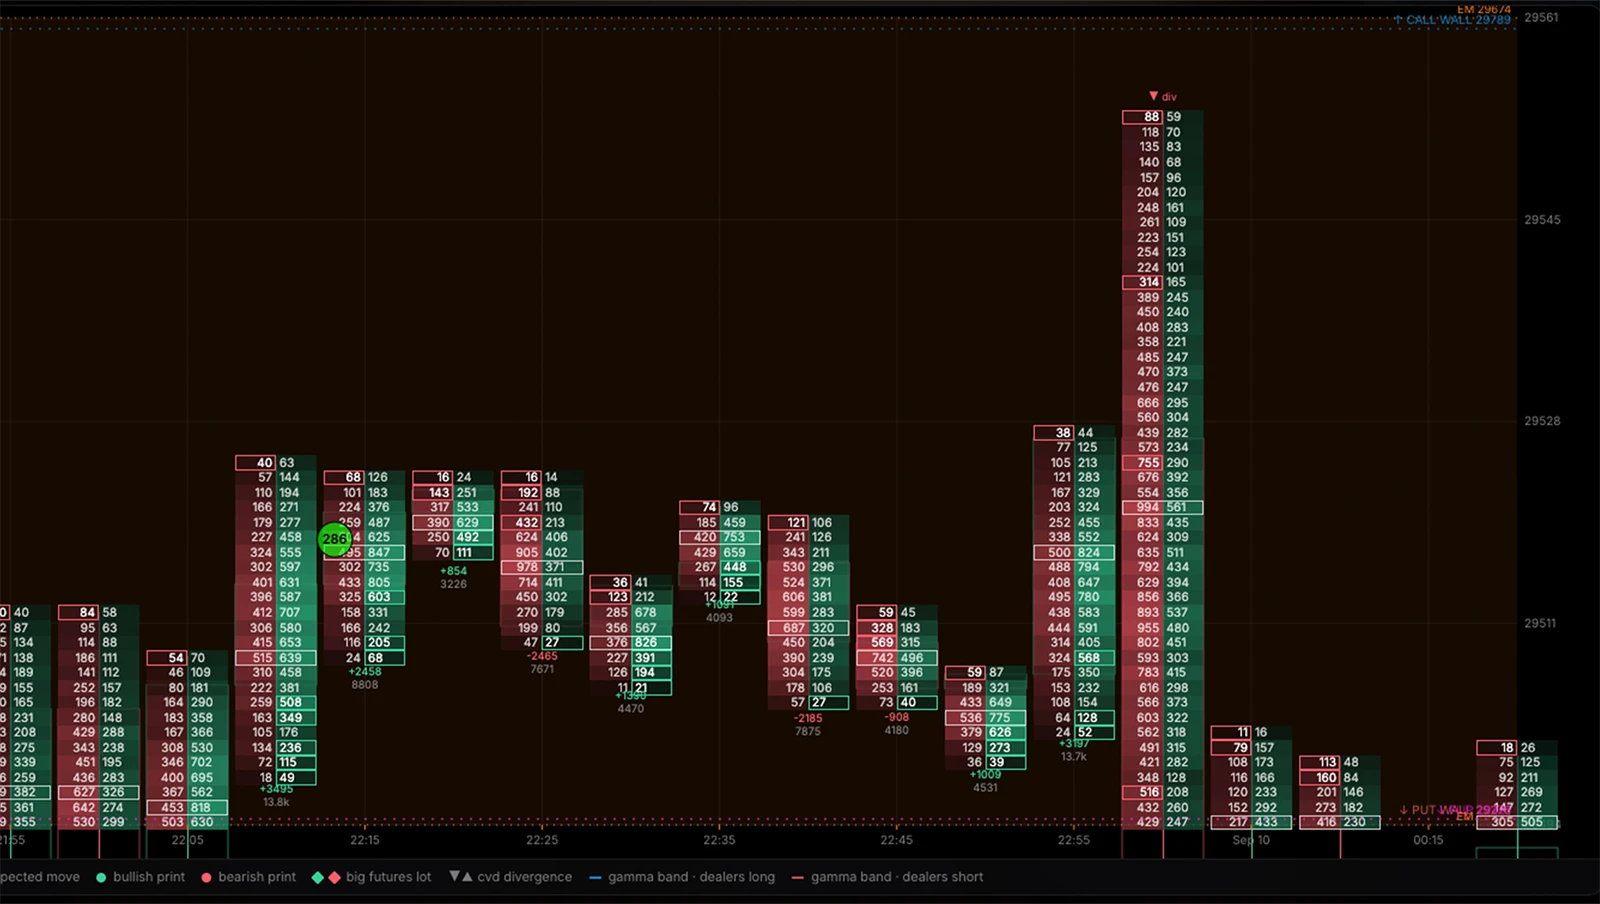
Volume traded at the bid and at the ask for every price level inside the candle, imbalances ringed, delta and total underneath. Built from our own tape with the exchange's aggressor flag on each print, not inferred from where the last trade sat against a quote.
Imbalances ringed, delta and total underneath, from our tape, with the aggressor flag on every print.
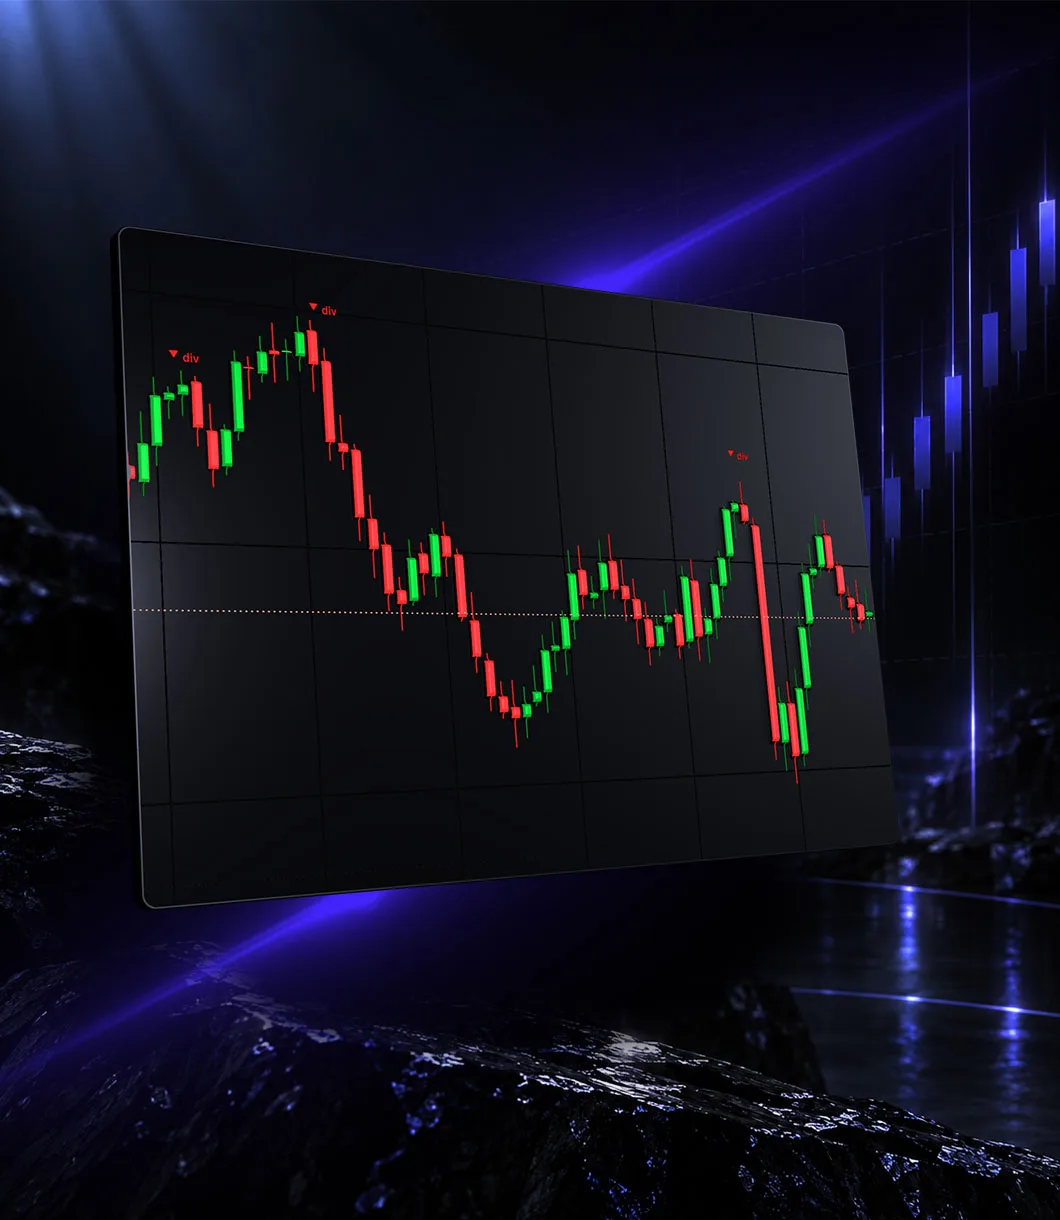
Where the tape disagrees with price.
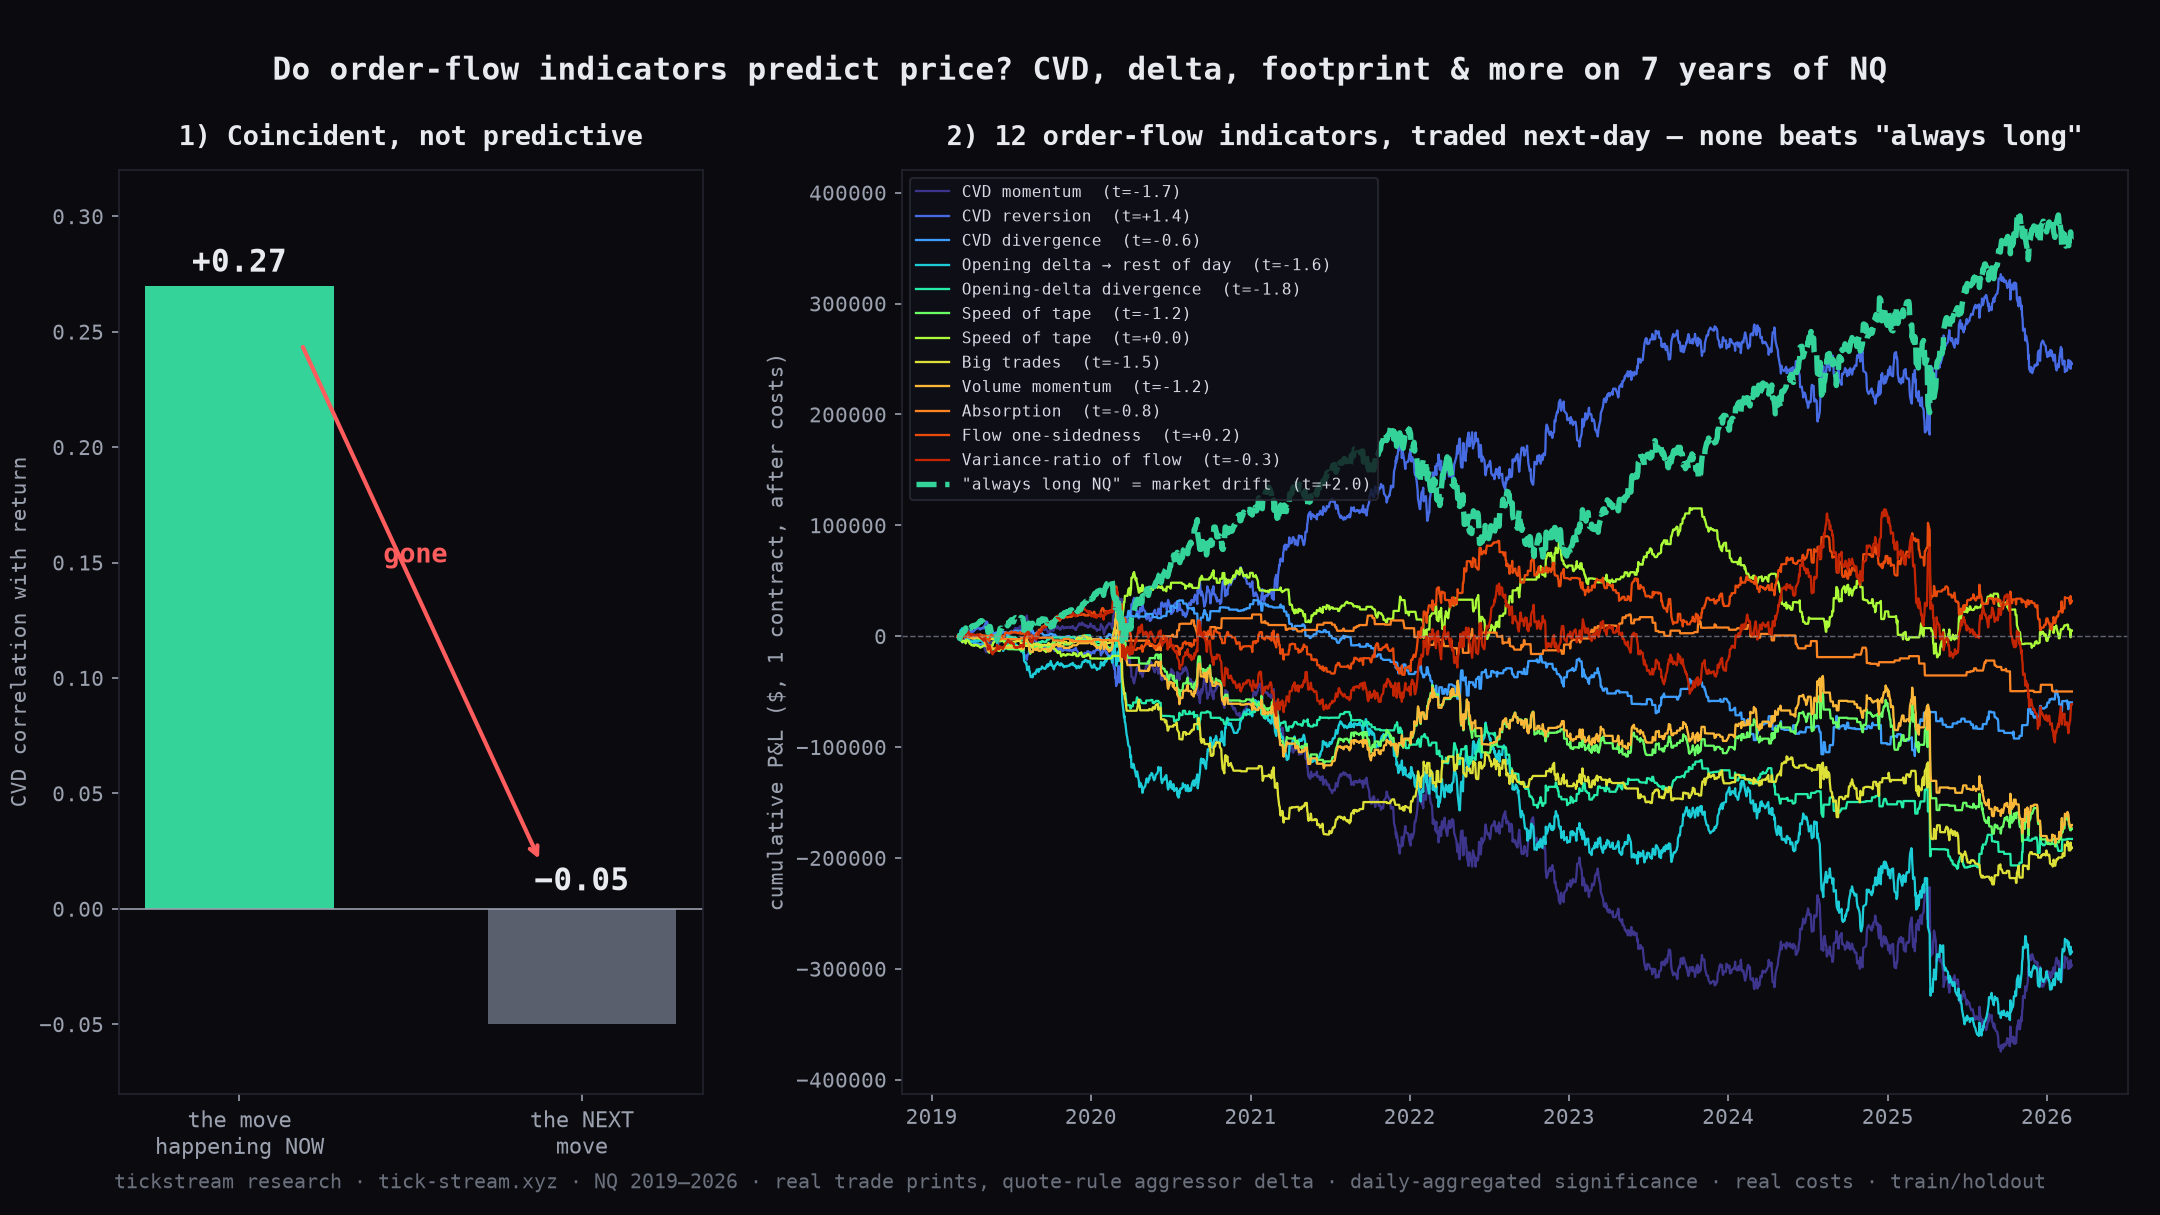
A marker wherever cumulative delta and price point different ways. It is a flag and nothing more: our own research killed order flow as a direction filter on 22 of 25 strategies, so the screen shows you the disagreement and leaves the conclusion to you.
Marked, never traded for you: our own research killed order flow as a direction filter on 22 of 25 strategies.
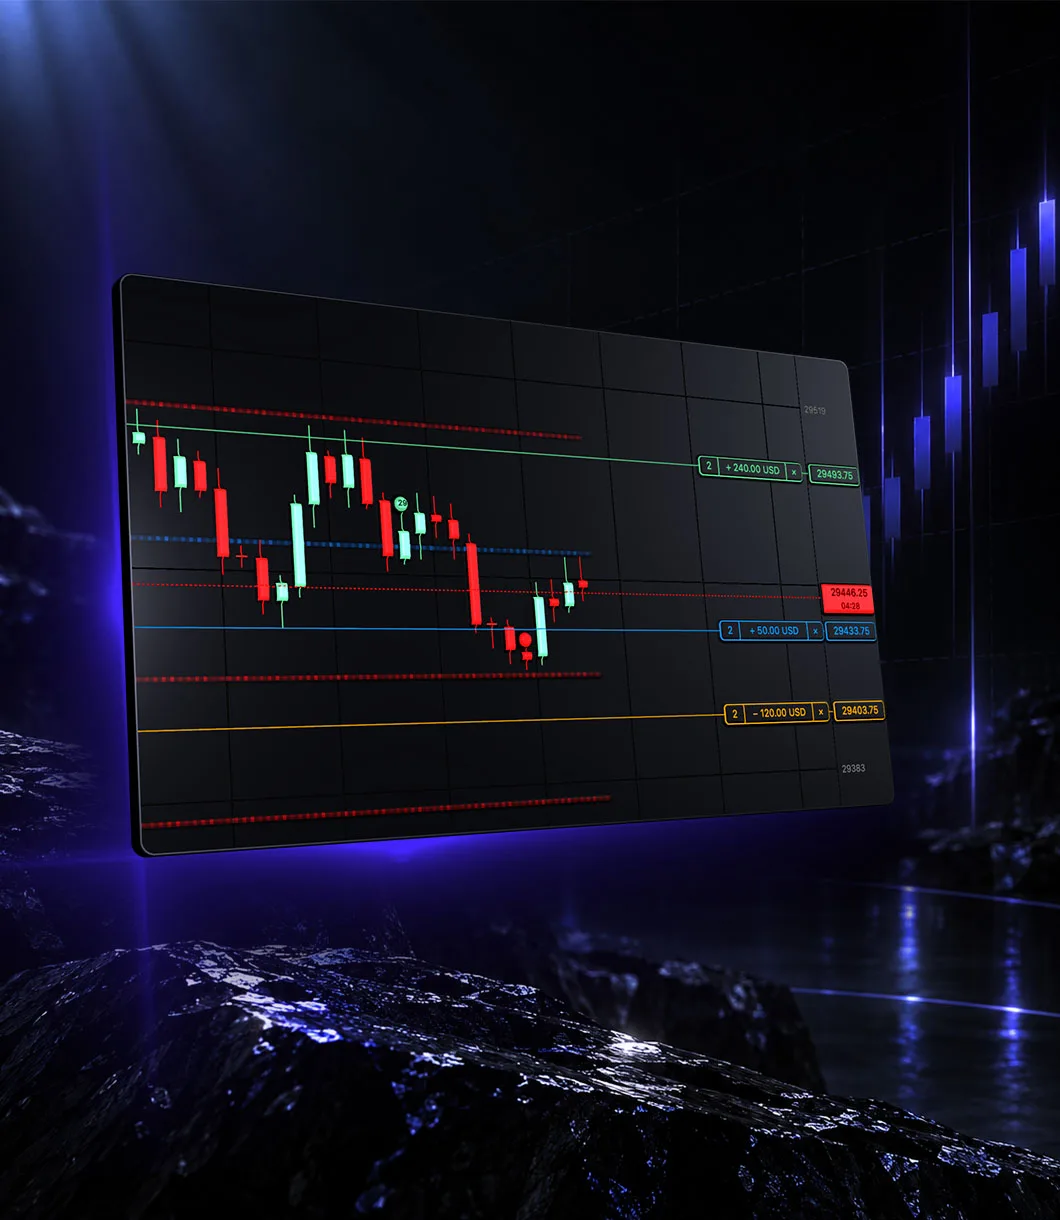
Your stop and target, drawn where they rest.
Entry, stop and target as lines on the same candles, each labelled with the dollars it would book at that price. Drag a line and the bracket at the broker moves with it. What is drawn is what is resting, never a sketch of what you meant to do.
Each line labelled with the dollars it books. Drag one and the bracket at the broker moves with it.
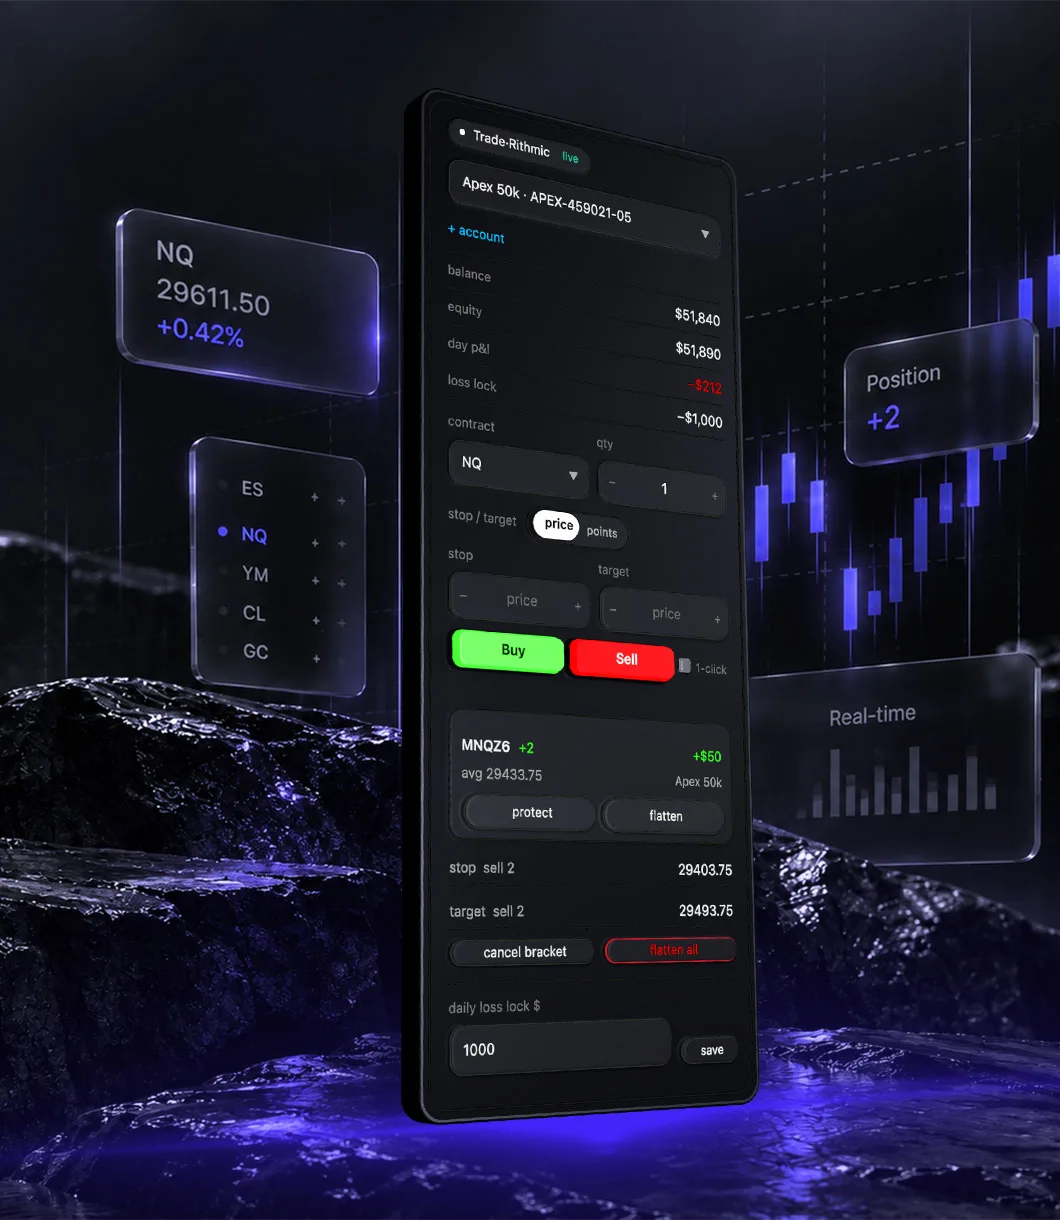
Your broker, in the same window.
Balance, equity and day P&L from the linked Rithmic account, market entry with a native stop-and-target OCO that rests at the exchange, and a daily loss lock that refuses new entries once it is hit. Positions and fills are read back from the broker, never assumed.
A native OCO that rests at the exchange, and a daily loss lock that refuses new entries once it is hit.
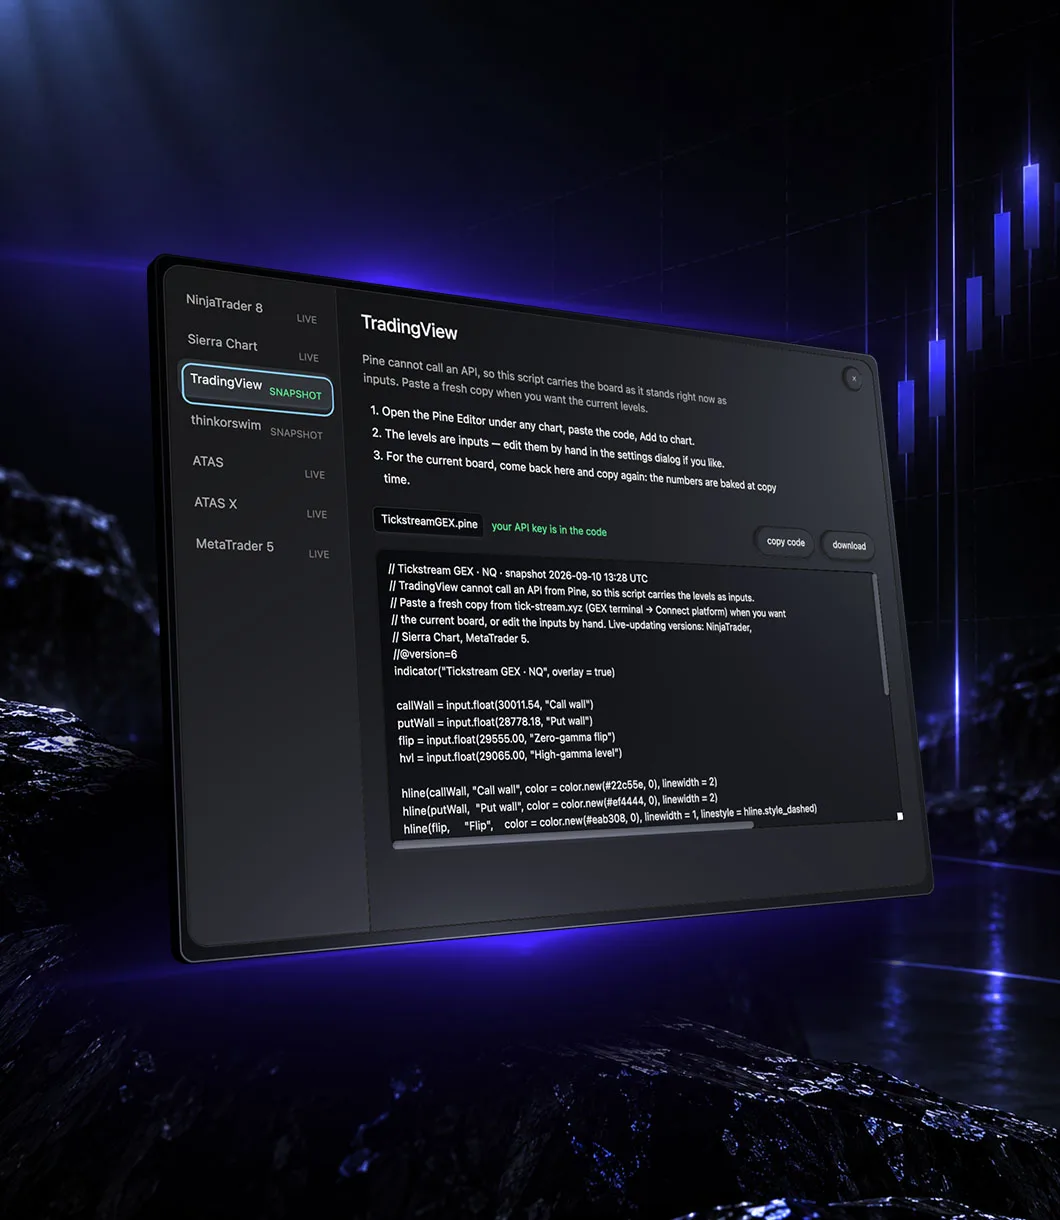
Take the levels with you.
Live-updating scripts for NinjaTrader 8, Sierra Chart, ATAS and MetaTrader 5, plus a snapshot script for TradingView and thinkorswim, which cannot call an API from Pine. The board arrives as inputs your own chart draws, so the levels on your screen are the ones on ours.
Live scripts for NinjaTrader, Sierra Chart, ATAS and MetaTrader 5; a snapshot for TradingView and thinkorswim.
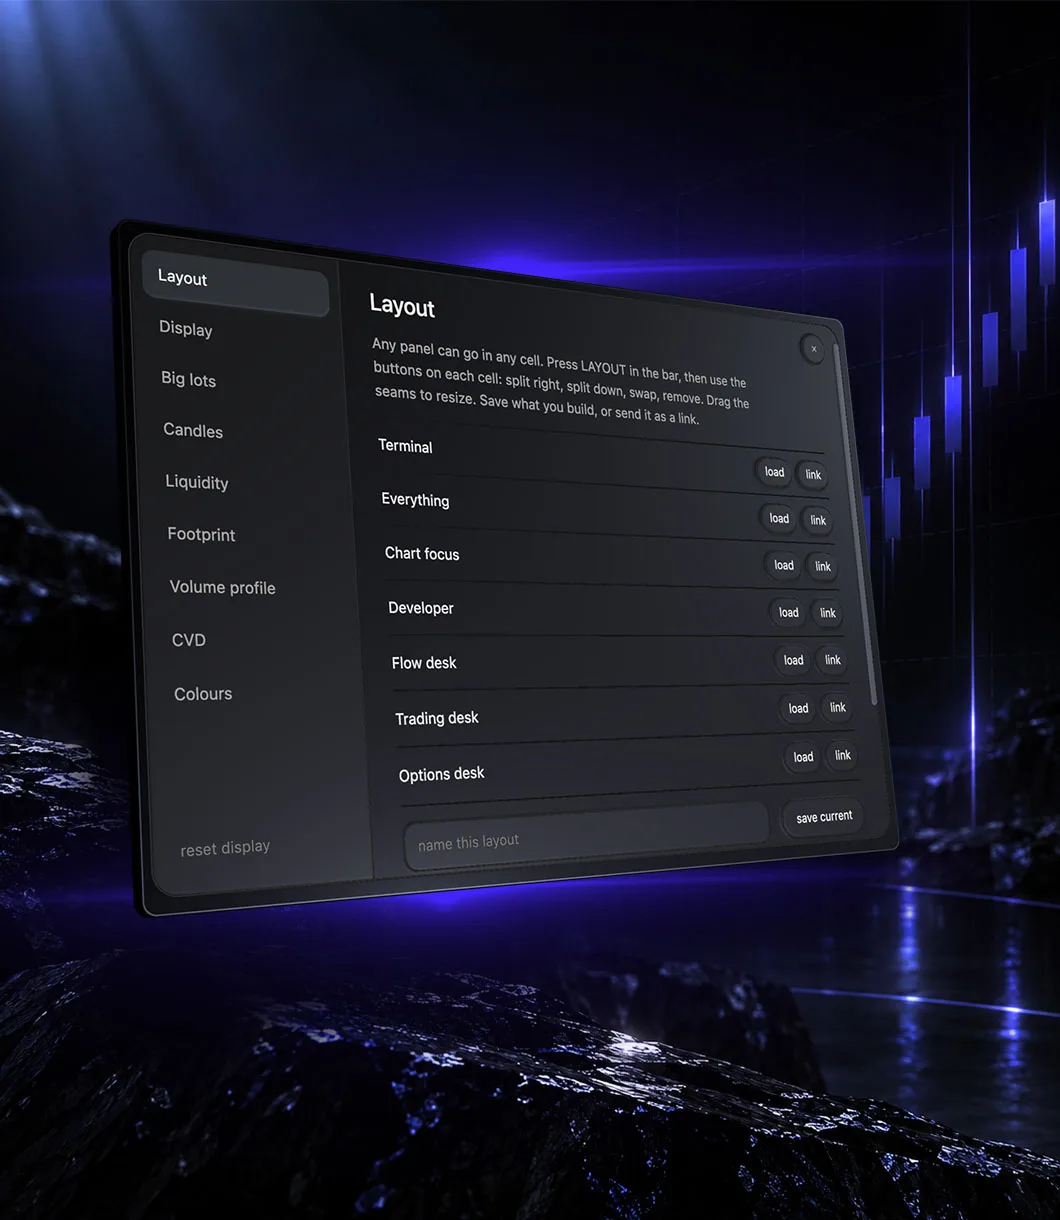
A layout that is yours, not ours.
Any panel in any cell. Split a cell right or down, drag the seams, and keep going: the grid nests without a limit. Save what you build under a name, or send it as a link that opens the same screen for whoever receives it. Seven presets ship with it, from Terminal to Options desk.
Any panel in any cell, nested without a limit. Save it under a name, or send it as a link.
One screen, three ways in.
Start free, pay when it has to be live.
Answers to the questions that come up most.
How the platform works, what the data costs you (nothing extra), and what we will not claim about the numbers.
Backtests on our own tape, and what they killed


The whole platform is one click away.
Market data included. Open it, pick a market, read the order flow and the option flow, and trade it from the same window.