Do Order-Flow Indicators Actually Work? We Backtested CVD, Delta & Footprint on 7 Years of NQ
Cumulative volume delta, footprint charts, order-book imbalance, 'follow the smart-money order flow' — it's the hottest thing in retail day-trading. We tested it on 7 years of real NQ trade prints (aggressor recovered tick-by-tick from the prevailing bid/ask), lookahead-free with real costs. Order flow turns out to be coincident, not predictive: it explains the move that's happening, not the next one. The data, with a control.
Open day-trading YouTube right now and you’ll drown in order flow. Footprint charts, cumulative volume delta, the bid/ask DOM, “follow the smart-money absorption,” delta divergence. The pitch is always the same: price is lagging, but order flow shows you what’s really happening — so you can act before the move. We tested that claim properly, on seven years of real, aggressor-tagged NQ ticks.
The result is a single sentence: order flow is coincident, not predictive. It explains the move that’s happening; it does not tell you the next one.
The one chart that settles it
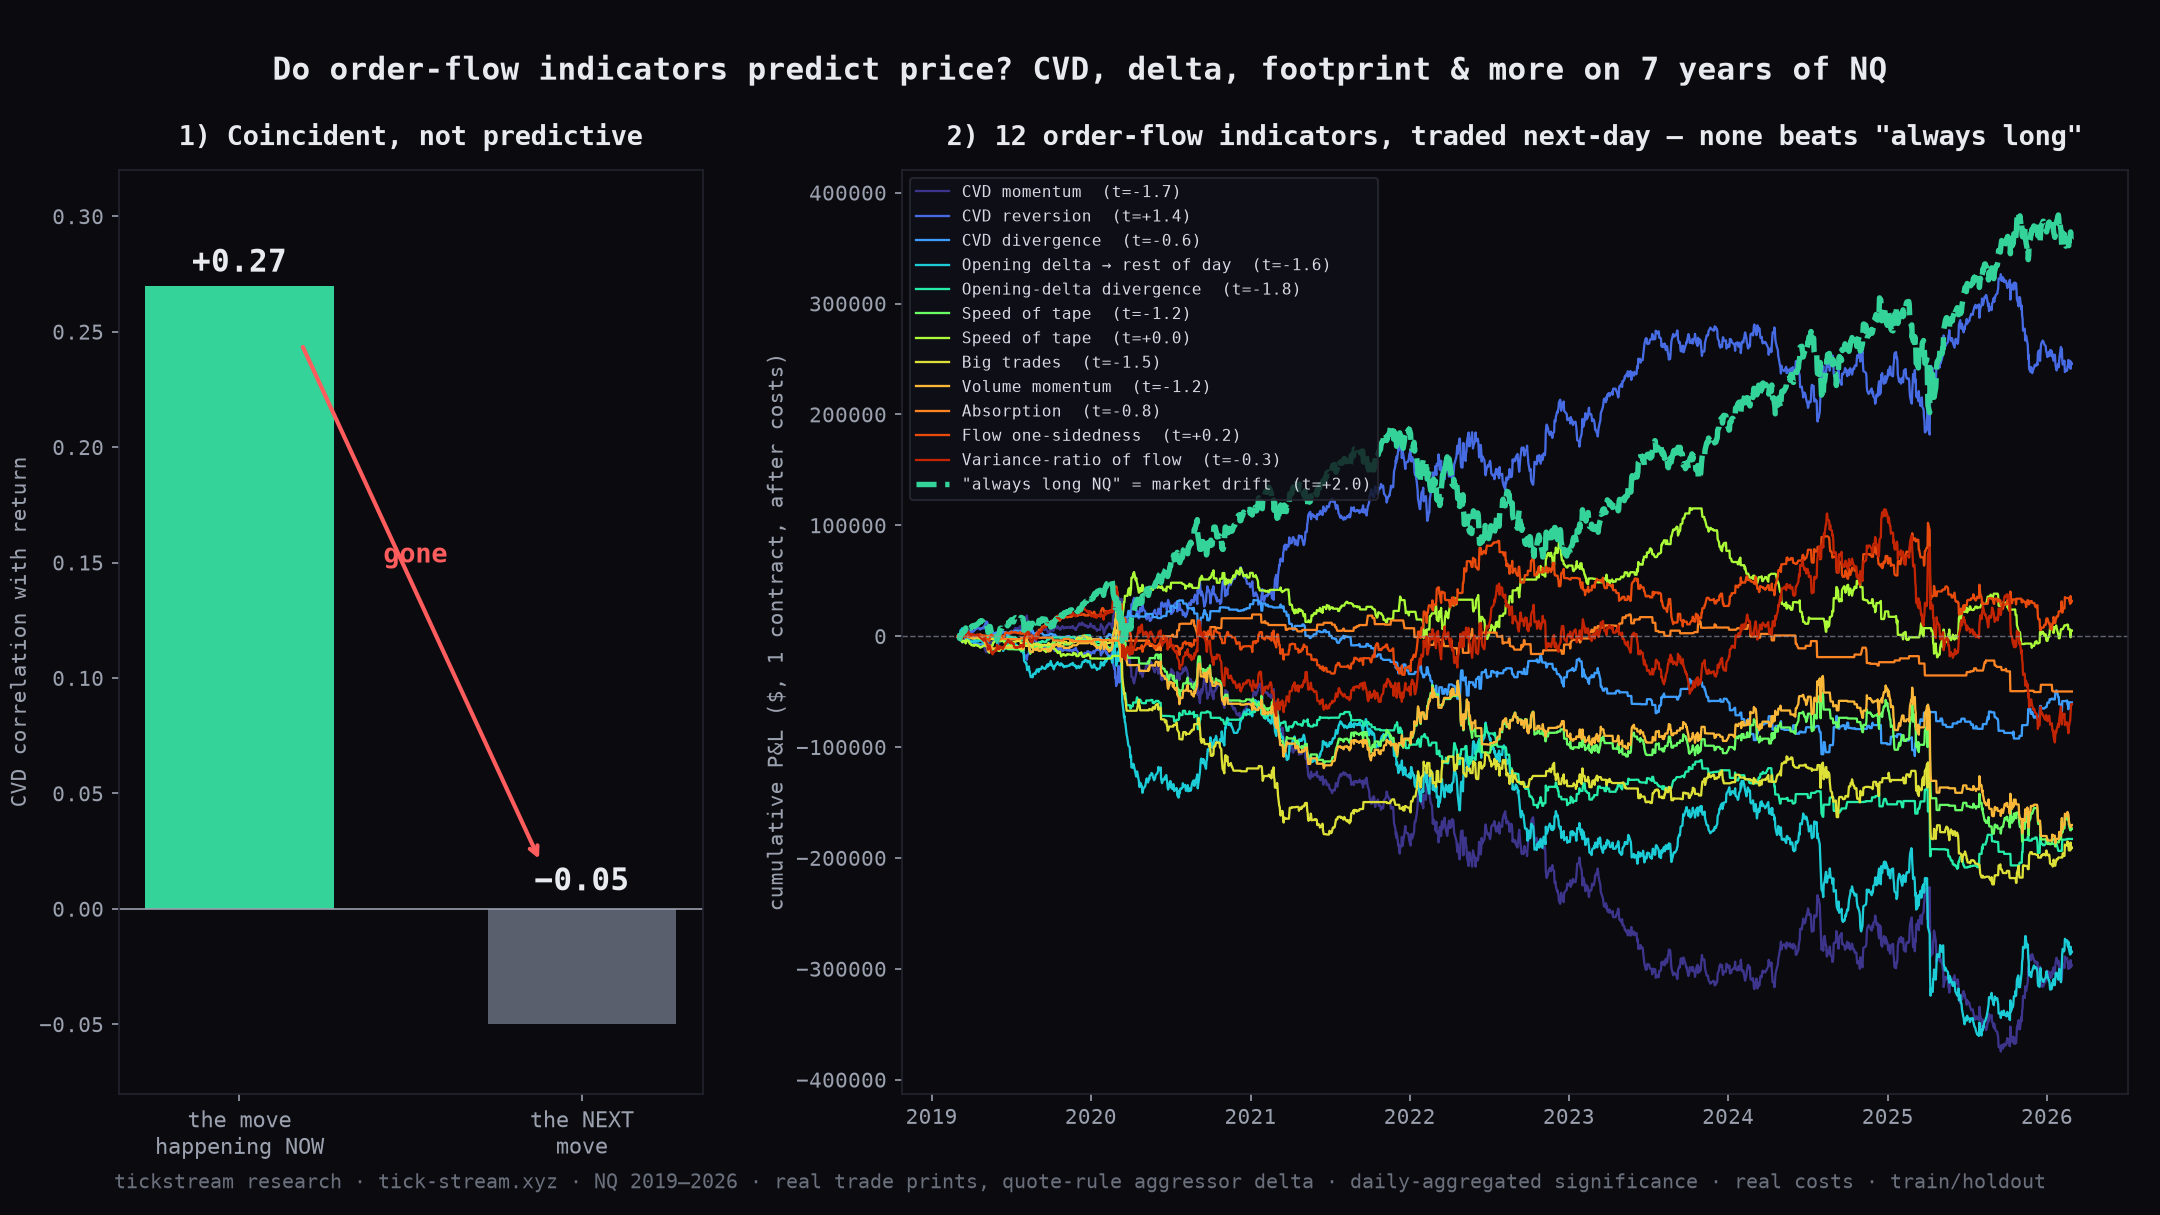
Cumulative volume delta — a running tally of which side was the aggressor — correlates +0.27 with the move happening right now (rank correlation +0.52). That sounds great until you ask the only question that matters for trading: does it predict the next move? Its correlation with the next day’s return is −0.05. Not smaller — gone, with the wrong sign. That gap is the whole story, and it’s exactly what you’d expect from a quantity that is generated by the move rather than leading it.
What we tested
We took a dozen of the order-flow signals retail traders actually trade and ran each one as a mechanical strategy on NQ, 2019–2026 — CVD momentum and reversion, CVD divergence, opening delta and its divergence, speed of tape (trade intensity), big trades (large average size), volume momentum, absorption (big volume, small range), flow one-sidedness, the variance-ratio of signed flow, and all of them combined. Everything uses real trade prints with quote-rule aggressor (each trade classified against the prevailing bid/ask — trade at the ask is a buy, at the bid a sell), with daily-aggregated significance, $4.50 commission + 2-tick slippage, and a 2019–2023 train / 2024–2026 holdout split.
The result: nothing predicts
A quick word on t (the t-statistic), since it’s the number that decides everything below. It measures how far a result sits above zero relative to its own noise — how many standard errors. Roughly: |t| above 2 means there’s less than a ~5% chance the result is luck (a real edge); between −2 and +2 you can’t tell it apart from randomness (no edge); negative means it lost. So t = +0.06 is a coin flip, and t = −4.0 is a reliable loser.
Follow the delta (CVD momentum) ......  t = −1.66     loses
Fade the delta .......................  t = +1.37     train-only, dies OOS
Opening delta → rest of day ..........  t = −1.59     loses
Opening-delta divergence .............  t = −1.75     loses
CVD divergence .......................  t = −0.65     loses
Speed of tape (fast → continue) ......  t = −1.24     loses
Big trades (large size → follow) .....  t = −1.50     loses
Volume momentum ......................  t = −1.22     loses
Absorption (big vol, small range) ....  t = −0.82     flips sign out-of-sample
Flow one-sidedness ...................  t = +0.24     noise
Variance-ratio of flow ...............  t = −0.34     noise
All order-flow signals combined ......  t = −0.97     loses
Twelve signals, not one reaches the |t| > 2 bar you need to claim an edge, not one is positive in both the train and the holdout, and not one beats just being long (t = +2.0, the green dashed line). Nine of the twelve lose outright; the one positive-looking line (fading the delta) exists only in the training years. Combining them doesn’t help — stacking a pile of zero-edge signals just gives you a more expensive zero. On the chart, the order-flow lines are a flat, bleeding tangle; the only thing that climbs is “always long,” and that’s not a strategy, it’s the market going up.
The mirage: the “edge” that was just “always long”
To be thorough we tested one more, more academic, order-flow metric: flow persistence — the long-memory of signed volume within the day (does aggressive buying beget more aggressive buying?). Trading its sign returned a t-stat of +1.65 and +$295k — the best-looking order-flow line on the chart.
Except. Flow persistence is positive 89% of the time (order flow has well-known long memory). So “trade the sign of flow persistence” is, in practice, “be long NQ nine days out of ten.” And sure enough, always long over the same period returns t = +2.00 and +$357k — more, with less machinery. When we strip the drift out and trade flow persistence against its own rolling median, the edge is t = +0.40: noise. The one order-flow number that looked predictive was the index’s upward drift wearing an order-flow costume — the same trap as ICT’s “OTE,” which works only because it’s trend-pullback, not Fibonacci.
”But the real money is in scalping the tape”
If next-day signals are dead, the order-flow crowd’s fallback is scalping: read the aggressive flow on the DOM, jump in with the “smart money,” take a few ticks. We tested exactly that, on ~58 million real NQ trade prints across 140 sessions spanning every regime — at each trade, follow the trailing signed volume of the last 20 trades (who’s lifting offers vs hitting bids) and measure the forward move over the next 5 to 100 trades.
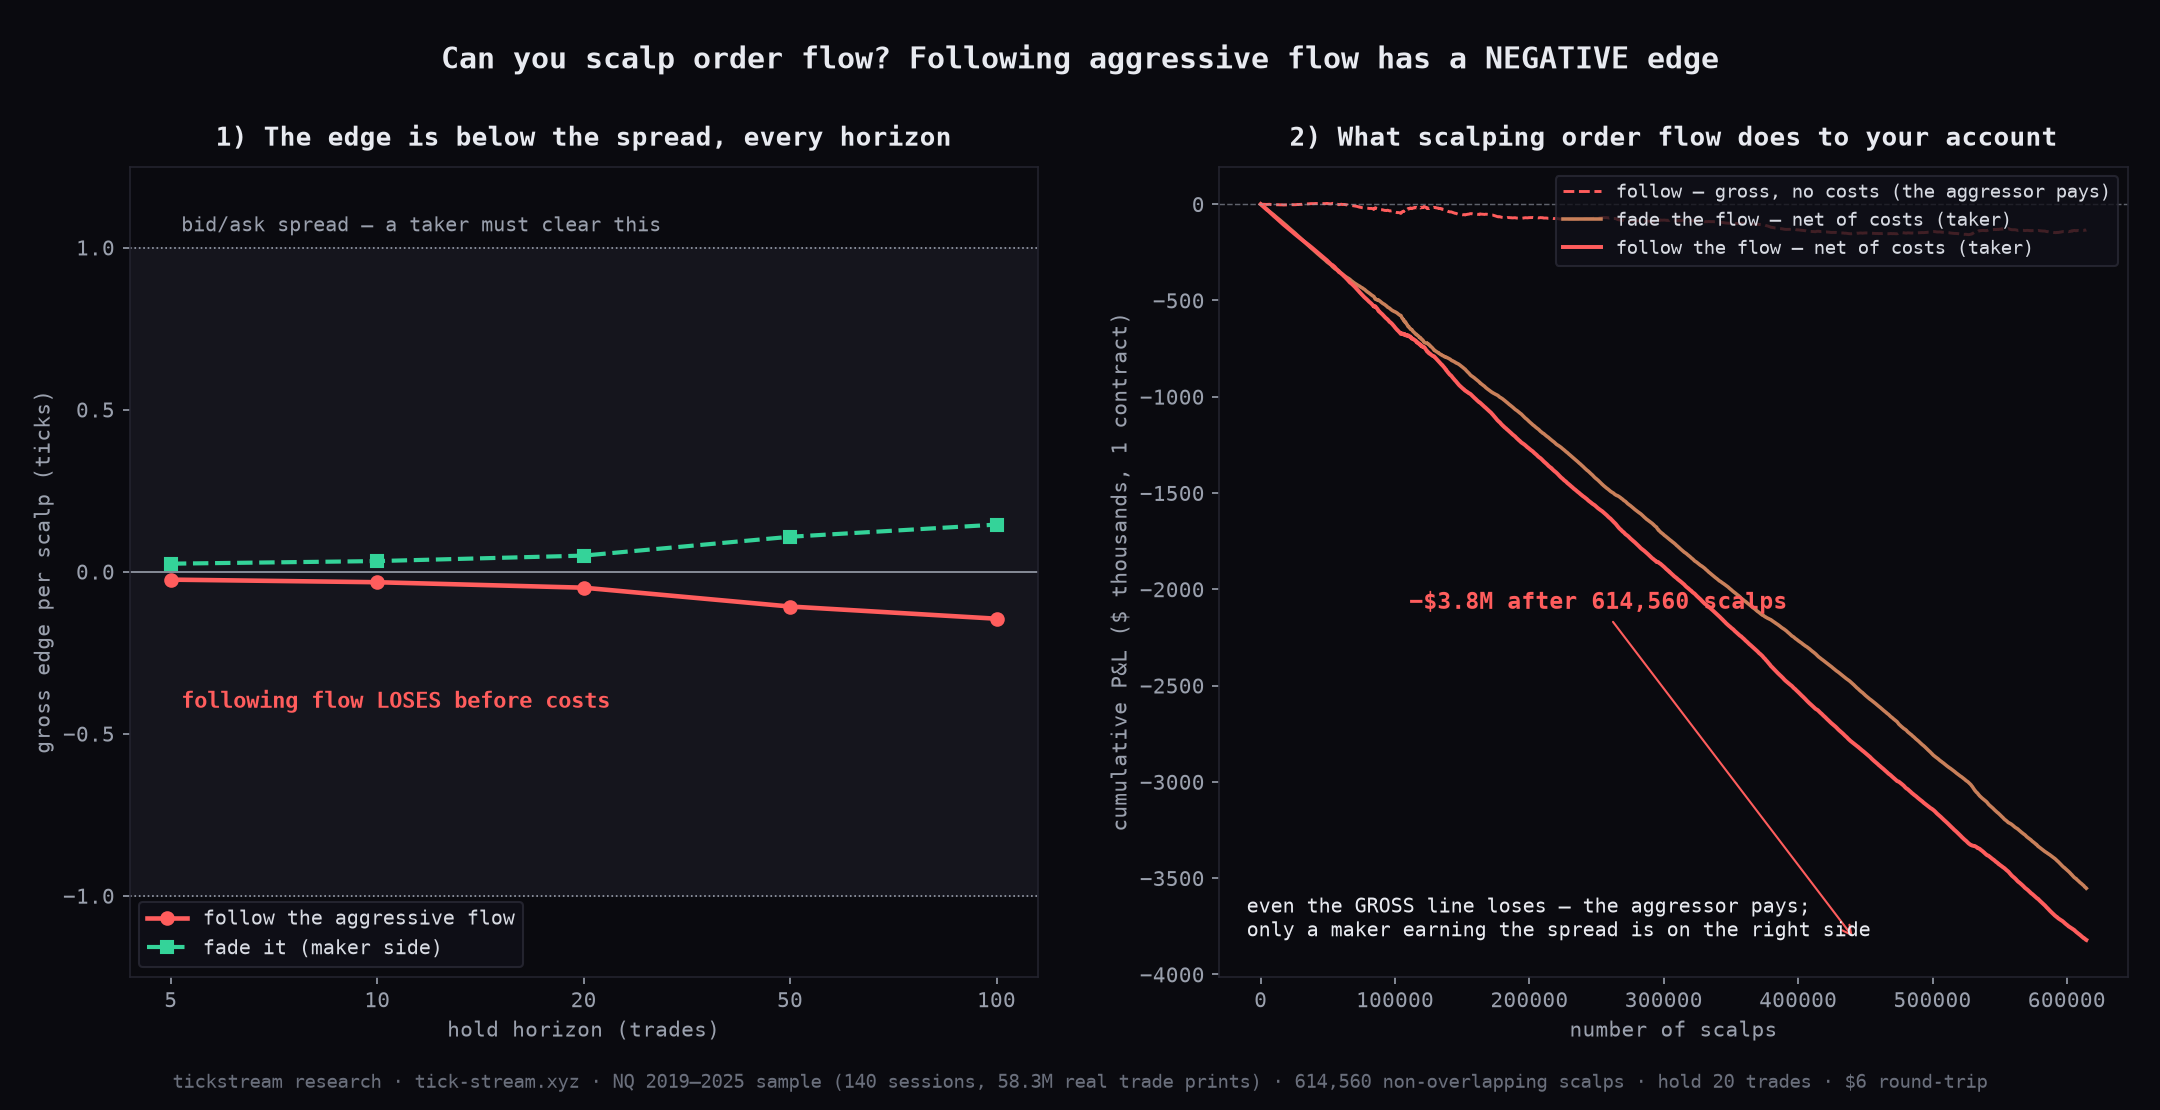
Following the aggressive flow doesn’t just fail to beat costs — it has a negative gross edge at every horizon, before a single cent of cost: −0.03 ticks five trades out, widening to −0.15 ticks at a hundred. The aggressor is the one paying: they lift the offer, and on average price drifts slightly back against them. In a simulation of 614,560 non-overlapping scalps, following the flow lost money gross — and net of a cheap $6 round-trip it lost $3.8M. The profitable side of that trade is fading the flow — up to +0.15 ticks — which is the side the passive market-maker is on.
But +0.15 ticks is a fraction of the bid/ask spread. The economics of one scalp are unforgiving: a best-case +0.15-tick edge, minus ~1 tick to cross the spread, minus commission, nets about −1 tick — a guaranteed loss for anyone clicking buy or sell. The same is true of order-book imbalance (resting bid vs ask size): it genuinely predicts a sub-tick drift, robustly, in every regime — and it’s just as sub-spread. Order-flow scalping is a transfer from the impatient (takers, who cross the spread) to the patient (makers, who earn it). The courses are selling you the losing seat.
Why order flow looks so good on a chart
Two reasons, and they’re the same two that make every hindsight method look like genius. First, the delta is the footprint of the move — on a footprint chart the big delta and the big candle line up perfectly because one is the other; that’s not prediction, it’s an identity. Second, selection: you remember the absorption that preceded the reversal and forget the ten that didn’t. Mark up enough screenshots after the fact and a coincident quantity starts to look like a leading one.
This isn’t to say order flow is worthless. It’s genuinely useful for execution — reading liquidity, judging absorption at a level you’re already trading, being patient with a fill. That’s real value. It is just not a directional crystal ball, which is precisely what it’s sold as. The durable edges we trade live don’t come from reading the tape’s direction — you can see them on our public track record.
Update: we let a machine try every combination
A fair follow-up we got more than once: sure, each indicator alone is weak — but what if you combine them the right way? Our original battery included a simple combined signal (t = +0.70, empty in the training years). So we ran the definitive version: a gradient-boosted model given all thirteen order-flow features at once — delta, CVD slope, one-sidedness, delta flips, absorption, speed of tape, big-trade concentration, exhaustion prints at the extremes, and more — free to find any combination and any interaction, trained walk-forward (refit yearly, always on past data only) and evaluated on 26,873 out-of-sample 15-minute windows across 2021–2026.
The result, in one number: out-of-sample AUC 0.5051 — where 0.50 is a coin flip, and where the same model trained on shuffled labels (a pure-noise placebo) scores 0.5007. The genuine information content of every order-flow combination a modern model can find, over noise: about half a percent of AUC. Traded with costs it loses at every meaningful confidence threshold (down to −$193k); the strictest threshold scrapes +$3k at t = +0.15 — indistinguishable from zero — while simply being long over the same windows made +$49k.
So the combination question is closed too: mixing twelve coincident indicators produces a coincident mixture. No weighting scheme rescues information that isn’t there.
And for completeness we also did it the caveman way: all 8,191 possible subsets of the thirteen signals, brute-forced as majority votes, ranked on 2019–2023, winners tested once on 2024–2026. The best combination of the training years doesn’t even reach significance in-sample anymore (t = +1.62), and on the holdout it scores t = +0.84 — the top-50 training winners average a holdout t of +0.40, all noise. Search 8,191 combinations and the best in-sample number will always look like something; tested once out-of-sample, none of it clears the bar.
The bottom line
On seven years of real NQ trade prints: order flow is coincident, not predictive (CVD correlates +0.27 with the current move, −0.05 with the next). Every popular order-flow signal — follow-the-delta, opening delta, divergence, footprint, combined — is flat or losing after costs, none significant. The one metric that looked like an edge was just “always long” in disguise. And the one signal that genuinely predicts, order-book imbalance, lives entirely beneath the spread where only a market-maker can reach it. If a course is selling you order flow as a way to know which way price goes next, ask to see it beat “always long,” out-of-sample, after costs.
Methodology: NQ continuous front-month, real trade prints (aggressor side inferred with the quote rule against the prevailing bid/ask, tick rule inside the spread) aggregated to 1-minute and daily, 2019–2026. Twelve order-flow signals (CVD momentum/reversion, CVD divergence, opening delta + divergence, speed-of-tape, big-trades/average size, volume, absorption, flow one-sidedness, variance-ratio of signed flow, combined) traded next-period, one contract, $4.50 commission + 2-tick slippage, daily-aggregated significance, 2019–2023 train / 2024–2026 holdout. Scalping tested at the tick level on ~58M trade prints (140 sessions across 7 regime-spanning months): follow trailing 20-trade signed volume, forward move over 5–100 trades vs round-trip cost. Order-book imbalance assessed on raw tick/quote data in earlier work.
Correction note (2026-07-03): the first version of this article computed delta and CVD from a mis-read field in our raw tape (bid/ask quote updates counted as signed trades — effectively inverted book-imbalance, not trade delta). We rebuilt every feature from actual trade prints and re-ran the full battery, the ML combination, the brute-force subset search and the scalp test. The verdict is unchanged and mostly stronger: order flow remains coincident, nothing clears |t| > 2 out-of-sample, and following the aggressor still pays. All numbers on this page are the corrected ones.
Frequently asked questions
Do order-flow indicators actually work for predicting price?
Not on NQ, in our testing. Order flow (cumulative volume delta, per-bar delta, footprint imbalance) is coincident, not predictive: cumulative delta correlates +0.27 with the move that's happening right now, but −0.05 with the next move. Every tradeable order-flow signal we backtested over seven years — follow-the-delta, opening-delta-to-rest-of-day, CVD divergence, footprint flow-efficiency, and all of them combined — came in flat or losing after costs, none statistically significant. Order flow tells you what just happened, not what's next.
Is cumulative volume delta (CVD) a good trading signal?
As a directional predictor, no. CVD is essentially a running tally of which side was the aggressor, so it tracks the current move almost by construction (correlation +0.27 same-bar). But trading it — going long when CVD is rising, short when falling — lost $297k over seven years of NQ (t = −1.66). Fading it made money only in the train years (t = +2.0 pre-2024) and died to t = −0.1 out-of-sample. CVD describes order flow that has already printed; by the time you see it, the move it's measuring has already happened.
Does order-book imbalance (bid/ask size) predict price?
Yes, but it's untradeable for a retail trader. On raw tick data, order-book imbalance has a real, robust micro-edge — more size on the bid genuinely precedes a small upward drift, in every regime. But the edge is sub-spread: the median move is a fraction of a tick (roughly 0.2–0.75 ticks) against a ~4-tick bid/ask spread. Only an HFT market-maker posting passive quotes can harvest that; a retail trader crossing the spread loses the whole edge to transaction costs.
Can you scalp using order flow / the tape?
Not as a taker. We tested following the aggressive flow on ~58 million real NQ trade prints: it has a negative gross edge at every horizon (−0.03 ticks at 5 trades, growing to −0.15 ticks at 100), before costs — the aggressor pays, because they lift the offer and price drifts slightly back against them. The profitable side is fading the flow (the market-maker's side, up to +0.15 ticks), but that is a fraction of the bid/ask spread. A best-case +0.15-tick edge minus ~1 tick to cross the spread minus commission nets roughly −1 tick: a guaranteed loss for anyone clicking buy or sell. Order-flow scalping pays the patient market-maker, not the impatient retail scalper.
Why does order flow look so predictive on a chart?
Because you're seeing it after the fact. On a footprint or CVD chart, the big delta and the move line up perfectly — but that's because the delta is the footprint of the move, generated by it. The honest test is whether today's order flow predicts tomorrow's direction on data you haven't seen, and it doesn't. The single order-flow metric that came close in our tests (flow persistence) turned out to be positive ~90% of the time, so trading its sign was mostly 'always be long NQ' — the index's drift, not an order-flow signal.
Is order flow useless then?
Not useless — just not a source of directional alpha on its own. Order flow is genuinely informative about liquidity and execution: where size is resting, how a level is being absorbed, when to be patient with a fill. That's valuable for *how* you execute. It is not a reliable answer to *which way* price goes next, which is what most order-flow courses sell it as.