The One Dip-Buying Rule That Was Positive Every Single Year: RSI-2 on NQ
We publish a lot of debunks, so here's the other kind of result. A reader asked for a 'many small wins' strategy, and we swept the whole mean-reversion family on seven years of NQ daily data. One classic rule survived everything we threw at it: buy the close when 2-period RSI drops below 10, exit the next close. 60% win rate, profit factor 2.13, positive every year from 2019 through 2026 — including the 2022 bear. Here's the full test, including the parts that DON'T work.
Most of what we publish is debunks, because most of what we test dies. This one didn’t — and the way it survived is worth as much as the rule itself.
A reader asked for a “many small wins” strategy: high win rate, frequent modest profits. That request usually leads somewhere bad (win-rate cosmetics hiding tail risk — see our opening-range and IB60 write-ups). But it prompted a full sweep of the short-term mean-reversion family on seven years of NQ daily data: IBS variants, RSI lengths from 2 to 14, buy-thresholds, exit horizons, long and short, all with real costs ($4.50 + slippage) and a train/holdout split.
One rule beat everything, and it’s almost embarrassingly old: Larry Connors’ RSI-2.
The rule
- Compute a 2-period RSI on daily closes (yes, two).
- If it closes below 10 → buy the close.
- Exit at the next day’s close. That’s it. One contract, in the market ~10% of days.
The numbers (191 trades, 2019–2026, after costs)
| Metric | RSI-2 < 10 | Buy & hold NQ |
|---|---|---|
| Win rate | 60% | — |
| Avg per trade | +$1,293 | (+$176 on an average day) |
| Profit factor | 2.13 | — |
| Sharpe | 1.20 | 0.68 |
| Max drawdown | $29k | $121k |
| Net | $247k | $357k |
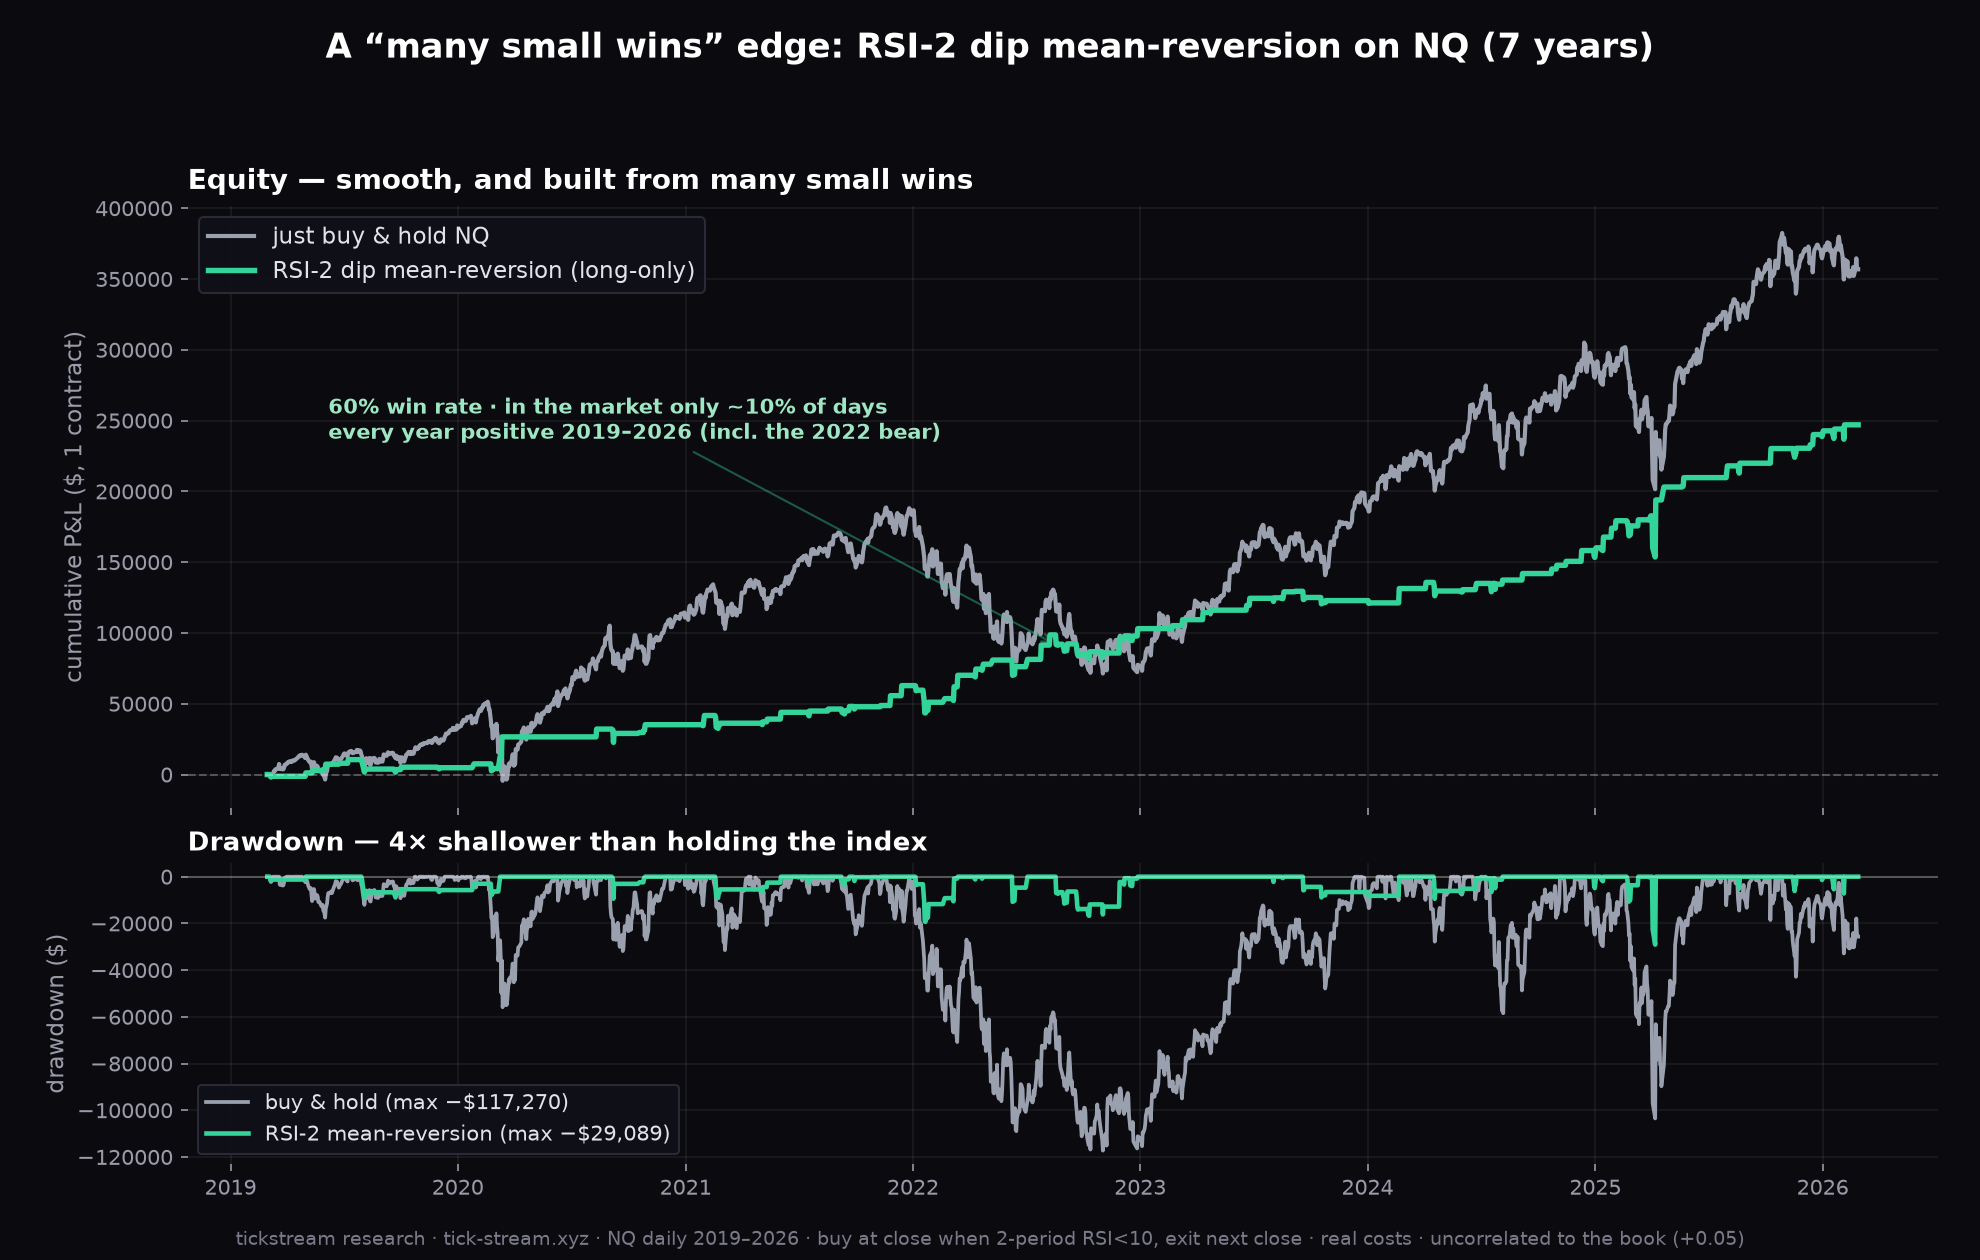
Buy-and-hold made more total dollars — with four times the drawdown and full-time exposure. Per unit of risk and per day of exposure, the dip rule is the far stronger machine. The average oversold-day forward return (+$1,293) is seven times the average day (+$176): the timing itself carries the edge, not just market drift.
The tests that make us believe it
A good result has to survive attempts to kill it. This one took everything:
- Every calendar year positive, 2019–2026 — including 2020’s crash (+$30k) and, critically, the 2022 bear (+$40k, Sharpe 1.22). Pure long beta lost badly in 2022; this didn’t. It buys panic, sells the stabilization, and goes back to cash.
- Parameter robustness. Thresholds 10 / 12 / 15 all land at Sharpe 1.20–1.27. No knife edges. (Below 5 the signal thins out — too few trades.)
- Train/holdout stable (Sharpe 1.20 train, 1.35 holdout).
- A sibling confirms the effect. IBS < 0.2 (close near the day’s low) — a different formula for the same “panicky close” — also works (Sharpe ~1.0, robust in both halves). When two independent definitions of the same idea both survive, the effect is real, not the formula.
- The short side fails. Selling overbought (RSI-2 high) loses money in every variant. NQ drifts up; overbought resolves by continuation. The edge is long-only, buying fear. This asymmetry is also what tells you it isn’t a data-mining fluke — it matches the market’s known structure.
For calibration: t-wise this clears our bar comfortably; the same battery killed dozens of candidates before it (day-of-week effects, VWAP reversion, value-area fades, order-flow triggers — the graveyard is most of this blog).
The honest caveats
- It’s long-only NQ — there’s equity-crash exposure between the entry close and the exit close. The next-day exit caps it (worst drawdown $29k in a window containing two bears), but a true overnight gap-catastrophe would hit it. The 200-day-MA-filtered version (Sharpe 1.09, max drawdown $10.7k) trades some return for a much cleaner tail.
- It’s public. This is a two-decade-old Connors rule. We don’t think that kills it — the edge is behavioral (panic selling into a structurally rising index), and behavior hasn’t been arbitraged away — but expect the edge to be modest and to have flat stretches.
- Period-specific. 2019–2026 contains two bears and three regimes, which is why we trust it — but it’s still one index, one era.
Why we publish a winner
Full transparency: we run this exact logic live as the mean-reversion sleeve of our own strategy book — it’s the one we call Undertow, and its live paper track record is public on our algos page next to the backtest. Publishing the rule costs us nothing (it’s been public since before the GFC); what we’re adding is the verification — the sweep, the costs, the holdout, the failed variants — that separates a real edge from the 78%-win-rate mirages we spend the rest of this blog dismantling.
Methodology: NQ daily closes 2019–2026, RSI-2 computed on closes (Wilder smoothing), entries at the signal close, exits next close, 1 contract, $4.50 commission + 2 ticks slippage per round trip, train/holdout split, full parameter sweep documented. Correlation to our other live sleeves: ~+0.05 (independent).
Frequently asked questions
Does the RSI-2 strategy actually work?
On NQ daily data, 2019–2026, yes — it was the strongest survivor of our entire mean-reversion sweep. Buying the close when 2-period RSI < 10 and exiting the next close produced a 60% win rate, +$1,293 average per trade after real costs, profit factor 2.13 and a Sharpe of 1.20 across 191 trades — with every calendar year positive, including 2020's crash and the 2022 bear. It's a classic Larry Connors rule, and on this market and period, it holds.
Isn't dip-buying on NQ just long equity beta?
That was our first suspicion, and 2022 is the answer: pure long exposure lost heavily that year, while the RSI-2 rule made +$40k (Sharpe 1.22) — buying panicky oversold closes and selling the next-day stabilization works in bear markets too. It also beats buy-and-hold on risk everywhere: Sharpe 1.20 vs 0.68, and a maximum drawdown four times smaller ($29k vs $121k), while being in the market only about 10% of days.
What are the exact rules?
Compute a 2-period RSI on daily closes. If it closes below 10, buy at that close; exit at the next day's close. One contract, no leverage games. The threshold isn't a knife edge — 10, 12 and 15 all produce Sharpe 1.20–1.27, which is what parameter robustness should look like. A 200-day moving-average filter (only take signals above it) lowers Sharpe slightly to 1.09 but cuts the max drawdown to $10.7k, a cleaner risk profile some will prefer.
Does the short side work too — selling overbought rips?
No, and this is the important asymmetry: every short-side variant we tested (RSI-2 high, IBS high, sell-the-rip) lost money. NQ's structural drift is up, so overbought conditions resolve by continuation more often than reversal. The mean-reversion edge on this index is long-only, buying fear — not shorting greed. Any symmetric version gives back the long side's profits.
Why publish a strategy that works?
Because it's not a secret — RSI-2 is a Larry Connors classic that's been public for nearly two decades, and the edge is behavioral (panic selling into a structurally rising index), which doesn't stop working because people know about it. We run this exact logic live as one strategy in our own book (the mean-reversion sleeve we call Undertow), with its live paper track record published. The value isn't the rule; it's verifying it survives honest testing — most published strategies don't.