Can You Tell If Today Is a Trend Day or a Reversion Day? We Tested It on 7 Years of NQ
Every trading course sells a 'regime filter' — know whether the market is trending or ranging, then trade breakout or mean-reversion accordingly. We tested it properly on 7 years of NQ futures: do breakout days come in streaks, and can any indicator tell you which style pays next? The regime is real but it's not forecastable. The data, with a placebo test.
Open any trading course and you’ll meet the regime filter. “First, identify the market regime. Is it trending or ranging? In a trending regime you trade breakouts; in a ranging regime you fade the extremes. Get the regime right and everything else follows.” It sounds like the most sensible advice in trading. So we tested it the only way that settles anything: on seven years of NQ futures, with a shuffled-data placebo to keep ourselves honest.
The verdict: the regime is real, but it is not forecastable. You cannot tell in advance whether today will be a trend day or a reversion day, and you cannot tell which style will pay next week. Here’s the data.
How we labelled each day
To ask “is this a trend day or a reversion day?” you need an objective definition. We used two standard ingredients:
- Close location — where in the day’s range did it close? Near an extreme (top or bottom) means the day picked a direction and held it.
- Directional body — how much of the range was the open-to-close move versus rotation?
A trend / breakout day closes near an extreme with a directional body. A balance / reversion day closes back in the middle — it rotated and came home. We labelled all ~1,900 days, then went looking for structure.
Finding 1: breakout days do not come in streaks
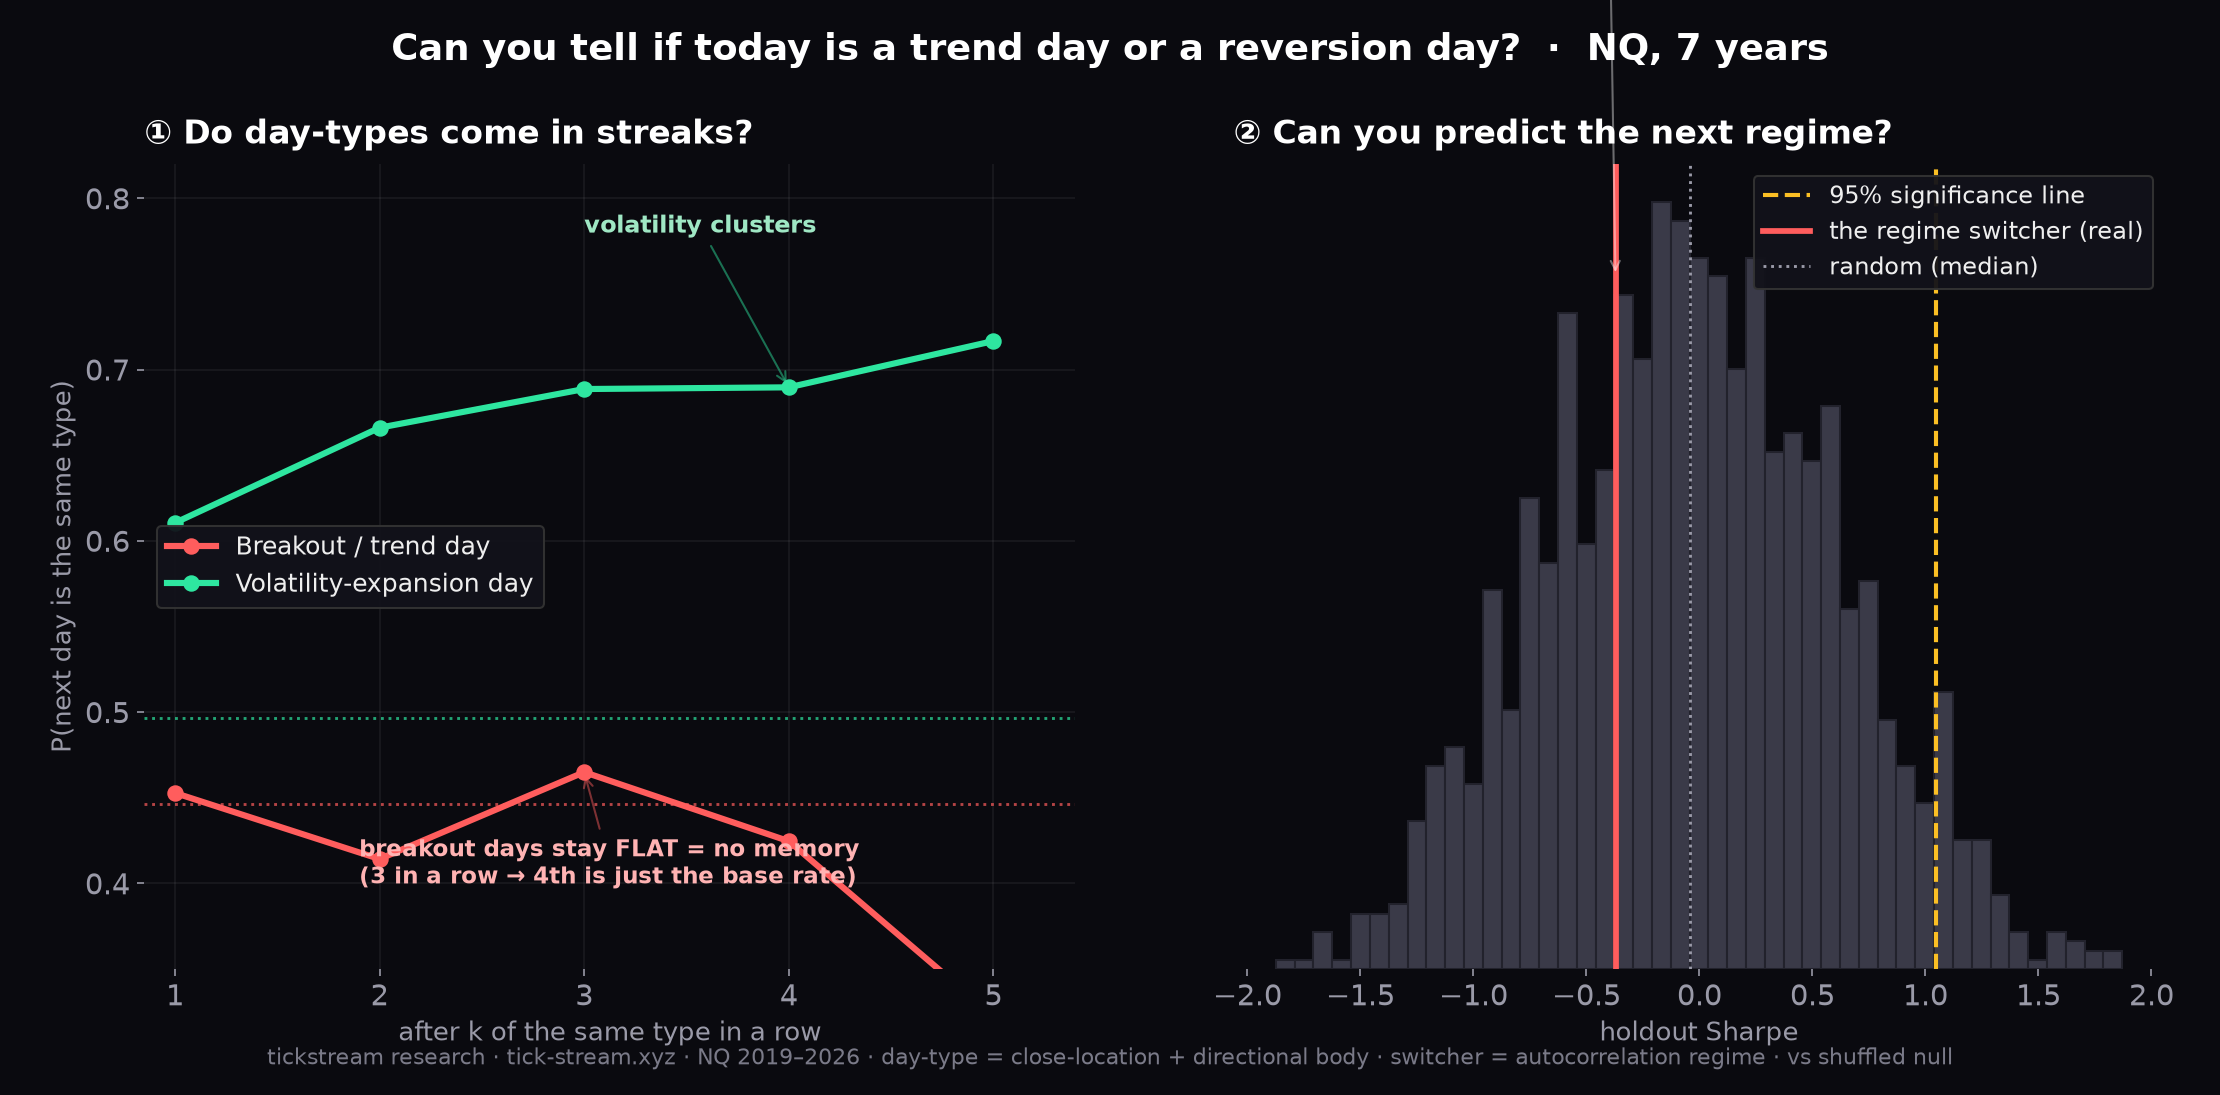
The intuitive belief is that trend days cluster — that a few breakout days in a row signal a “trending regime” you can lean into. They don’t.
The directional character of a day has no memory. The lag-1 autocorrelation of the trend-day series is +0.01 — indistinguishable from zero, and right in the middle of what you get by shuffling the days randomly. The conditional probability tells the same story (the red line above): after one trend day the next is a trend day 45% of the time; after two in a row, 41%; after three, 46%; after four, 42%. That flat line is the base rate. Three breakout days in a row tells you exactly nothing about the fourth.
Finding 2: what actually clusters is volatility — not direction
There is a powerful clustering effect on NQ — but it’s in the wrong variable for a regime filter. Range-expansion days cluster hard (the green line). After an expansion day, the next is an expansion day 61% of the time; after two, 67%; after three or four, ~69–72% — far above the 50% base rate, and far outside anything a shuffled series produces (autocorrelation +0.23, off the chart of the null distribution).
This is volatility clustering, one of the most reliable facts in markets. But notice what it tells you: that moves will stay large, not which direction they’ll go. It’s a statement about magnitude. You can build a risk model on it — you cannot build a trend-vs-reversion filter on it.
Finding 3: you cannot predict which style pays next
If day-type doesn’t streak, maybe a smarter indicator can still tell you whether momentum or mean-reversion is currently “in regime.” This is the premise of every regime-switching system. We tested the textbook version: a switcher driven by the rolling autocorrelation of returns (positive autocorrelation → trending → trade momentum; negative → choppy → trade reversion), and validated it out-of-sample against a placebo — 1,500 random regime sequences with the same statistics.
The result is the right panel above. The real switcher’s out-of-sample Sharpe (the red line) sits inside the random cloud, at the 30th percentile — worse than a coin flip — and nowhere near the 95% significance line. We tried two more indicators, trend-efficiency and a recent-winner rule; both came in around the 1st–2nd percentile, actively worse than random. None of them crosses the line that would let you call it skill.
Why the regime is real but unforecastable
Here’s the subtle part, and it’s important. The styles genuinely do alternate. In our sample, weekly momentum was profitable through 2019–2023 and lost in 2024–2026, while mean-reversion did the exact opposite — the regimes are real, ex post. The problem is purely one of timing: every indicator is backward-looking, so by the time it has enough data to “confirm” you’re in a momentum regime, the regime has already begun to flip. The recent-winner rule fails for exactly this reason — it keeps trading the style that just worked, right as the market hands the baton to the other one.
This is the same wall we keep hitting: structure that’s obvious in hindsight and untradeable in advance. A regime you can only name after it’s over is not a filter you can trade.
What regime detection is actually good for
To be clear, regime awareness isn’t worthless — it’s just misused. The one robust, repeatable pattern (volatility clustering) has a real application: sizing. Run more risk when volatility is clustering and less when the tape goes quiet. That makes your equity curve smoother; it does not tell you what to trade. The mistake almost every “regime filter” makes is using regime to decide what (breakout vs reversion) instead of how much (risk). The first doesn’t work on NQ. The second does, modestly, and only as risk management.
The durable edges we actually trade don’t depend on calling the regime at all — they’re continuation-based and work across regimes, which is precisely what you’d expect once you accept that you can’t time the switch. You can see them on our live, paper-traded track record.
The bottom line
On seven years of NQ futures: trend and reversion days do not come in streaks, the only thing that clusters is volatility (magnitude, not direction), and no regime indicator we tested can predict which style pays next — the best was worse than a coin flip out-of-sample. The market alternates between momentum and mean-reversion in ways that are real in hindsight and unforecastable in advance. If a course is selling you a regime filter that tells you whether to trade breakouts or fades today, ask to see it beat a placebo on out-of-sample data. It almost certainly can’t.
Methodology: NQ continuous front-month, daily and weekly bars, 2019–2026. Day-type from close-location + directional body; expansion from 60-day median range. Streak/clustering tested against 1,000 shuffled nulls. Regime switcher = sign of rolling return autocorrelation (also trend-efficiency and recent-winner), held next period, real costs, 2019–2023 train / 2024–2026 holdout, benchmarked against 1,500 random-regime placebos.
Frequently asked questions
Can you predict whether today will be a trend day or a reversion day?
Not on NQ, in our testing. We labelled seven years of days as trend/breakout days or balance/reversion days (by where price closed in its range and how directional the move was) and looked for any way to forecast the next one. Breakout days show no memory — three trend days in a row leaves the fourth at exactly the base rate. And every regime-switching indicator we tried (return autocorrelation, trend-efficiency, recent-winner) failed to beat a random coin-flip out-of-sample. The day's character is essentially unpredictable in advance.
Do breakout or trend days come in streaks?
No. The directional character of a day (trend vs balance) has no autocorrelation — it's statistically indistinguishable from random. After one, two, three or four trend days in a row, the probability the next day is also a trend day stays flat at the base rate (~45%). Trend days do not cluster, so you cannot lean on 'we've had three breakout days, so tomorrow is probably another one.'
Does anything cluster in the market then?
Yes — volatility. Range-expansion (big-range) days cluster hard: after an expansion day, the next is an expansion day ~67% of the time, rising with each consecutive one, far above the 50% base rate and far outside what a shuffled series produces. But this is magnitude, not direction. Volatility clustering tells you moves will stay large, not which way they'll go — so it's useful for sizing risk, not for picking trend vs reversion.
Do regime-switching strategies work?
Not as a way to time trend vs reversion on NQ. The styles genuinely alternate — momentum paid in some multi-year stretches, mean-reversion in others — but the switch is not forecastable. A textbook autocorrelation-regime switcher landed at the 30th percentile of random switchers out-of-sample (worse than a coin flip), and trend-efficiency and recent-winner versions were worse still. By the time an indicator 'confirms' a regime, the regime is already changing.
So is regime detection useless?
For timing trend vs reversion, yes. For risk, no. The one robust, repeatable pattern is volatility clustering, and its honest use is position sizing — run more risk when volatility is clustering and less when it's quiet. That improves the smoothness of returns, not their direction. The mistake retail makes is using 'regime' to decide what to trade (breakout vs reversion) rather than how much.