We Backtested the 'Cash Flow + Momentum' Indicator Ad. Both Halves Are Dead — and What Survives Isn't What's Being Sold.
Find the cash-flow wave, confirm momentum alignment, enter on the confirmation bar. We made the three-step picture mechanical and ran 144 parameter combinations over seven years of Nasdaq futures. 121 of 144 lose money. The best result sits exactly at the noise floor of its own search. Each component is dead on its own — and the one thing that does survive is a long-only drift timer that lost 66,000 dollars in the only bear year, and is strictly beaten by a two-line RSI rule.
The ad shows three panels. Step 1: find a “large, smooth wave of cash flow curving from one direction to the other” — money left the asset, now it’s coming back. Step 2: confirm the “momentum waves” are moving the same way. Step 3: enter on the confirmation of the last momentum wave, and the market “immediately begins to rally.”
The indicator is proprietary and unnamed, which is convenient, because it means the claim can never lose a backtest it never takes. So we tested the mechanic the three steps describe, on something it can’t argue with: seven years of NQ futures, 2.4 million minutes, real costs.
Making the picture mechanical
Nothing in the ad is a rule, so we wrote the closest honest one:
- Cash flow — Chaikin Money Flow: volume weighted by where each bar closes in its range, summed over a window, smoothed. The “wave curving up” becomes: CMF spent time clearly below a negative threshold within the lookback, has now risen two bars in a row, and hasn’t already crossed the positive threshold (the wave is still curving, not already topped).
- Momentum waves — an EMA-spread histogram. “Alignment” becomes: the histogram rising two bars in a row off a local trough.
- Confirmation — enter at the next bar’s open when both are true. Shorts are the exact mirror.
Then the standard battery: one position at a time, $14.50 round trip plus two ticks, next-bar-open fills, train on 2019–2023 with 2024+ held out, and a grid over everything the ad leaves unspecified — timeframe (5/15/60 min), CMF length and smoothing, threshold, EMA pair, holding period. 144 combinations.
What the search found
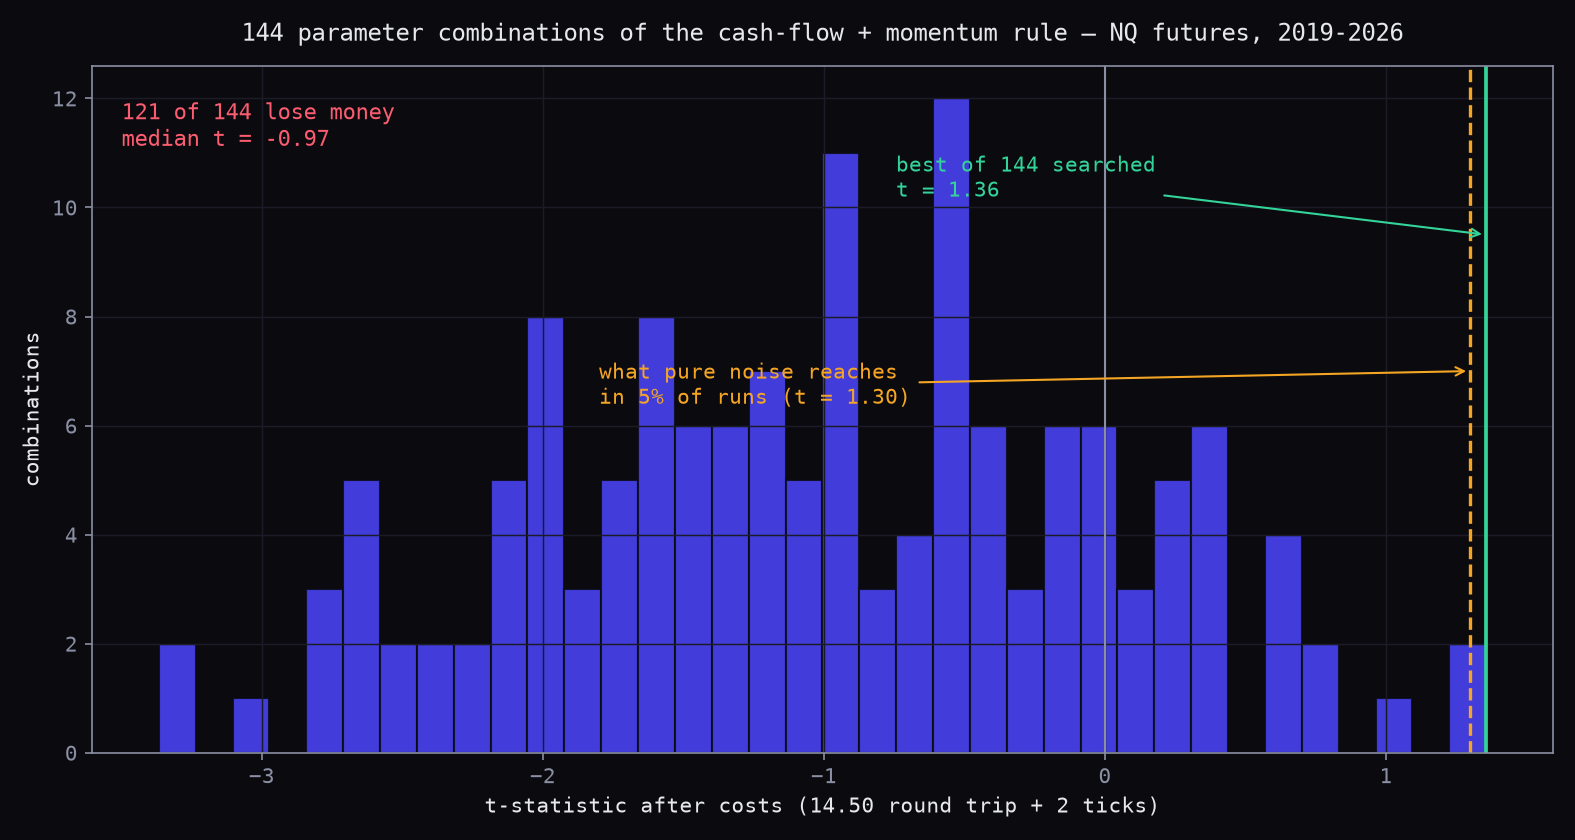
121 of 144 combinations lose money. The median t-statistic is −0.97. The best combination reaches t = 1.36.
Is 1.36 something? We measured the only null that matters: re-run the identical evaluation 100 times on random entry times, matched for trade count, direction mix and the same position spacing. The best-of-search under pure noise reaches t = 1.30 at the 95th percentile. The best real result clears the noise floor of its own search by 0.06. That is not a discovery; that is a search working as designed.
Which step carries the money?
This is the part the ad cannot survive. We ran each component alone, on the best combination’s parameters:
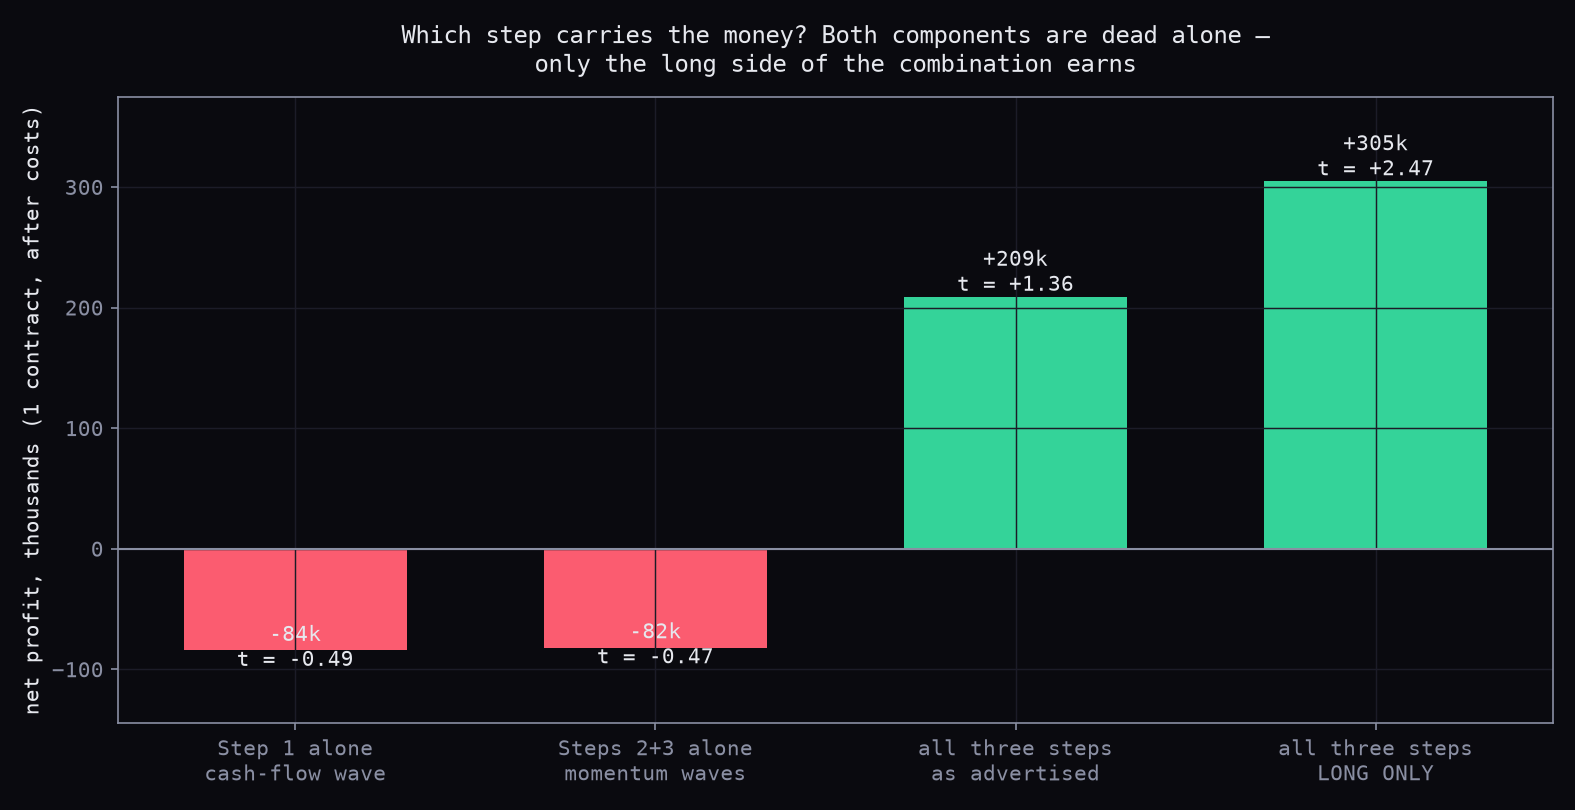
- Step 1 alone (the cash-flow wave): −$84k, t = −0.49. Dead.
- Steps 2+3 alone (momentum alignment + confirmation): −$82k, t = −0.47. Dead.
- All three steps, both directions, as advertised: +$209k — but every dollar and more comes from the long side. The shorts lose −$62k.
- All three steps, long only: +$305k, t = +2.47.
Two dead components whose combination only earns in one direction is a pattern we have now seen across a dozen of these tests, and it always means the same thing: the rule is not finding reversals. It is finding excuses to be long an index that spent seven years going up.
The one honest survivor — and why we still won’t trade it
We don’t gloss the part that works. The long-only combination genuinely times the drift:
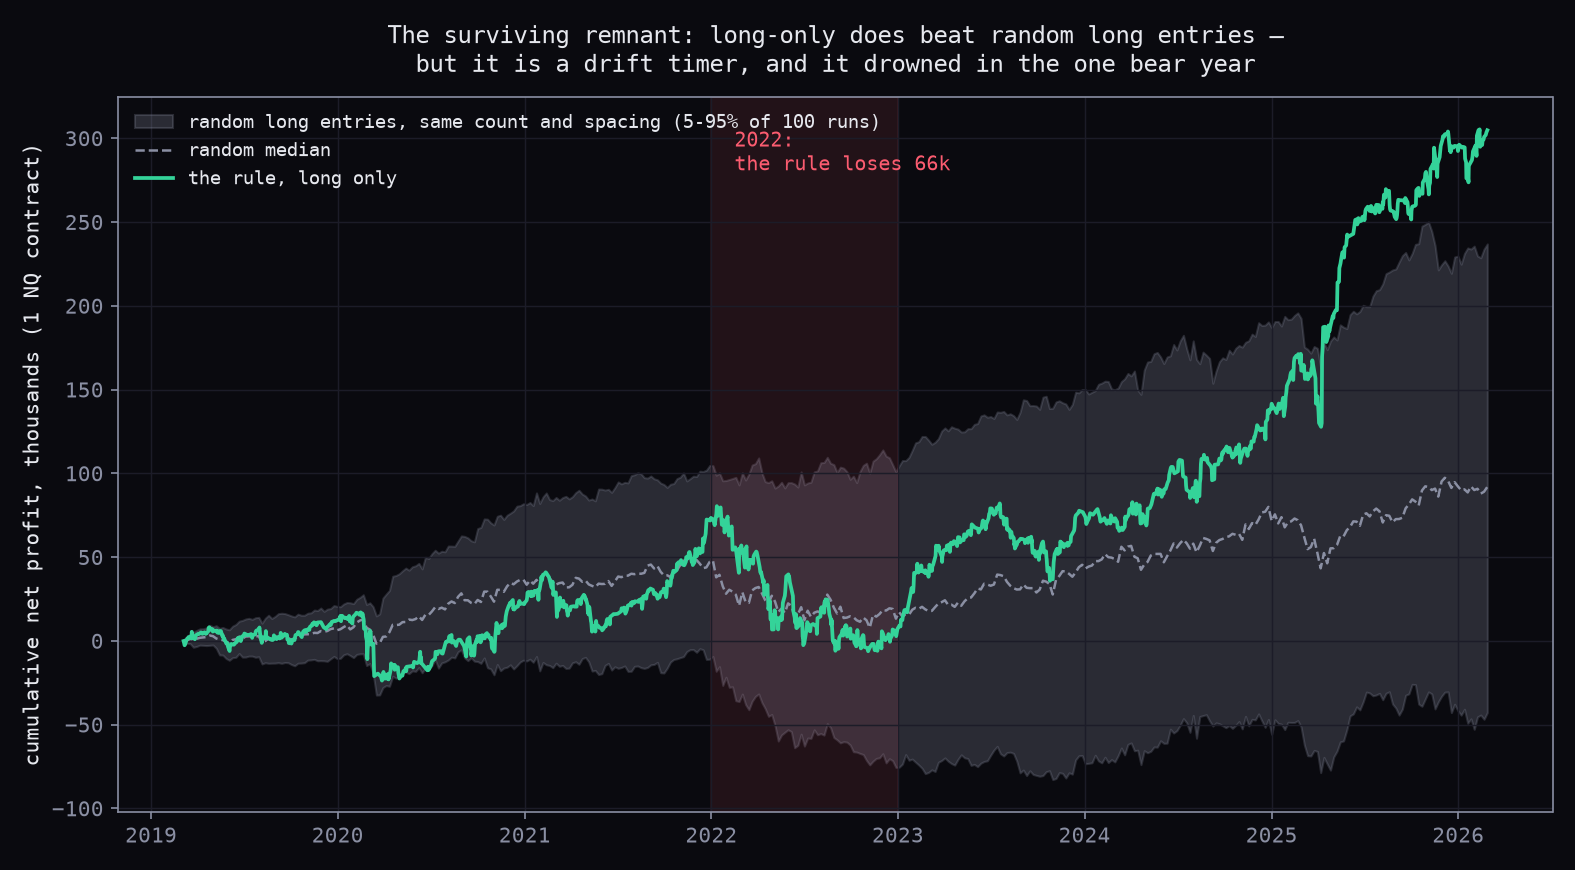
Random long entries with the same trade count and spacing make a median of $71k over the window. The rule makes $305k, and zero of 100 random runs reach it. It holds across the parameter grid too — all 32 neighbouring long-only combinations are profitable — and it doesn’t hang on a handful of lucky trades.
So why is this still a kill?
- 2022, the only bear year in the window, loses $66k. A long-only drift timer with no defence in the one year that tested it is a regime bet, not a strategy.
- It is strictly dominated by something simpler. A two-line RSI(2) dip-buy on the same market times the same drift with a higher Sharpe and a profit in every year of the window — including 2022. When a shiny three-step indicator loses to
RSI(2) < 10, buyon every axis that matters, the three steps were decoration.
What this test adds to the pile
Every one of these vendor-mechanic tests we run lands in the same place, and the pattern is worth stating plainly: combination signals whose components are individually dead almost never find edge — they find the long drift, and sell it back to you as “confirmation.” The confirmation step doesn’t confirm direction. It confirms you’ll only be in the market often enough to collect beta, at the cost of a subscription.
If you want the boring thing that actually survives this battery on NQ: buy pullbacks in an uptrend, hold briefly, and be honest about the fact that you are timing drift. You do not need a proprietary oscillator for that. You need two lines of code and the discipline not to short.
Method notes: NQ futures continuous, March 2019 – February 2026, 1-minute bars aggregated to 5/15/60 min. Entries next bar open, one position at a time, $14.50 commission round trip plus 2 ticks slippage per trade. Train ≤ 2023, holdout 2024+. Nulls: 100 random-timing runs matched on count/side/spacing per configuration examined; inverted-signal control (−$322k, t = −2.09). All code runs against our own recorded tick archive.
Frequently asked questions
Does the cash-flow wave + momentum alignment strategy work?
Not as advertised. Across 144 parameter combinations on seven years of NQ futures, 121 lose money after costs and the median t-statistic is -0.97. The best combination reaches t = 1.36 — and a search of that size over pure noise reaches t = 1.30 in 5% of runs, so the best result is indistinguishable from the search finding it.
Do money-flow indicators like CMF add anything to momentum?
Not directionally, in our test. The cash-flow condition alone lost 84,000 dollars and the momentum condition alone lost 82,000 over seven years. The combination only earns on the long side — which is what timing an index that spent seven years rising looks like, not what a two-sided signal looks like.
So the long side made 305,000 dollars — isn't that an edge?
It beats random long entries with the same trade count and spacing in 100 out of 100 runs, so the timing is real. But it lost 66,000 dollars in 2022, the one bear year in the window, and a plain RSI(2) dip-buy times the same drift with a higher Sharpe and a profit in every single year including 2022. A candidate that is dominated by something simpler you already have is a kill, whatever its null tests say.
How do you decide whether a best-of-N backtest result is real?
Measure the search itself. We re-ran the exact same evaluation 100 times on random entry times matched for trade count, direction mix and position spacing. The 95th percentile of the best t-statistic under that null was 1.30. Any strategy result below the noise floor of its own search is the search, not the strategy.