Does CPI Above 4% Crash the Stock Market? We Tested the Claim on 98 Years — Right as It Fires Again
'The market will go down when year-over-year CPI goes above 4% — in the last 100 years that led the market down 4% in three months and 7% in six.' We rebuilt the test from raw CPI (1913–) and S&P 500 (1927–) data. The claim confuses a state with an event: months WITH high inflation are fine; the first CROSSING above 4% has a real but thin, borderline record — and it just fired in May 2026.
The pitch has everything: forbidden knowledge (“Wall Street doesn’t want you to know, I’m banned from a Bloomberg terminal”), one clean number, and a century of authority: “The market will go down when year-over-year CPI goes above 4% — in the last 100 years that led the market down 4% in the next three months and down 7% in the next six.”
Unlike most macro folklore, this is a fully specified, testable sentence. So we rebuilt it from primary data — CPI from the BLS via FRED (monthly since 1913) and the S&P 500 (daily since 1927) — and checked every reading of the claim. The timing couldn’t be better: US CPI just printed 4.25% year-over-year for May 2026. The signal is live right now.
Reading 1: “CPI above 4%” as a state — simply false
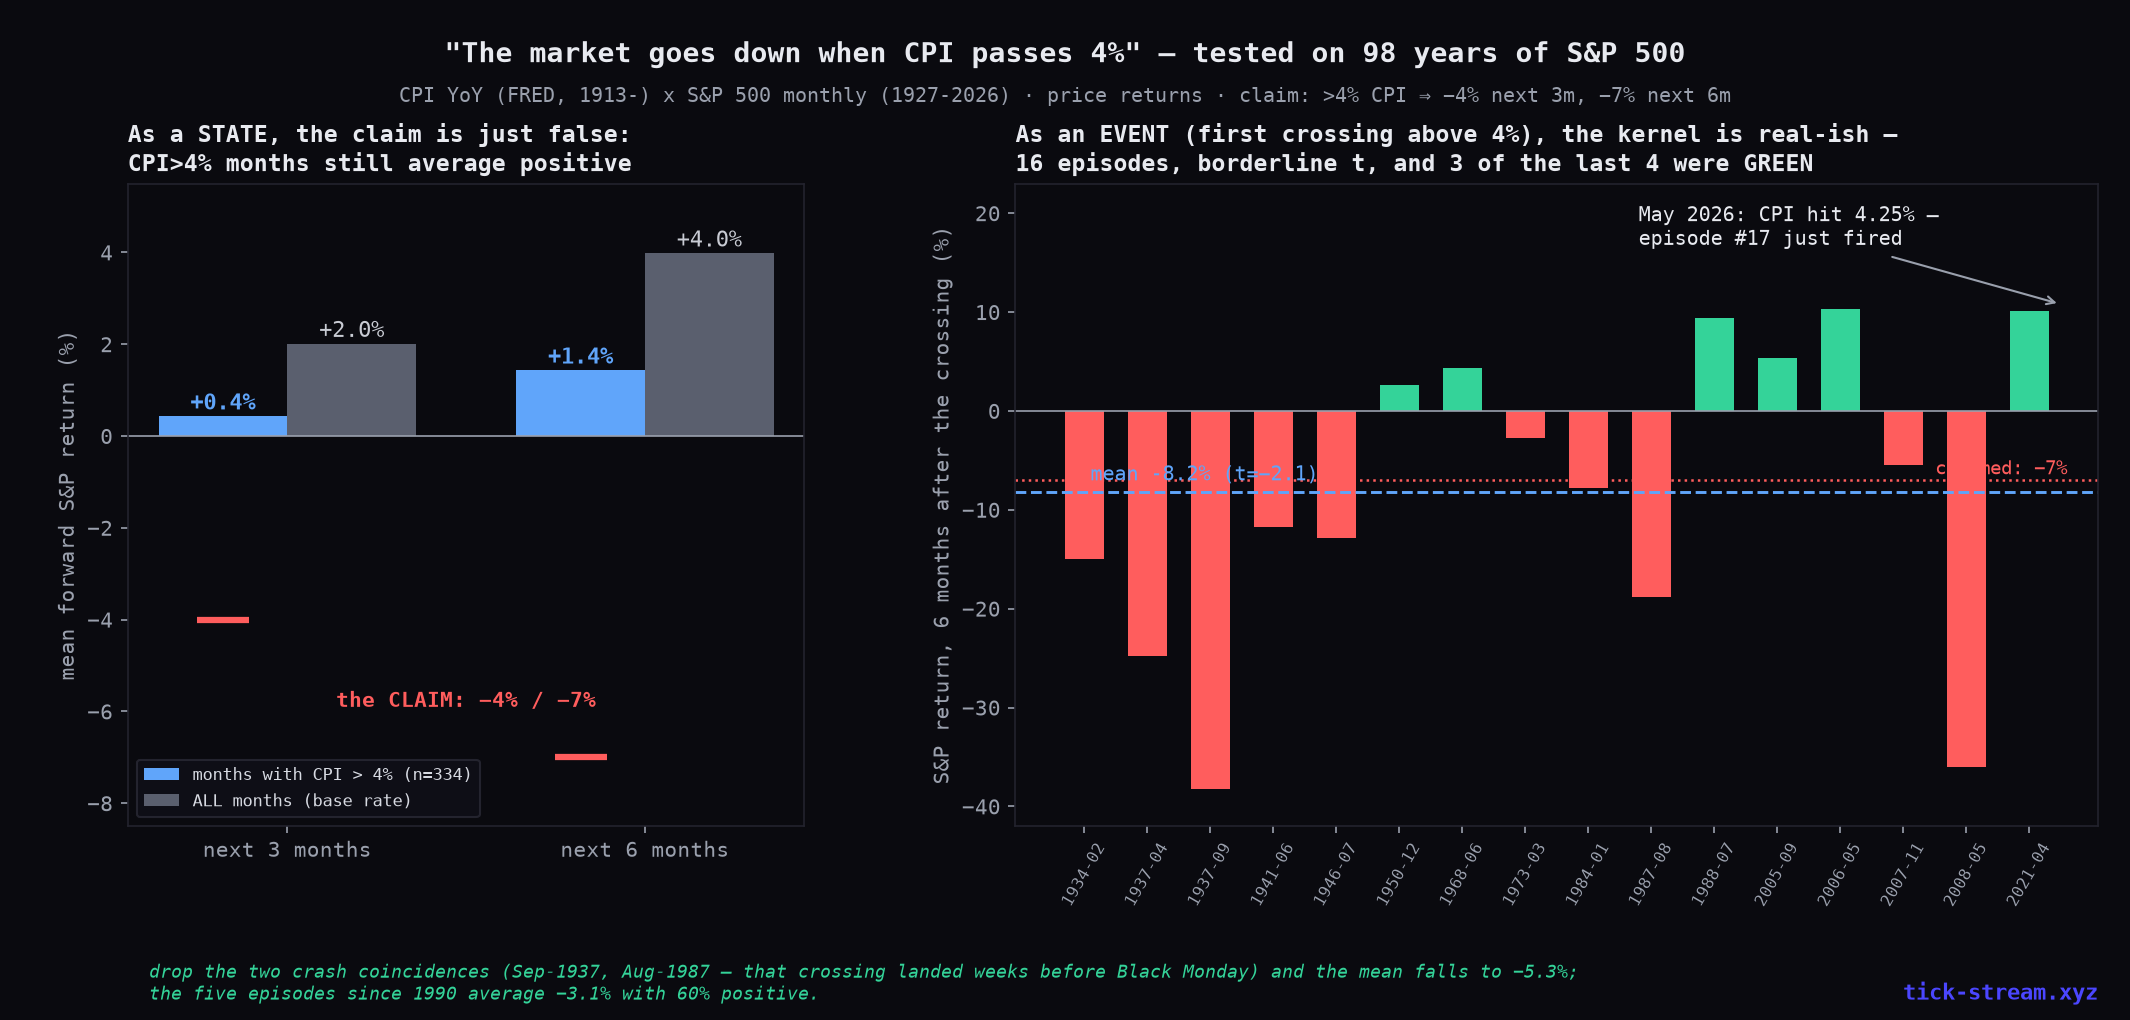
There have been 334 months with YoY CPI above 4% since 1927 — that’s 28% of the last century. What followed them, on average:
| Next 3 months | Next 6 months | |
|---|---|---|
| Months with CPI > 4% | +0.4% | +1.4% |
| All months (base rate) | +2.0% | +4.0% |
| The claim | −4% | −7% |
Below average? Yes — high-inflation regimes earn less. Negative? Not remotely. Stocks ground higher through most of the 1940s, the 1970s and 2021–23 while CPI sat far above 4%. Anyone who sold “because CPI is above 4%” spent 28 of the last 98 years out of a rising market.
Reading 2: the first crossing above 4% — the kernel the claim is (accidentally) built on
Measure the event instead of the state — the month YoY CPI first crosses above 4% after being below — and suddenly the guru’s numbers appear: 16 crossings since 1927, followed on average by −5.2% over three months and −8.2% over six. That’s almost certainly where “−4% / −7%” comes from.
Now the honest fine print, which is where the tradability dies:
- n = 16 in a century. The t-statistic is −2.1 — technically at the significance line, with zero room for error.
- A third of the damage is two coincidences. September 1937 (−38%) and August 1987 — a crossing five weeks before Black Monday, a crash nobody attributes to CPI. Remove those two and the mean drops to −2.1%/−5.3%.
- The signal is decaying. The five crossings since 1990 average −3.1% at six months, and three of the last four (2005, 2006, 2021) were followed by gains — April 2021 by +10.1%. The 2022 bear arrived nine months after the 2021 crossing, outside the claimed window entirely.
The only test that settles it: trade the rule for 98 years
Hold the S&P; go to cash whenever the latest published CPI reads above 4%; re-enter when it drops below. Publication lag respected (CPI for month M is known mid-M+1).
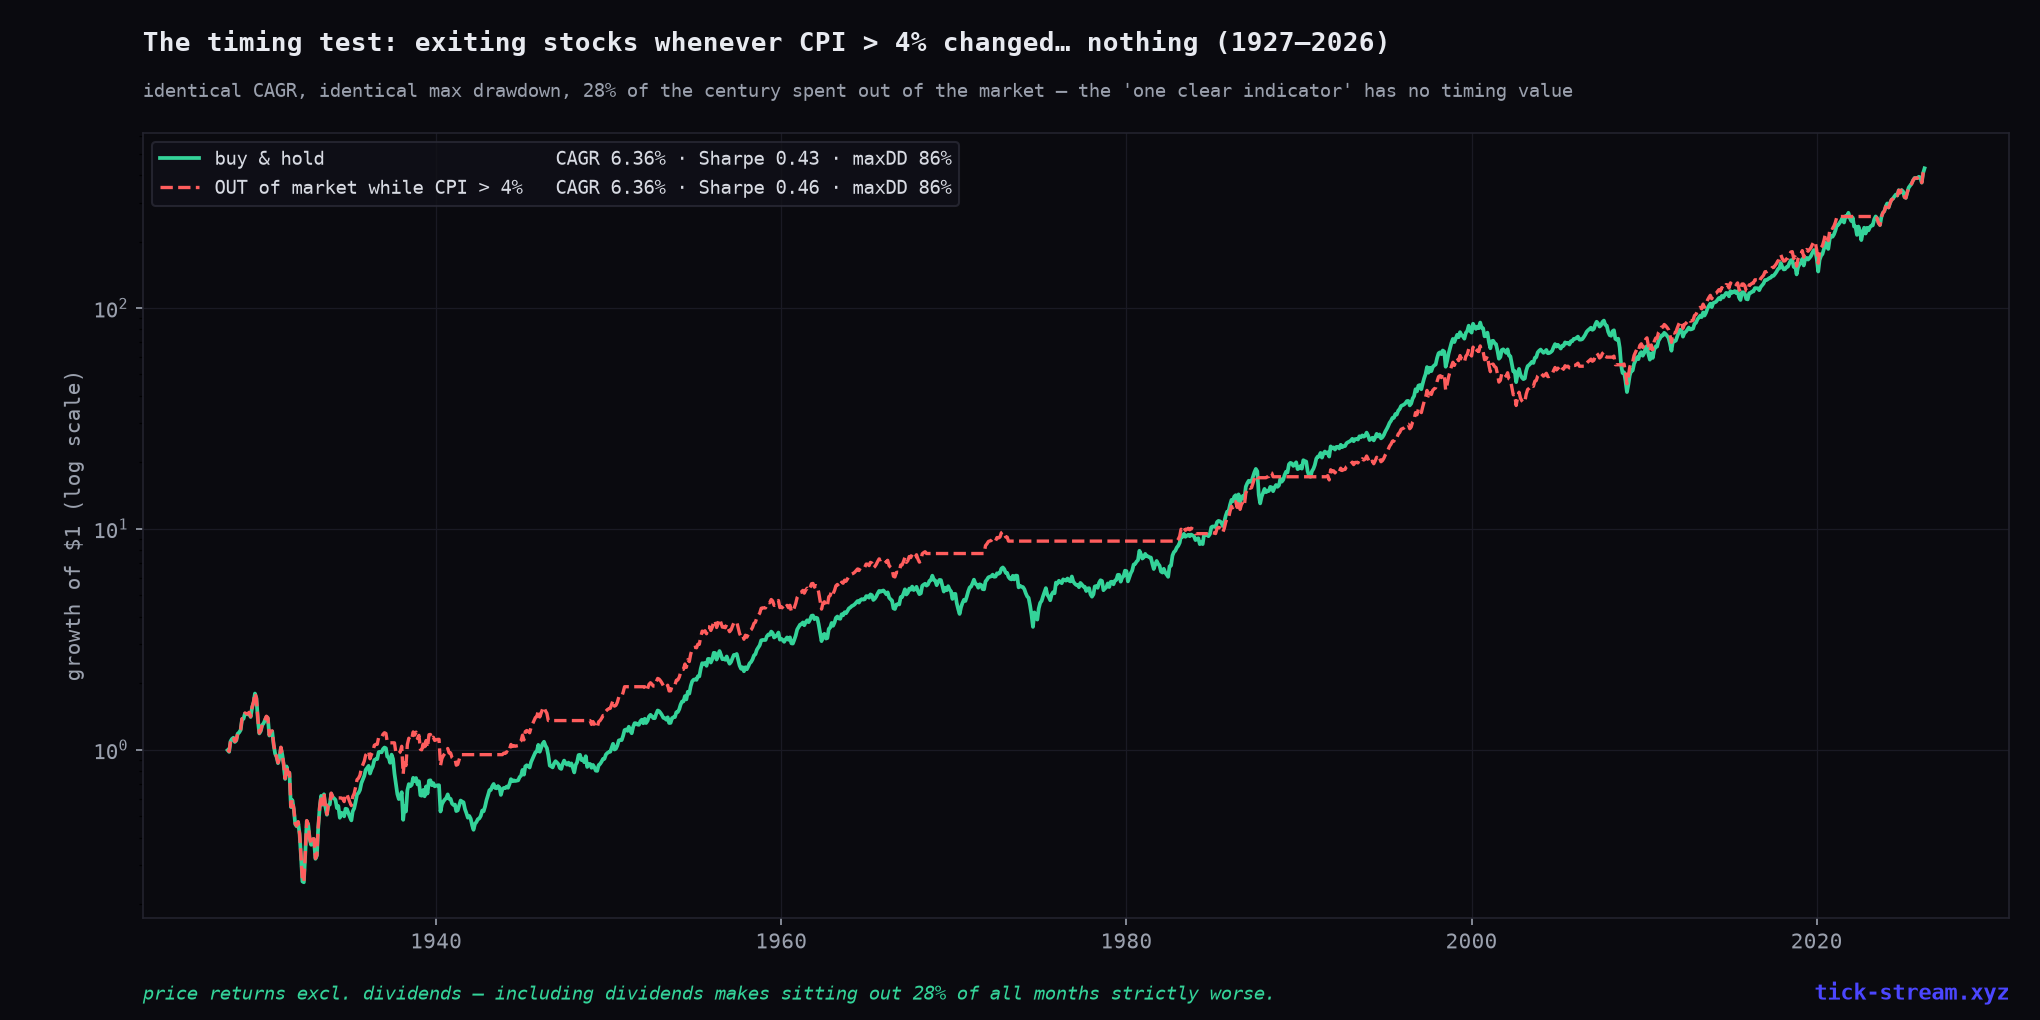
CAGR 6.36% vs 6.36%. Max drawdown 86% vs 86%. Identical — while spending 28% of the century in cash, and before dividends (which make sitting out strictly worse). A century of data, one clear indicator, zero timing value.
Episode #17 just fired — what it actually tells you
May 2026 CPI: 4.25% YoY, the first crossing since 2021. If history is a guide, the honest summary is: mildly elevated risk of a soft patch (10 of 16 past crossings saw a lower market six months on), huge dispersion (−38% to +10%), and no basis for the precision of “−4% and −7%.” Inflation regime changes deserve respect as context — smaller size, wider stops, more hedges. What the data doesn’t support is the sharp threshold sold as a switch: there is nothing magic about the number 4.
The tell, as always, isn’t the macro story — it’s the structure of the claim: a state statistic quoted with event magnitudes, no base rate, no count of how few events there were, and no mention that the last three fires missed. Ask for those four things and most macro one-liners fall apart before you need a Bloomberg terminal, banned or otherwise.
Methodology: CPI = CPIAUCNS (BLS via FRED), monthly NSA index 1913–2026, YoY change. Equities = S&P 500 daily closes 1927–2026 aggregated to month-end, price returns (dividends noted where relevant). State test: all months with YoY > 4%, forward 3/6-month returns vs all-months base, t-stats on non-overlapping samples. Event test: first month crossing above 4% after ≥1 month below. Timing test: long S&P when last published CPI ≤ 4%, cash otherwise, one-month publication lag, monthly rebalance.
Frequently asked questions
Does the stock market go down when CPI is above 4%?
Not as a rule. Across 98 years of S&P 500 data, the 334 months with year-over-year CPI above 4% — that's 28% of the whole sample — were followed by an average +0.4% over three months and +1.4% over six. Below the all-months base rate (+2.0%/+4.0%), but still positive. 'CPI above 4%' as a market state is not bearish; stocks ground higher through most of the 1940s, 1970s and 2021–23 with inflation well above 4%.
So where does the '−4% in 3 months, −7% in 6 months' number come from?
From measuring a different thing: the first CROSSING above 4%, not the state of being above it. The 16 first-crossings since 1927 were followed by −5.2% over three months and −8.2% over six on average — close to the quoted numbers. But it's 16 events in a century (t ≈ −2.1, borderline), a third of the damage comes from two crash coincidences (September 1937, and August 1987 — five weeks before Black Monday), and three of the last four crossings (2005, 2006, 2021) were followed by GAINS.
Can you time the market with a CPI-above-4% rule?
No. We ran the obvious strategy over the full 98 years: hold the S&P, go to cash whenever the latest published CPI is above 4%, re-enter below. Result: identical CAGR (6.36% vs 6.36%), identical maximum drawdown (86%), while sitting out 28% of all months — and that's before dividends, which make sitting out strictly worse. As a timing tool the '4% rule' contributed nothing in a century.
Did CPI just cross 4% again?
Yes — that's what makes the claim topical. US year-over-year CPI printed 4.25% for May 2026 (published mid-June), the first crossing above 4% since April 2021. That makes episode #17 in a hundred years. For the record: episode #16 (April 2021) was followed by +5.1% in three months and +10.1% in six — and the 2022 bear market only began nine months later, outside the claimed window.
Is high inflation bad for stocks at all?
High and RISING inflation compresses valuations, and inflation regime changes have historically coincided with volatile markets — that's real macro. What doesn't survive contact with data is the sharp threshold rule: there is nothing special about the number 4, months above it average positive returns, and the crossing event is too rare and too noisy to trade. Inflation matters as context and for position sizing, not as a one-number market-timing switch.