Do Gamma Walls Actually Work? Call Wall & Put Wall Tested on 7 Years of QQQ
The call wall and put wall are everywhere in options-flow trading — 'price gets pinned to the call wall', 'the put wall is support'. We rebuilt gamma-weighted walls from 7.5 years of real QQQ option chains and tested them. The walls are genuinely informative about which way price drifts — but trying to trade them loses money. What's real, what's a trap, and how much it's actually worth.
Open options-flow Twitter and you’ll see them on every chart: the call wall, the put wall, the gamma flip. “Price is pinned to the call wall.” “The put wall is holding as support.” The pitch is that dealer gamma positioning creates invisible magnets and walls you can trade off. We rebuilt these levels properly from 7.5 years of real QQQ option chains and tested whether they actually work.
The honest answer has two halves: the walls are genuinely informative about which way price drifts — and trying to trade them loses money. Both are true, and the gap between them is the whole story.
What a gamma wall actually is
Every option has gamma. Market-makers (dealers) are on the other side of what retail and funds trade, so they carry a net gamma position they must hedge. The jargon decodes simply:
- Call wall — the strike above spot with the largest dealer call gamma (open interest × gamma). Often behaves like a ceiling or upside magnet.
- Put wall — the strike below spot with the largest put gamma. Often behaves like a floor.
- Net GEX (gamma exposure) — total dealer gamma. Positive = dealers hedge against moves → they sell rallies and buy dips → pinning, low volatility. Negative = dealers hedge with moves → they sell weakness and buy strength → acceleration, trending.
- Gamma flip — the price level where net GEX crosses from positive to negative.
The theory is mechanical and plausible. So we tested it: for every trading day 2019–2026 we computed gamma-weighted walls and net GEX from the actual QQQ chain (open interest and per-strike greeks), then asked — does price reach these walls, and can you trade it?
What’s real: the regime decides the magnet
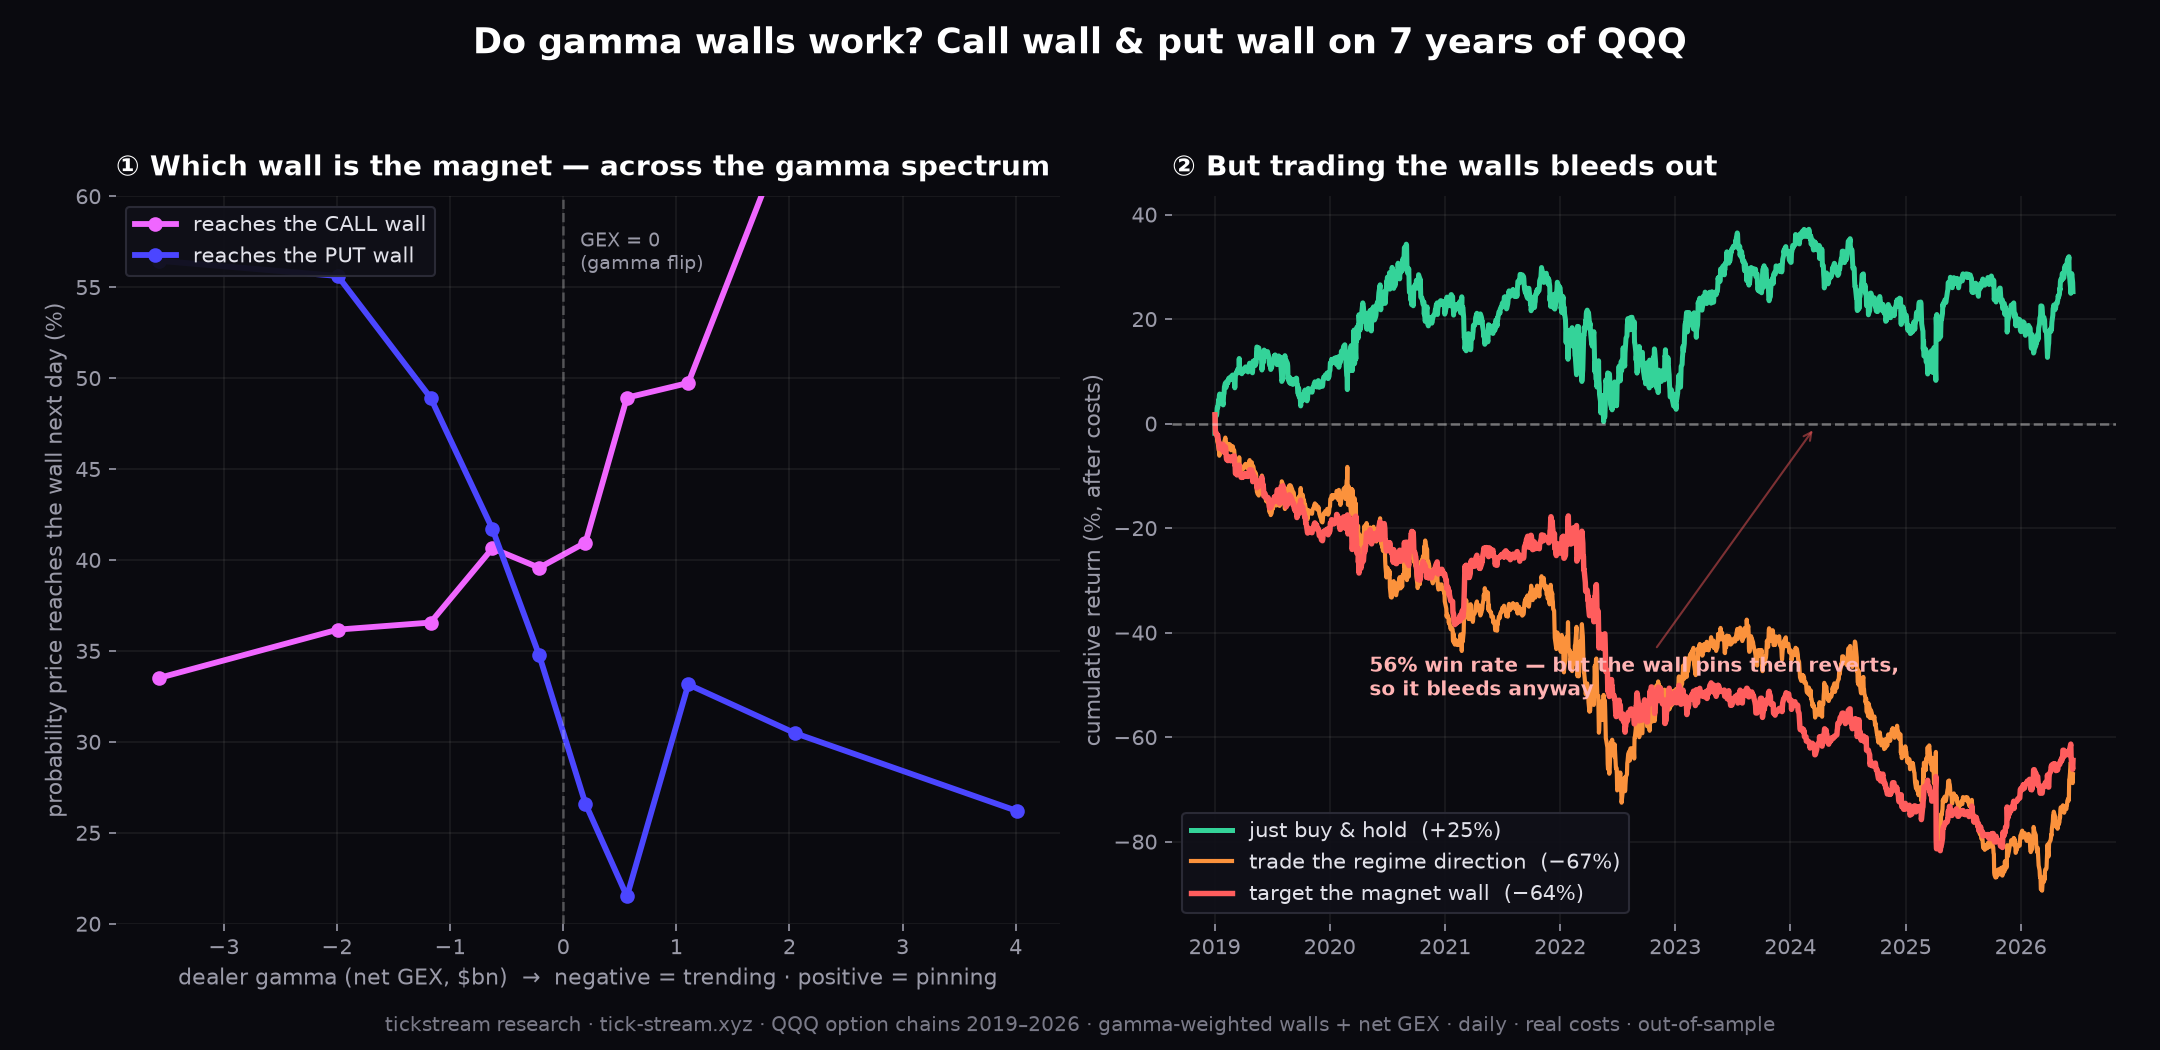
The left panel is the real finding, and it’s robust across all 7.5 years. Which wall price reaches depends entirely on the gamma regime:
- On positive-gamma days (dealers pinning), price reaches the call wall 53% of the time and the put wall only 28%. Price grinds up toward the call wall.
- On negative-gamma days (dealers accelerating), it flips: the put wall becomes the more likely target (48% vs 37% for the call wall). Price drops toward the put wall.
This holds in both halves of the data (2019–2023 and 2024–2026), so it isn’t a fluke of one period. It’s also mechanically sensible: positive gamma suppresses and slowly lifts price into the call wall; negative gamma lets downside accelerate into the put wall. As a description of the day’s character, gamma walls carry real information.
What’s a trap: you can’t trade it
Here’s where the gamma-wall crowd loses people money. If positive gamma means price reaches the call wall 53% of the time, surely you buy toward it? We tested exactly that — long to the call wall on positive-gamma days, short to the put wall on negative-gamma days, entering at the open with realistic costs:
target the magnet wall (no stop) ....  −64%   (Sharpe −0.69)
   + a stop .........................  −93%
trade the regime direction to close .  −67%
just buy & hold QQQ .................  +25%
Every wall strategy lost, out-of-sample, and lost to simply buying and holding. The “target the wall” version even had a 56% win rate — and still lost. That’s the classic win-rate trap: the call wall is close (about 0.4% away in a positive-gamma regime), so you clip a small win when price pins to it — but on the 44% of days it doesn’t reach, you give back more than you made. And because positive gamma means pinning, price often touches the wall and reverts straight back, so even the “wins” aren’t clean. High hit-rate, negative expectancy.
The directional version — just trading the regime’s expected direction to the close — also lost, and lost to buy-and-hold. The gamma regime tells you the magnet, not a tradeable direction: positive-gamma days are roughly flat to the close (they pin), they just pin upward.
Why the gap exists
The walls are a footprint of positioning, not a lever on price. They tell you where dealer hedging is concentrated, which biases the path — but a bias in the path is not the same as a payout. By the time the structure is visible, the probabilities it implies (a sub-1% drift, 53% of the time, that often reverts) are simply not favorable enough to survive a stop, a spread and a commission. It’s the same lesson as order-flow indicators and value-area levels: the information is real and coincident, the tradeable edge lives somewhere else.
How much is it actually worth?
Not zero — but not as a trigger. The honest uses:
- Context / day-character. Knowing you’re in a positive-gamma (pin) vs negative-gamma (trend) regime, and which wall is the magnet, helps you frame the day. That’s worth something for discretionary expectation-setting.
- A regime filter, modestly. Using the gamma sign to gate a momentum strategy has some value — in our tests a breakout strategy’s risk-adjusted return improved when restricted to negative-gamma (trending) days. But it’s modest and not perfectly stationary: in 2021 the relationship inverted. It’s a risk/efficiency tweak, not a new edge.
What it is not is a set of lines to mechanically fade or target. “Short the call wall,” “buy the put wall,” “price must fill to the gamma flip” — none of those survived testing.
The bottom line
On 7.5 years of real QQQ chains: gamma walls genuinely describe the day — positive gamma pins price up toward the call wall (53%), negative gamma drops it toward the put wall (48%), robustly. But trading the walls loses every way we tried it (−64% to −93%, beaten by buy-and-hold), because a path-bias that reverts isn’t a payout. Use gamma walls as a probability map for context, not a mechanical trade trigger. If someone sells you “fade the call wall” or “target the put wall” as a system, ask to see it beat buy-and-hold, out-of-sample, after costs.
Methodology: QQQ option chains 2019–2026 (daily, full open interest + greeks). Gamma-weighted call/put walls (max OI×gamma strike above/below spot), net GEX = Σ(call−put) OI×gamma×spot²×100×0.01, gamma flip = zero-crossing of cumulative net GEX, ≤45-DTE. Wall-touch measured next-day against the wall set at prior EOD (lookahead-free). Strategies entered at the open, conservative fills, ~3 bps round-trip cost, 2019–2023 / 2024–2026 split.
Frequently asked questions
Do gamma walls (call wall / put wall) actually predict price?
Partly, and only as context. On 7.5 years of QQQ we found which wall price reaches depends on the dealer gamma regime: on positive-gamma days price reaches the call wall 53% of the time (put wall only 28%); on negative-gamma days the put wall becomes more likely (48% vs 37%). That's a real, robust descriptive pattern. But it does not convert into a tradeable edge — targeting the 'magnet' wall lost money in every version we tested, out-of-sample and after costs.
Can you trade by buying toward the call wall or selling toward the put wall?
No — it loses. We tested entering toward the magnet wall (long to the call wall on positive-gamma days, short to the put wall on negative-gamma days) over 7.5 years with realistic costs: −64% with no stop, worse with stops, and it lost in the out-of-sample period too. The 56% win rate is a win-rate trap: price pins to the wall and reverts, so the small wins are outweighed by the larger losses on the days it doesn't reach. Just buying and holding QQQ beat every wall strategy.
What is a gamma wall, in plain terms?
It's the strike with the largest dealer gamma (open interest × gamma). The call wall is the heavy call-gamma strike above price — often acting like a ceiling/magnet — and the put wall is the heavy put-gamma strike below. Net GEX is total dealer gamma: positive means dealers hedge against the move (pinning, low volatility); negative means they hedge with the move (acceleration). The gamma flip is the price where net GEX crosses zero.
Is the call wall really resistance and the put wall really support?
Loosely, and only in the right regime. In a positive-gamma (pinning) regime, price tends to grind up toward the call wall — so it behaves more like a magnet than a hard ceiling. In a negative-gamma regime the walls are far more likely to be broken, and the put wall in particular gets reached. Treating either as a fixed line to fade or target mechanically loses money; treating them as a probability map for the day's character is where the actual information is.
So are gamma walls useless?
Not useless — just not a trade trigger. They're genuinely informative as context: which direction is the magnet today, whether the day is likely to pin (positive gamma) or trend (negative gamma). That can help you frame expectations or gate a momentum strategy. But as a standalone 'fade the wall / target the wall' system, it loses after costs. The value is descriptive, not mechanical.