Does ICT Actually Work? We Backtested the 5 Core Setups on 7 Years of NQ
Order Blocks, Fair Value Gaps, Liquidity Sweeps, the Silver Bullet and OTE — we backtested the core ICT (Inner Circle Trader) concepts lookahead-free on 7 years of NQ futures, with real costs and daily-aggregated significance. Four of five fail outright, and the one that 'works' has nothing to do with Fibonacci. The data, in full.
ICT — the Inner Circle Trader framework — is probably the most-shared discretionary trading methodology on the internet. Order blocks, fair value gaps, liquidity sweeps, killzones, the Silver Bullet, optimal trade entry. The charts look convincing in hindsight. So we did the thing almost nobody posting these setups does: we backtested the core concepts properly, on seven years of NQ futures, and let the data settle it.
The short version: four of the five core setups fail, and the one that “works” has nothing to do with the Fibonacci levels ICT is famous for.
What we tested
ICT isn’t a single strategy, so we tested the concrete, tradeable setups people actually cite — not a strawman:
- Order Block — the last opposite-colour candle before a displacement move; trade the retrace back into it.
- Fair Value Gap (FVG) — a 3-candle imbalance (a gap in the auction); trade the retrace into the gap as support/resistance.
- Liquidity Sweep — price sweeps the prior day’s high or low (the “stop hunt”), then reverses back inside.
- OTE (Optimal Trade Entry) — enter at the 62–79% Fibonacci retracement of an impulse leg.
- Silver Bullet — the first fair value gap formed in the 10:00–11:00 AM ET window.
How we made the test un-arguable
The whole point of this exercise is that an ICT trader shouldn’t be able to wave it away. So:
- NQ 5-minute bars, 2019 → 2026 (~7.5 years).
- Lookahead-free. Signals only ever use already-closed bars.
- Conservative fills. On the entry bar, only the stop can trigger; the target can only be hit from the next bar onward. No “it would have filled” optimism — the exact assumption that flatters most retail backtests.
- Real costs. $4.50 commission + 2 ticks of slippage per trade.
- Daily-aggregated significance. We sum each day’s trades into a daily P&L and compute the t-statistic over days, not trades. This matters: several of these setups fire 4–5 times a day on the same move, and those trades aren’t independent. Aggregating to daily P&L stops overlapping intraday trades from inflating the significance — the most common (and valid) criticism of high-frequency backtests.
- Train/holdout split so a curve-fit can’t pass as an edge.
The result
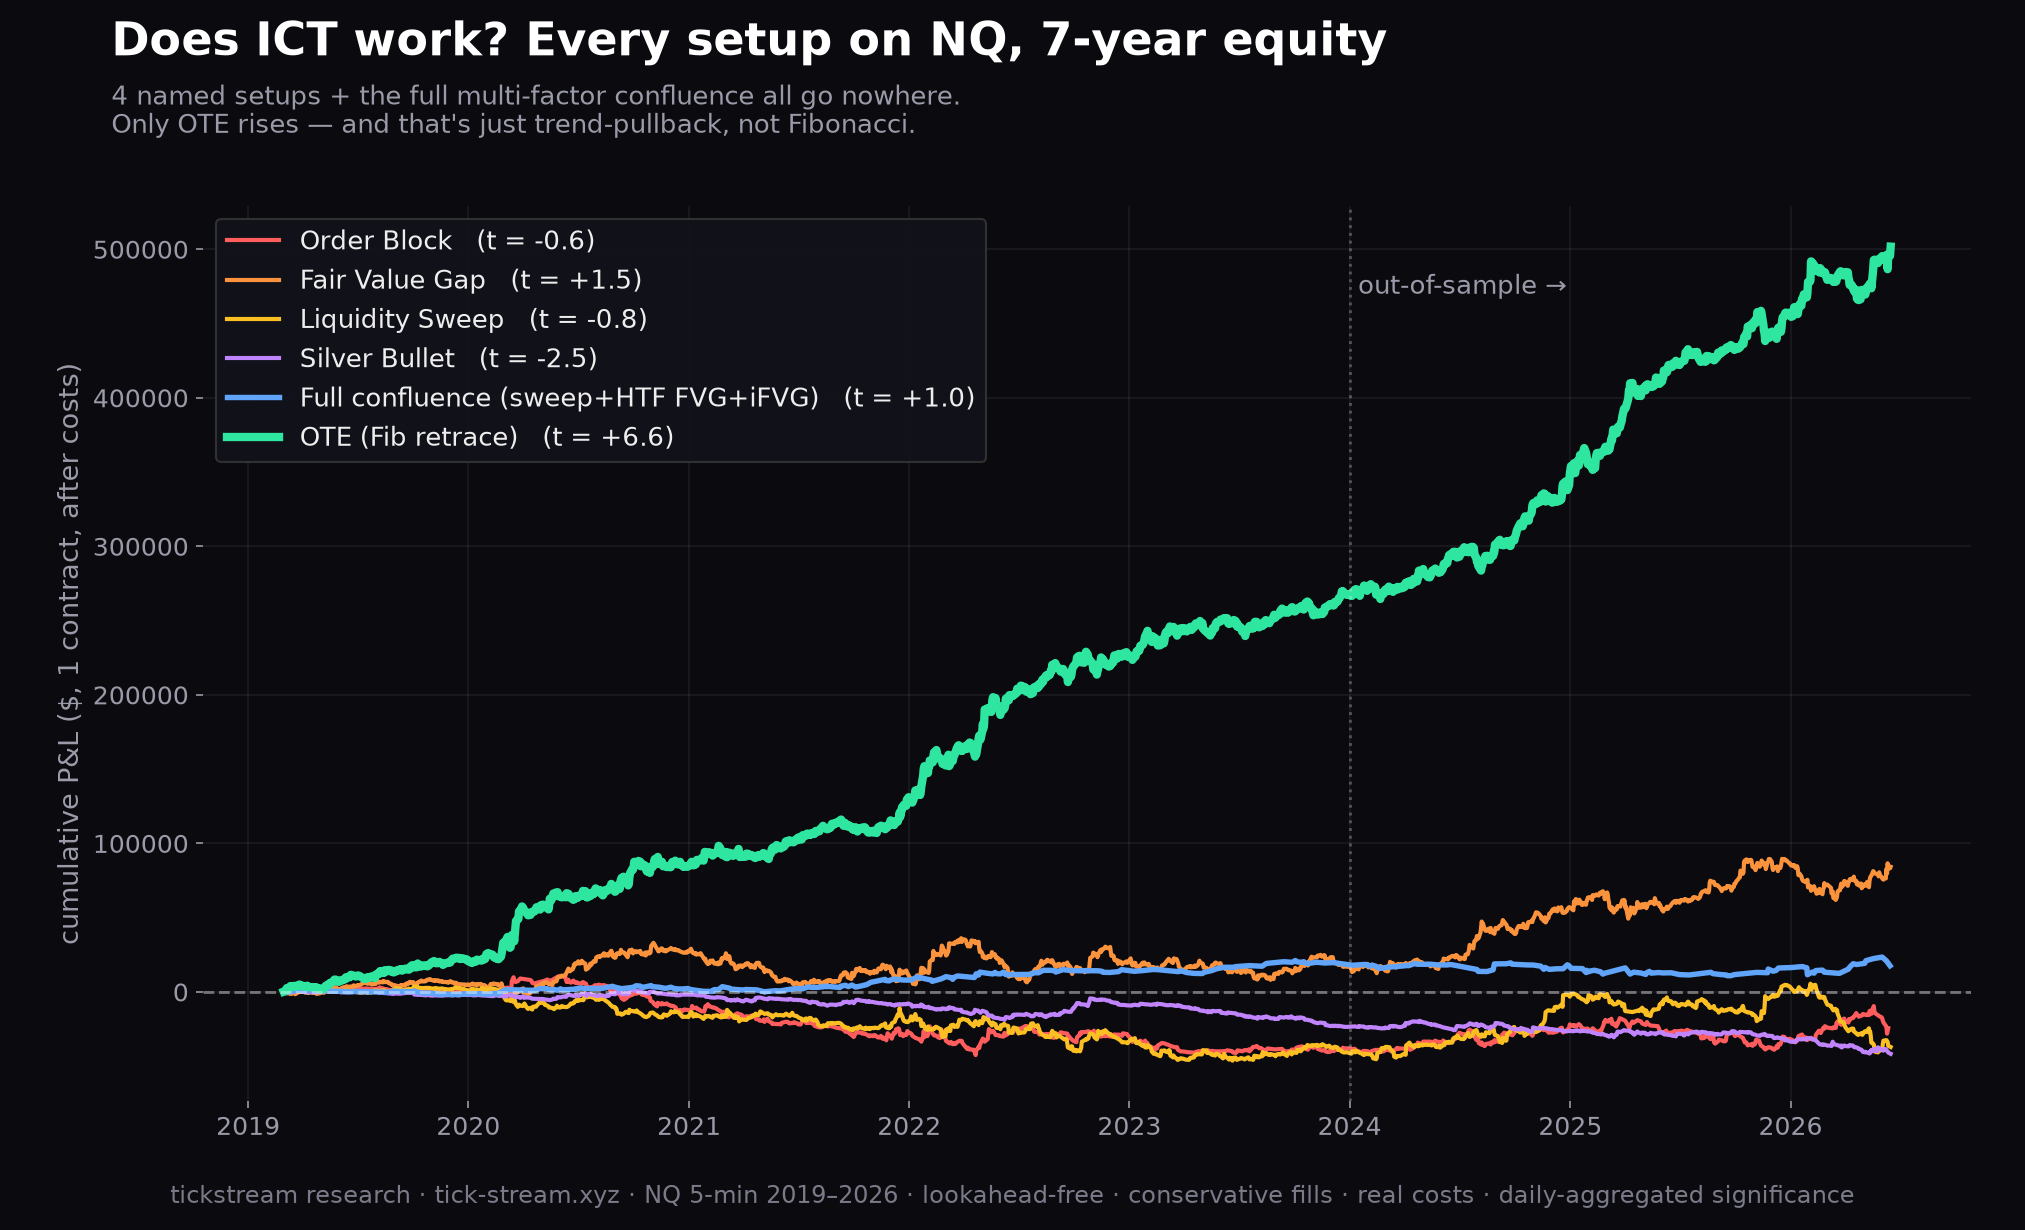
Daily t-stats. The t-statistic measures how far a result sits above zero relative to its own noise (how many standard errors): |t| above 2 means less than a ~5% chance it’s luck — a real edge; −2 to +2 is indistinguishable from random; negative means it lost money. You need |t| > 2 to claim an edge:
Order Block       t = −0.6     dead
Fair Value Gap    t = +1.5     noise (below significance)
Liquidity Sweep   t = −0.8     dead
Silver Bullet     t = −2.5     significantly LOSES
OTE (Fibonacci)   t = +6.6     works ✅
Four of the five named-pattern setups don’t survive. The Silver Bullet doesn’t merely fail to make money — it loses with statistical significance. Order blocks and liquidity sweeps are flat-to-negative. Fair value gaps are noise.
Only OTE shows a genuine, out-of-sample-stable edge. Which is where it gets interesting.
The OTE reveal: Fibonacci does nothing
OTE’s entire premise is precision — the magic happens specifically in the 62–79% Fibonacci retracement zone. So we tested every retracement depth, from a shallow 24% to a deep 89%:
24% → t 4.7    38% → t 7.4    50% → t 6.9    62% → t 6.5
70% → t 4.7    79% → t 2.9    89% → t −4.0
The strongest entry is the 38% pullback — which isn’t even an ICT entry level. The much-hyped 62–79% “OTE zone” is mediocre by comparison, and the deep 89% retrace actively loses money.
In other words, the Fibonacci ratios are doing no work whatsoever. What’s actually being captured is the generic, decades-old principle of buying a pullback in the direction of the trend — the shallower, the better (you’re paying less of the move away). It even correlates with a plain momentum strategy. ICT didn’t discover this edge; it re-labelled it and bolted Fibonacci onto the front.
Why the “level” setups fail
There’s a consistent reason order blocks, FVGs, liquidity sweeps and the Silver Bullet all fail on NQ: they are all “trade the reaction at the drawn level” ideas. And on a heavily-watched, liquid future, the obvious level is exactly where the visible liquidity sits — so it’s where moves get absorbed, not where they cleanly reverse. We’ve now watched this same structural fact kill a long list of level-based models: volume-profile breakouts, key zones, SMC rejection blocks, market-profile value areas, and now four of the five core ICT setups. The durable edge lives in open air, away from the obvious level — continuation once price is already moving — not at the line everyone drew.
”But you have to stack them” — the full confluence model
The usual response to a test like this is a retreat: the individual setups aren’t supposed to work alone — you need the full confluence. Fair enough. So we built the canonical ICT entry stack and tested that too: a liquidity sweep, into a higher-timeframe (1-hour) fair value gap, confirmed by a lower-timeframe inverse FVG (a 5-minute gap that gets violated and flips polarity). Same rules — lookahead-free, conservative fills, real costs, train/holdout split.
The result is the most instructive part of the whole study. The base idea — sweep liquidity, then trade the reclaim — loses badly on its own: t = −8.8, −$708k over the sample (the “sweep then reverse” premise is simply wrong on NQ). Stacking the HTF-FVG and inverse-FVG filters on top doesn’t create an edge — it just throws away most of those losing trades until what’s left looks like nothing in particular: a full-sample t of 0.98, statistically indistinguishable from noise.
And here’s the tell, the second panel of the chart: the full confluence model looks mildly positive in-sample (t = +1.8, 2019–2023) and then flips negative out-of-sample (t = −0.15, 2024–2026). That is exactly what an over-fit looks like. Every extra condition you stack makes the sample smaller and the in-sample picture prettier, while the out-of-sample reality stays flat. The famous “confirmed on both assets” SMT filter would only make this worse — it removes more trades from an already-tiny, non-significant set; a filter can’t manufacture an edge that the signal doesn’t have.
A note on rigour (and why most ICT “proof” is worthless)
Our first OTE pass printed a t-stat of 12 and a million-dollar equity curve. It was wrong — a sloppy fill rule on our side was quietly skipping the entry bars that ran straight to the stop, which manufactures winners. We caught it, fixed it, and the number fell to the real (still-real, but very different) figure. Then we stripped the Fibonacci myth off the rest.
That’s the difference between a backtest and a highlight reel. Most ICT “proof” you’ll see is hand-picked screenshots with entries marked in hindsight, no costs, and no out-of-sample period — which proves exactly nothing. If you don’t attack your own results harder than your critics will, you’re not testing, you’re confirming.
What we did with the one thing that worked
Here’s the part most “debunk” threads miss: tearing a model apart is only half the work. Once we’d stripped the Fibonacci myth off OTE, what was left was a real, mechanical edge — generic trend-pullback continuation — and a real edge is worth keeping.
So we didn’t just write it up. We built it. After picking the configuration the honest way — selecting on out-of-sample robustness rather than the prettiest backtest number — it came out positive in every single year of the seven, with a daily Sharpe in the 3–5 range, robust to heavy costs, and uncorrelated to the rest of our book. It now runs as a live, paper-traded strategy on tickstream alongside our other sleeves, with a public track record.
What we’re not going to do is hand over the exact rules — the displacement filter, the lookback, the entry trigger, the exit logic. That’s the part that took the work, and it’s the part with the value. The point of this article isn’t a free strategy; it’s to show the difference between a setup that survives an honest test and one that only survives a screenshot. The edge that came out of this wasn’t ICT’s order blocks or its Fibonacci — it was the boring thing underneath, validated properly and traded mechanically.
The bottom line
On seven years of NQ futures, four of the five core ICT setups have no tradeable edge, and the Silver Bullet loses with significance. The fifth — OTE — works, but not for the reason ICT claims: it’s generic trend-pullback continuation, and the specific Fibonacci levels are arbitrary (a non-Fib pullback beats them). If your edge survives only on a marked-up screenshot, it isn’t an edge. Run it through costs, out-of-sample data, and honest fills first.
Methodology: NQ continuous front-month, 5-minute bars, 2019–2026. Order Block (displacement ≥ 1.5×ATR), 3-candle FVG, prior-day liquidity sweep, OTE across 23.6–88.6% retracements, Silver Bullet in the 10–11 ET window. Lookahead-free signals, stop-first conservative fills, $4.50 commission + 2-tick slippage, daily-aggregated significance, 2019–2023 train / 2024–2026 holdout.
Frequently asked questions
Does ICT actually work in backtesting?
Mostly no. We backtested the five core ICT setups on seven years of NQ futures, lookahead-free, with real costs and daily-aggregated significance. Order Blocks (t = −0.6), Liquidity Sweeps (t = −0.8) and the Silver Bullet (t = −2.5) all failed; Fair Value Gaps were statistical noise (t = +1.5, below significance). Only OTE showed an edge — and that edge turns out not to be about Fibonacci at all.
Do ICT Order Blocks and Fair Value Gaps have an edge?
Not on NQ in our testing. Order Blocks produced a slightly negative result (t = −0.6) and Fair Value Gaps came in at t = +1.5, which is below the |t| > 2 threshold you need to claim an edge — indistinguishable from noise. These are 'trade the level' setups, and on NQ reactions at obvious, widely-watched levels tend to get absorbed rather than respected.
Is the ICT OTE (Optimal Trade Entry) edge real?
There is a real effect, but it is not Fibonacci. OTE says enter in the 62–79% retracement zone. We tested every retracement depth: the non-Fibonacci 38% pullback was the strongest (t = 7.4), the ICT-prescribed 62–79% zone was mediocre, and the deep 89% retrace lost money. The Fibonacci ratios add nothing. What works is the generic principle of buying a pullback in the direction of the trend — well-known continuation behaviour that long predates ICT.
Does the full ICT confluence model (liquidity sweep + HTF FVG + inverse FVG) work?
No. We backtested the stacked entry model — a liquidity sweep into a 1-hour fair value gap, confirmed by a lower-timeframe inverse FVG — lookahead-free with real costs. The base 'sweep then reclaim' idea loses badly on its own (t = −8.8). Stacking the filters doesn't create an edge; it just discards most of the losing trades until what remains is statistical noise (full-sample t = 0.98). Worse, it looks mildly positive in-sample (t = +1.8) and flips negative out-of-sample (t = −0.15) — the signature of an over-fit. The 'confirmed on both assets' (SMT) filter can't help either, because it only removes trades; a filter cannot manufacture an edge a signal does not have.
Why do most ICT backtests look profitable?
Because they usually aren't real backtests. They tend to be hand-picked chart screenshots with no transaction costs, no out-of-sample period, and entries marked in hindsight. Add slippage and commissions, use only past data to trigger trades, and test across a full multi-year sample, and most ICT setups stop working. We also caught a subtle artifact in our own first OTE pass that inflated the result — if you don't hunt your own bugs, a backtest proves nothing.