Gamma Squeeze Explained — And What One Actually Looks Like in Dealer-Gamma Data
A gamma squeeze is dealer hedging turning into fuel: as price rises, the desks that sold the calls must buy more stock, which pushes price higher, which forces more buying. Most explainers stop at the mechanism. We kept seven years of our own dealer-gamma numbers, so this one shows a real episode day by day — SPY, March 2026, three weeks of deeply negative gamma, a 2.90% reversal, and the exact session where hedging flipped and the squeeze ended.
Most explanations of a gamma squeeze stop at the mechanism, because the mechanism is the easy part and the data is the hard part. We have kept our own dealer-gamma numbers every trading day since January 2019, so this piece does both: the mechanism, and then a real episode with dates on it.
The mechanism
When you buy a call, a market maker sold it to you, and they do not want your directional bet. They hedge it by holding shares — how many depends on the option’s delta.
Delta is not fixed. As price rises toward the strike, the call becomes more likely to finish in the money and its delta rises, so the dealer must hold more shares. The rate at which delta changes is gamma, and the sign of the dealer’s gamma decides whether their hedging calms the market or feeds it.
Long gamma — the dealer sells as price rises and buys as it falls. They are leaning against the move, and the market is quieter than it otherwise would be.
Short gamma — the dealer must buy as price rises and sell as it falls. They are pushing in the direction of the move.
A gamma squeeze is the second case running hot. Price rises, dealers buy to stay hedged, the buying lifts price, delta rises again, they buy more. Nobody in that loop wants price higher. They are just staying flat, and staying flat is what moves it.
Why call buying starts it
Heavy call buying puts dealers short gamma in a concentrated place. That is why squeezes so often follow a burst of short-dated, out-of-the-money call volume: those options have the most gamma per dollar, so a small move in price forces a large change in the hedge.
It is also why a gamma squeeze and a short squeeze often arrive together. In a heavily shorted name, call buying creates the gamma loop while shorts covering creates the other, and each makes the other worse. The famous single-name episodes of early 2021 were both at once. But the gamma part does not need anyone to capitulate — it runs on hedging alone.
What it looks like in real data
Here is one, in full, from our own daily gamma series. SPY, from 19 March to 10 April 2026.
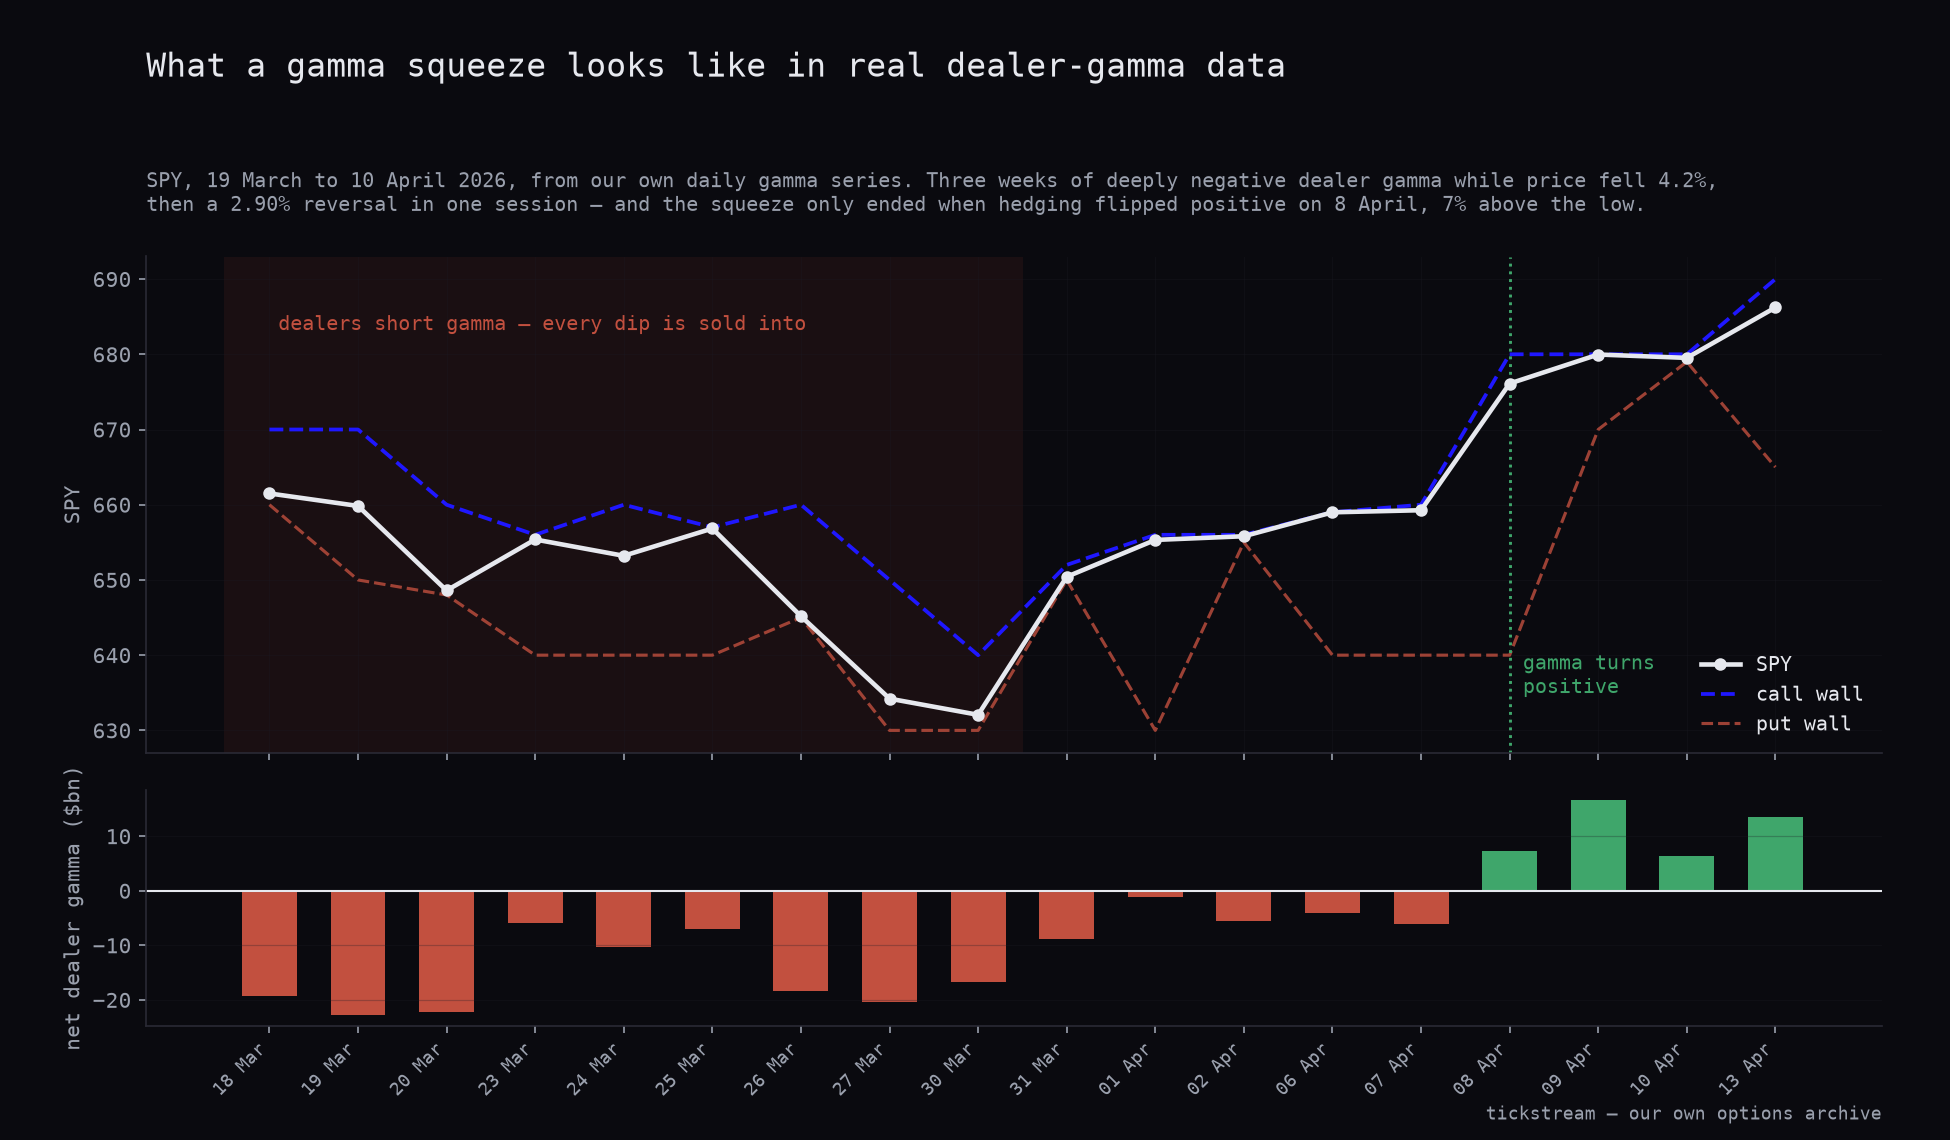
Read it from the bottom panel up.
The setup, 19–30 March. Net dealer gamma sits between −$16.7bn and −$22.8bn — deeply negative for three straight weeks. In that condition every decline is amplified by hedging, and price does decline: 659.84 down to 632.07, a fall of 4.2%. Nothing squeezes yet. Short gamma is symmetric, and while price is falling it makes the falling worse.
The turn, 31 March. Price reverses 2.90% in one session, from 632.07 to 650.42, straight through a call wall that had sat at 640. This is the squeeze half of short gamma: the same hedging that accelerated the decline now accelerates the recovery, because the desks that sold into weakness have to buy back into strength.
The compression, 1–7 April. Net gamma climbs from −$8.78bn to −$1.07bn while price grinds higher. This is the part most explanations leave out: a squeeze does not end when price stops rising, it ends when the hedging position that caused it is gone. Each day of higher prices moves more open interest into the money and changes what dealers must hold.
The end, 8 April. Net gamma turns positive, +$7.37bn, and price jumps another 2.55% to 676.11. The next day it is +$16.58bn. From there the market goes quiet — 679.97, then 679.52, moves of half a percent and less. Dealers are now long gamma, and their hedging damps rather than amplifies.
The whole arc took fifteen sessions and ended roughly 7% above the low. At no point did the gamma data say “buy”. What it said, every day for three weeks, was that moves would be larger than usual — and they were, in both directions.
The part worth trusting
We tested this properly rather than assuming it. Across 1,871 sessions of SPY, the next day’s absolute move averaged 1.09% when net dealer gamma was negative against 0.55% when it was positive — a ratio of 2.01× with a t-statistic of +13.1. On QQQ it is 1.72×. And it does not rest on one dramatic period: the ratio sits above 1.0 in every year of the sample for both symbols, from a calm 1.34× in 2022 to 2.60× in 2020.
That is one of the most stable relationships we have measured on anything, and it has an obvious practical use. If your position sizing assumes an ordinary day and dealer gamma is deeply negative, you are carrying roughly twice the risk you think you are.
The part not worth trusting
The call wall is the number people want to trade, and it does not survive a fair test.
Over the same seven years, price closed above the call wall in 33.0% of next sessions on SPY. Against a level drawn at random from the same distance distribution, on the same side of spot, it was 33.3%. On QQQ, 29.1% against 29.8%. In both cases the real wall lands inside the controls’ own spread, and most random controls beat it. We ran the same question intraday across 31 days on levels recomputed through the session, and no level beat its mirror placebo.
So in the episode above, the fact that price tore through the 640 call wall on 31 March is not evidence the wall failed. It is what a level that distance away does about a third of the time, wall or not.
A wall marks where hedging concentrates. That is a real statement about where flow will be heaviest. It is not a barrier, and the distinction matters most exactly when a squeeze is running — because that is when people reach for the wall as a target.
How to watch for one
Three things, in order of how much they are worth:
Aggregate net gamma, and its sign. This is the whole signal. Deeply negative means the market is primed to move — either way.
How negative, relative to its own history. −$1bn and −$20bn are not the same condition. In the episode above, the setup phase ran three weeks at more than −$16bn.
Where the concentration sits. Useful for knowing where flow gets heavy, not for setting targets. Treat it as terrain, not as a fence.
What you will not get from any of it is direction. The same negative-gamma condition that produced a 2.90% rally on 31 March produced a 1.78% decline on 26 March. The regime tells you the size of what is coming. Nothing in the options market tells you the sign.
Look at it yourself
Our live GEX chart is free and needs no account: net gamma per strike, both walls, the zero-gamma flip, an open-interest or volume lens and a 0DTE filter. The methodology page shows how the numbers are computed and includes the same tests as above, including the one our own product does not pass.
If you want the numbers in a model rather than on a screen, they are one endpoint away.
Method: dealer gamma computed per strike and expiry from full OPRA open interest, signed by a non-naive assumption about customer positioning, aggregated per underlying per session. Daily series since 2019-01-02. The March–April 2026 figures are the stored values from those sessions, not a reconstruction. Nothing here is financial advice.
Frequently asked questions
What is a gamma squeeze?
A feedback loop created by option hedging. When dealers are short gamma, staying hedged forces them to buy as price rises and sell as it falls — the same direction the market is already moving. That buying pushes price further, which forces more buying. Nothing about it requires anyone to have an opinion; it is a bookkeeping consequence of the positions they sold.
How is a gamma squeeze different from a short squeeze?
A short squeeze is short sellers buying to close losing positions. A gamma squeeze is option dealers buying to stay delta-neutral. They often happen together — heavy call buying in a heavily shorted name creates both at once — but the gamma part is mechanical and continues whether or not anybody capitulates.
How do you know when dealers are short gamma?
You estimate it from open interest, per strike and expiry, signed by an assumption about who holds which side. It is an inference, not a report — nobody publishes dealer inventory. The number to watch is aggregate net gamma: negative means hedging amplifies moves.
Does negative gamma predict which way price will go?
No. Across 1,871 sessions of SPY it predicts how far, not which way: the next-day move averaged 1.09% under negative dealer gamma against 0.55% under positive, a ratio above 1.0 in every year of our sample. Direction is not in the signal, and the call wall is crossed as often as any level the same distance away.
Can you trade a gamma squeeze?
You can size for one. The regime is real and stable enough to change how much risk a position carries. Trading the levels themselves is a different claim, and it did not survive our testing — walls mark where hedging concentrates, not where price stops.