A 78% Win-Rate First-Hour Strategy Went Viral. We Ran It on 7 Years of NQ.
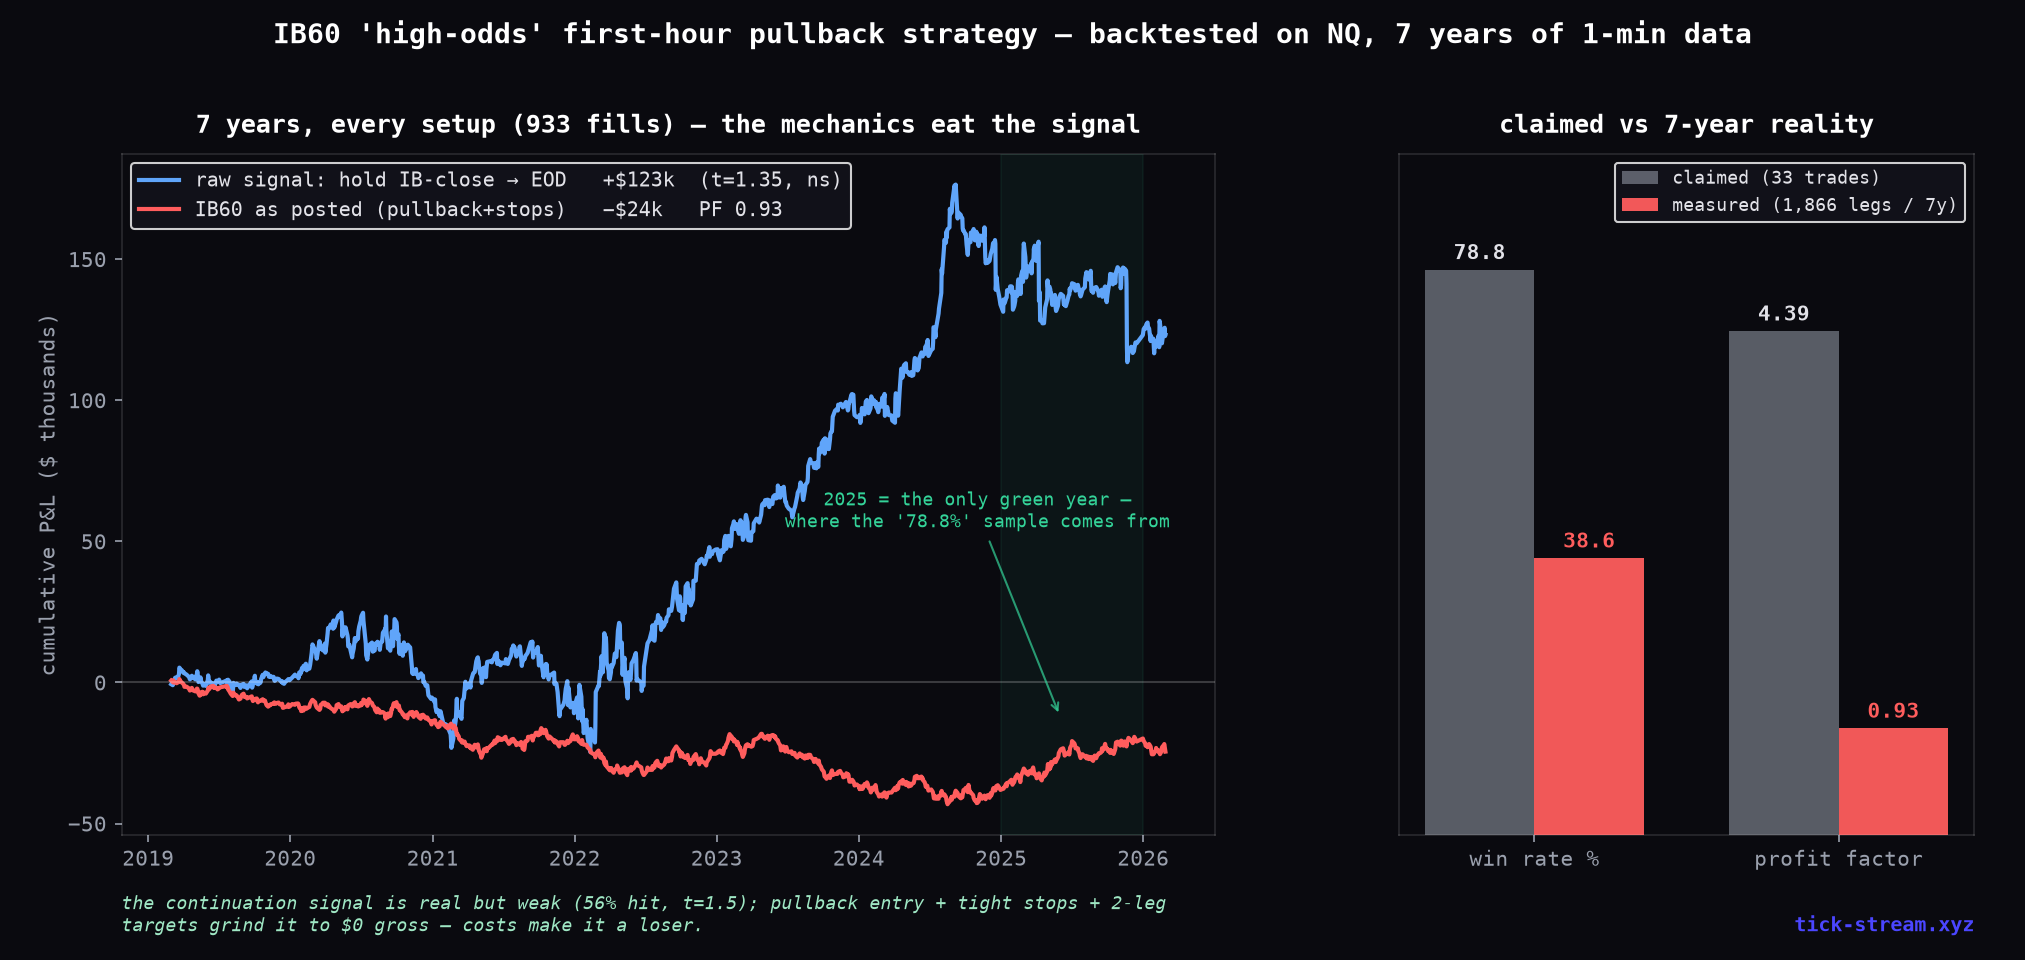
The IB60 setup — first-hour initial balance, close outside the 15-minute opening range, dynamic pullback entry, two-leg exits — was posted with 33 trades, a 78.8% win rate and a 4.39 profit factor. We rebuilt the exact rules and ran them on seven years of NQ minute data with conservative fills and real costs: 38.6% win rate, profit factor 0.93, net negative. The interesting part is WHERE the edge leaks out — because the underlying signal is actually real.
A detailed intraday setup made the rounds on r/Trading: the IB60. First hour of the session = the initial balance (IB). If the first hour makes a new low and closes below the 15-minute opening range, you don’t chase — you wait for a pullback (10% of the IB range, capped in ticks), short it, stop at 30% of the range, take half at 1R, move to breakeven, run the rest to 1.75R. Mirrored for longs. Posted receipts: 33 trades, 26 wins, 78.8% win rate, profit factor 4.39.
Someone asked us the honest question: they’d been trying to trade this signal via 0DTE options, theta selling, and futures — and everything bled. “The signal is consistent, but it’s not profitable. Where am I going wrong?”
So we rebuilt the exact rules — dynamic pullback with the posted tick caps, both stop caps, the two-leg exit with the breakeven shift, end-of-day flat — and ran them on seven years of NQ 1-minute data: 933 filled setups, 1,866 exit legs, conservative fills (on any bar that touches both, the stop is assumed to hit before the target), $14.50 per contract round trip.
For the tables: t (the t-statistic) measures how far an average sits above zero relative to its own noise — |t| above 2 is a real result, between −2 and +2 is noise. PF (profit factor) is gross wins ÷ gross losses; 1.0 is breakeven.
Claimed vs. measured
| Posted (33 trades) | Measured (1,866 legs, 7 years) | |
|---|---|---|
| Win rate | 78.8% | 38.6% |
| Profit factor | 4.39 | 0.93 |
| Net | — | −$24,499 (t = −1.0) |
| Shorts / Longs | — | −$10.6k / −$13.9k (both lose) |
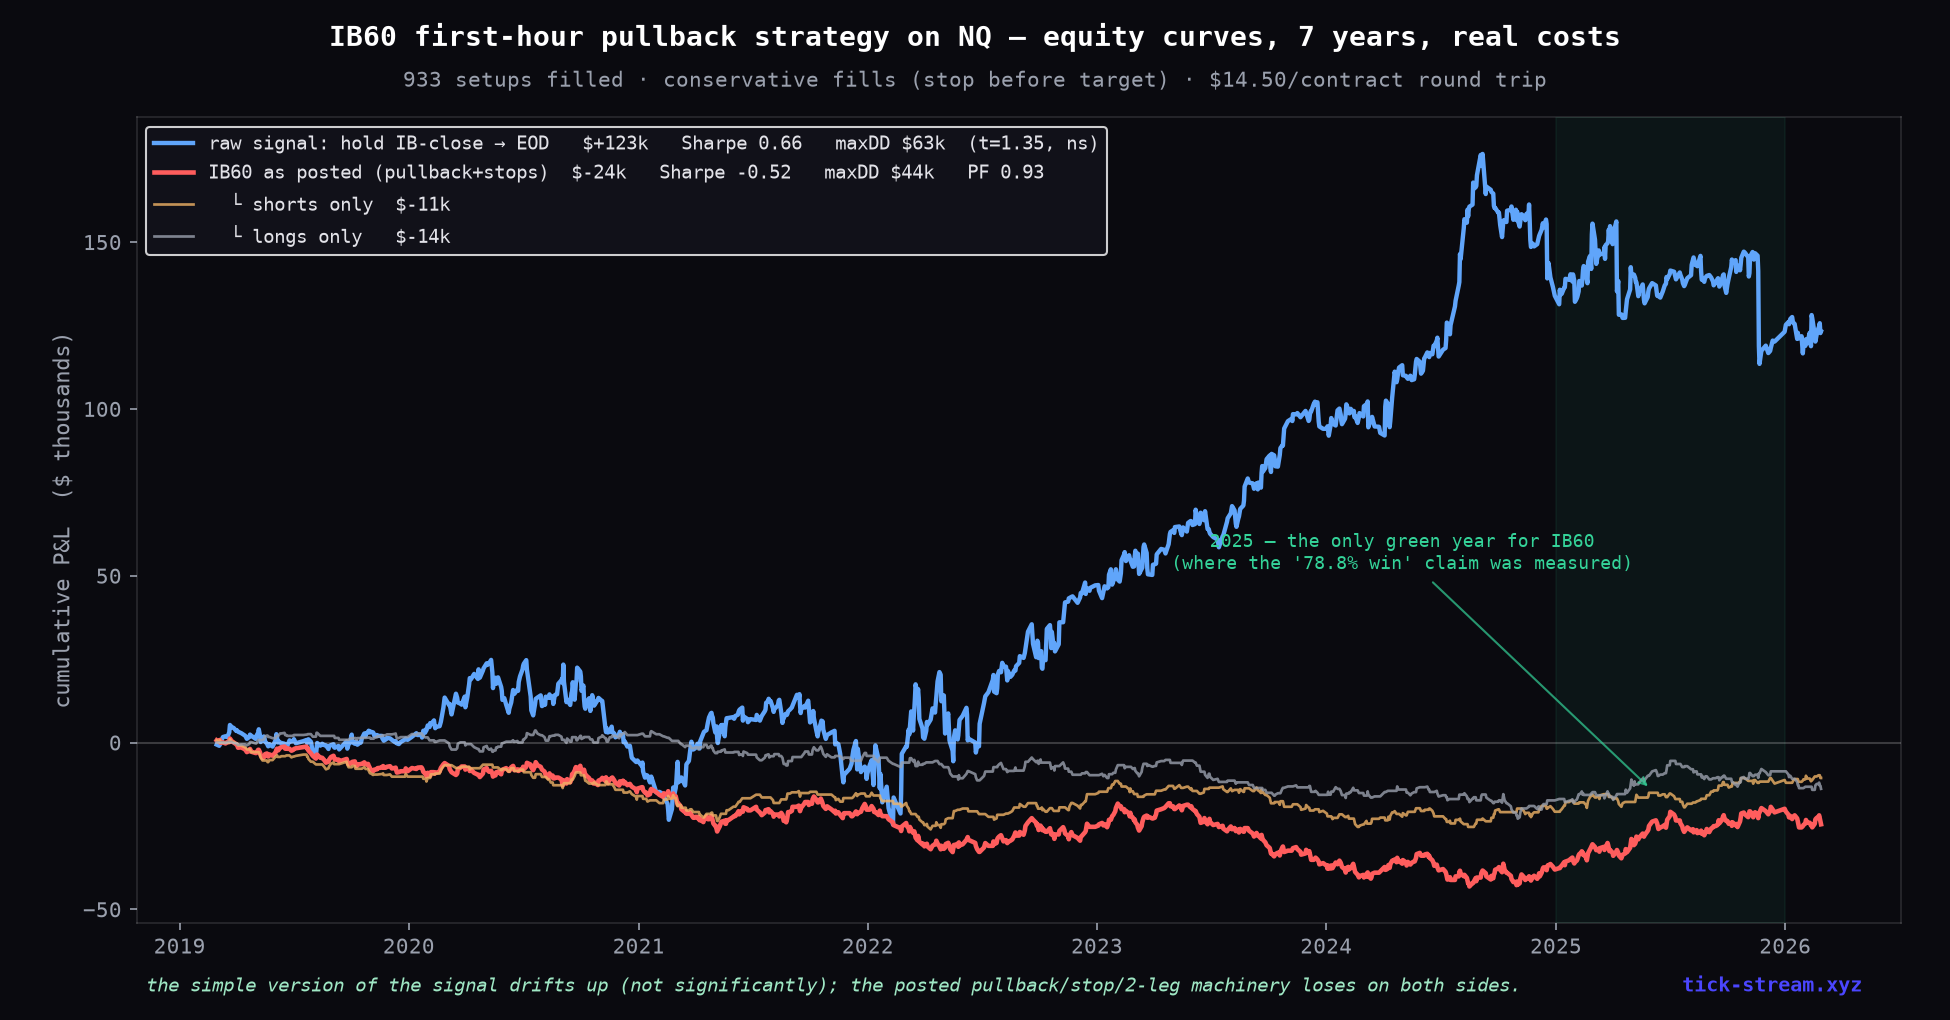
Both directions lose. Every year from 2019 to 2024 loses. And then there’s 2025: the single green year in the whole window (PF 1.35, t = +1.7) — which is exactly where a 33-trade sample collected recently would come from. The poster didn’t measure a strategy; they measured a regime.
The part that’s real — and where it leaks out
Here’s what makes this worth writing up rather than just debunking. The underlying signal is genuinely leaning the right way:
- First hour closes outside the 15-minute opening range → price continues in that direction to the session close 56.2% of the time, mean +6.6 points (t = 1.5).
- The dumbest possible expression — enter at the IB close, hold to the close, no stop, no pullback — made +$123k over 7 years (t = 1.35).
Neither number clears t = 2; this is a thin lean, not a bankable edge. But it’s positive. So how does a positive drift become a −$24.5k strategy? We ran the strategy’s legs without costs: they net $1 per leg. Zero. The mechanics — pullback entry, 30%-of-range stop, 1R base target — consume the entire drift by construction:
- The pullback filter deselects the best trades. The strongest continuation days never pull back 10% of the range — the setup’s biggest winners are precisely the fills you never get.
- The stop lives inside the noise. 30% of a first-hour range on NQ is regularly sub-15-points; ordinary rotation hits it. Win rate: 38.6%.
- The 1R base target caps wins while losses run full size. Asymmetry, the wrong way around.
Costs then turn $0 into −$24.5k. The asker’s instinct was right, and their instrument-hopping was never the problem: 0DTE theta, contracts, futures — a t = 1.5 signal doesn’t survive friction in any wrapper.
The pattern to remember
This is the same anatomy as our opening-range breakout study, one hour later in the day: the continuation kernel is real but thin, the simplest expression of it is the strongest, and every layer of added mechanics — confirmation candles, pullback entries, tight stops, partial targets — subtracts edge while adding win-rate cosmetics. A 78% win rate with a tight stop and 1R target feels like skill; over 933 setups it’s a 0.93 profit factor wearing makeup.
If someone posts a strategy with 33 trades, the only honest response is: come back with 933.
Methodology: NQ 1-minute bars 2019–2026 (ET sessions, 9:30–16:00), opening range 9:30–9:45, initial balance 9:30–10:30, exact posted rules including tick caps (pullback 8–50/8–60 ticks, stops 30–80/20–90 ticks), limit-touch entries, stop-before-target bar resolution, $4.50 commission + 2 ticks slippage per contract round trip, EOD flat. Signal diagnostics measured separately without mechanics.
Frequently asked questions
Does the IB60 first-hour pullback strategy work?
Not as posted. On seven years of NQ 1-minute data (933 filled setups, 1,866 exit legs) the exact rules produced a 38.6% win rate and a 0.93 profit factor — net −$24.5k on one contract with real costs. The claimed 78.8% win rate and 4.39 profit factor came from 33 trades taken in 2025, which happens to be the single profitable year for this strategy in our entire eight-calendar-year window.
Is the first-hour direction signal real?
Yes — and that's the interesting part. When the first hour closes outside the 15-minute opening range, price continues in that direction into the close 56% of the time (mean +6.6 NQ points). But the t-stat is only 1.5 — below the threshold of 2 that separates signal from noise. Simply holding from the first-hour close to the session close earned +$123k over 7 years in our test, but even that is not statistically significant (t = 1.35). It's a real lean, too weak to survive much friction.
Why does the pullback entry make it worse?
Three mechanical reasons. First, waiting for a pullback means the best trades — the ones that run immediately — fill you never or fill you late. Second, the tight stop (30% of the first-hour range) sits inside ordinary intraday noise, so it gets hit constantly: the win rate drops to 38.6%. Third, the 1R base target caps your winners while the stop still takes full losses. Gross of costs the machinery nets almost exactly $0 — it converts a weak positive drift into breakeven, and costs make it a loser.
How can a strategy show a 78% win rate in someone's backtest and 39% in yours?
Sample size and regime. 33 trades is about three months of setups; our test has 933 fills across eight calendar years. 2025 was the strategy's only green year (PF 1.35 in our data) — a favorable chop regime for pullback entries. Measure any strategy only inside its best regime and the numbers flatter it. There may also be fill optimism: intrabar entries and targets that assume the limit filled and the stop didn't, which our conservative engine (stop checked before target on every bar) refuses to assume.
What should you do instead of the IB60 mechanics?
If you want exposure to the first-hour continuation effect, the simplest expression was the strongest in our test: enter at the first-hour close in the breakout direction, hold to the session close, no pullback, no tight stop. It made +$123k over 7 years in our test — though still statistically weak (t = 1.35), so size accordingly. Our earlier opening-range study found the same pattern: breakout-and-hold carries the thin real edge; added mechanics subtract from it.