We Ran 3,000 Combinations of an ICT Asian-Session Strategy. The Best One Is Exactly What Noise Looks Like.
Mark the 6-7pm range, wait for one side to get taken, then trade the reversal toward the other side. It is one of the most-taught setups in the ICT world. We tested it on seven years of Nasdaq futures — not once, but across 3,000 parameter combinations, a walk-forward over every year, and 120 null runs where the rule was deliberately made false. The best combination reached t = +2.29. Pure noise reaches that in 18% of runs, using a quarter of the search. The walk-forward lost $22,598.
The rule, as it is usually taught:
Mark out the highest high and the lowest low that forms between 6pm and 7pm. Once we reach 7pm, wait to see if buy side or sell side is taken within that range. If the buy side’s taken, you target sell side. If the sell side’s taken, you target buy side. Wait for three PDAs or three signatures that tell you price is getting ready to reverse. Then take your trade and target the opposing liquidity and targets beyond.
It is clean, it is mechanical enough to test, and it is everywhere. We have seven years of Nasdaq futures at tick resolution, so we tested it — and then we tested it the way a claim with this many adjustable parts actually has to be tested.
The short version: traded as described it makes money, and that money is indistinguishable from what searching produces on its own.
First, the base rate nobody quotes
The 18:00–19:00 ET range on NQ has a median width of 28.5 points. Between 19:00 and the New York open there are roughly fourteen hours of trading left.
In that window, both sides of the range get taken in 66.7% of all sessions. Only the high: 19.8%. Only the low: 13.1%. Neither: 0.5%.
So “price reaches the opposing liquidity” is not a forecast. It is a description of what a narrow range does over a long night. Any rule built on it starts with a two-in-three tailwind that has nothing to do with the rule.
Given the high is swept first, the low is reached later 62.9% of the time. Given the low is swept first, the high is reached 71.7%. Both numbers look impressive next to a coin flip and mean nothing next to 66.7%.
Trading it honestly
Every fill in this article is deliberately pessimistic. Entry at the close of the bar that triggers, never at the level. Stops fill first whenever a single bar could have hit both stop and target. No target can fill on the entry bar. Every exit pays two ticks of slippage, every round turn pays $14.50.
The discretionary part — “three PDAs or three signatures” — cannot be tested as written, so we used the only mechanical reading available: n consecutive closes back inside the range before entry. That is what “price is getting ready to reverse” looks like when you have to write it down.
Traded that way, with a stop half a range-width behind the sweep extreme and a target two range-widths beyond the opposite side:
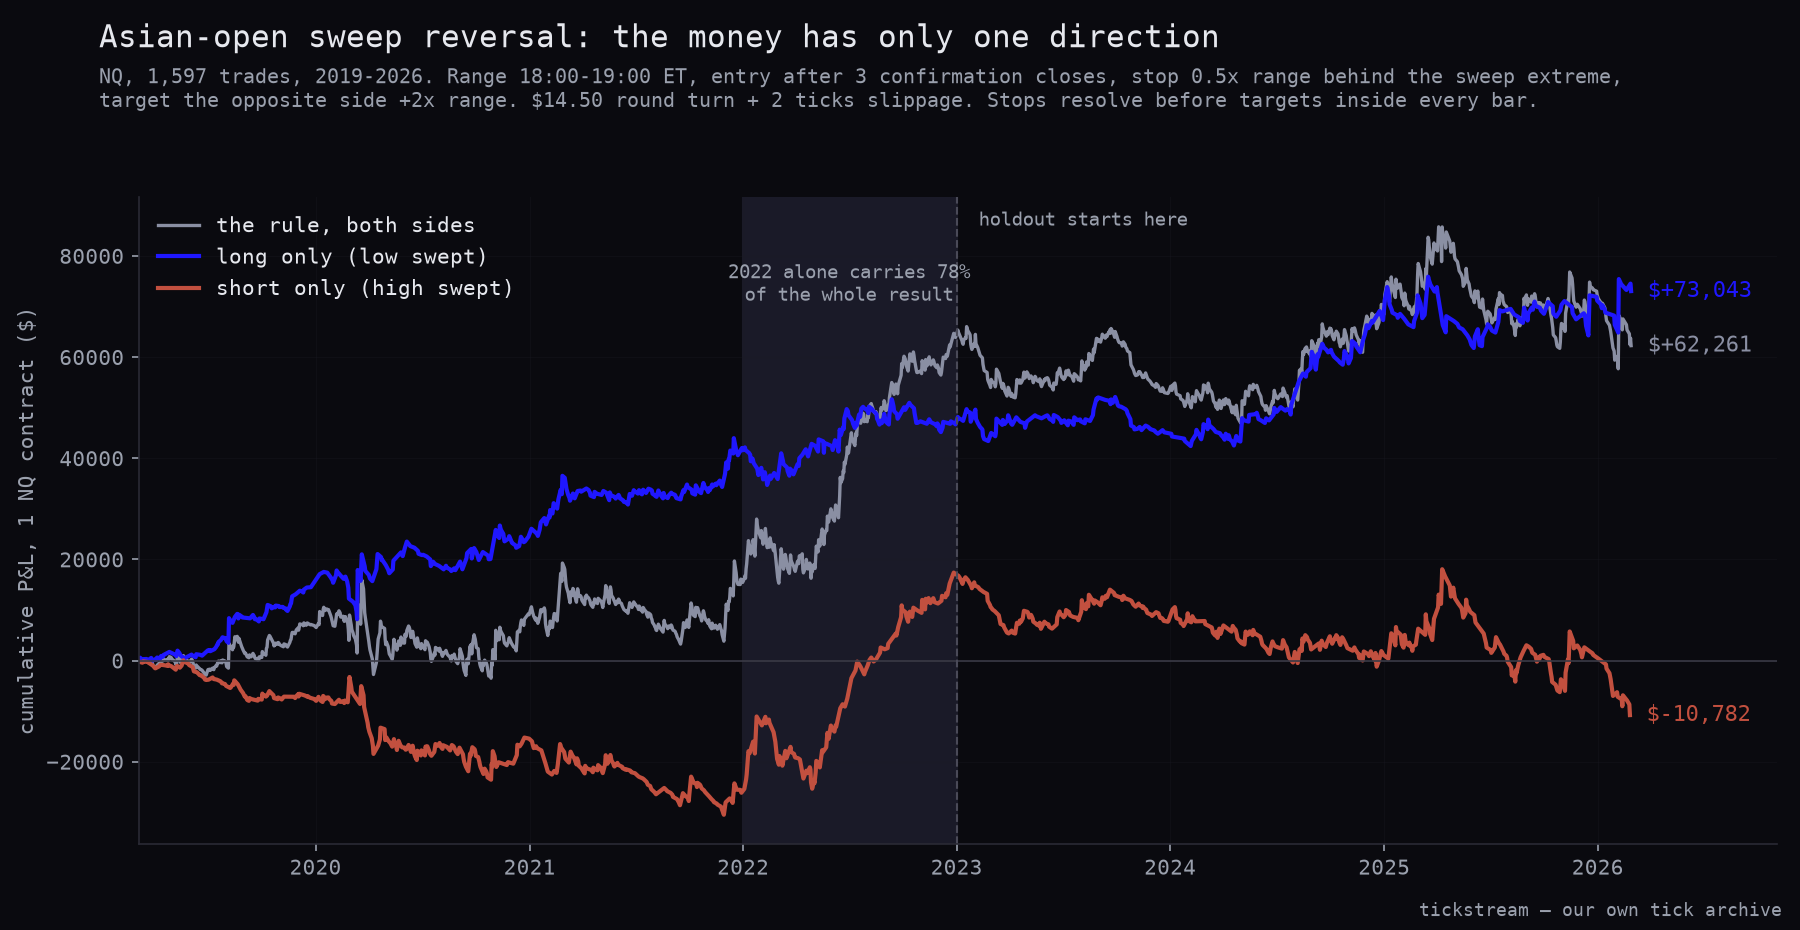
$62,261 per contract, 1,597 trades, t = +1.29. A reasonable person stops here and calls it an edge.
Three things say otherwise, and they are visible in that chart.
2022 alone carries 78% of it. Remove one year from seven and $62,261 becomes $13,820 at t = +0.32.
The holdout is empty. Choosing parameters on 2019–2022 only and then applying them once to 2023–2026 gives $2.70 per trade at t = +0.06.
Only one direction earns. The long side — low swept, buy the reversal — makes $97.30 per trade. The short side loses $12.70. The rule is stated symmetrically; the result is not. That asymmetry is the fingerprint of drift capture in an index that rose for seven years, and it is the same pattern we found when we tested RSI2 mean reversion, where the short side is likewise dead.
We also checked the obvious rescue: going with the sweep instead of fading it. That loses too, at −$8 per trade. There is no inverted version to salvage.
Then someone asked the right question
A single backtest of a rule with six adjustable parts is not a test. It is one draw from a large space, and if you drew it after looking at the data, it is not even that.
So: the full factorial. Range start hour 17:00 through 21:00, duration 30 / 60 / 120 minutes, confirmation closes 0 / 1 / 2 / 3 / 5, stop buffer at five widths, target extension at four distances, fade or continuation. 3,000 configurations, 2,392 of which produce enough trades to measure.
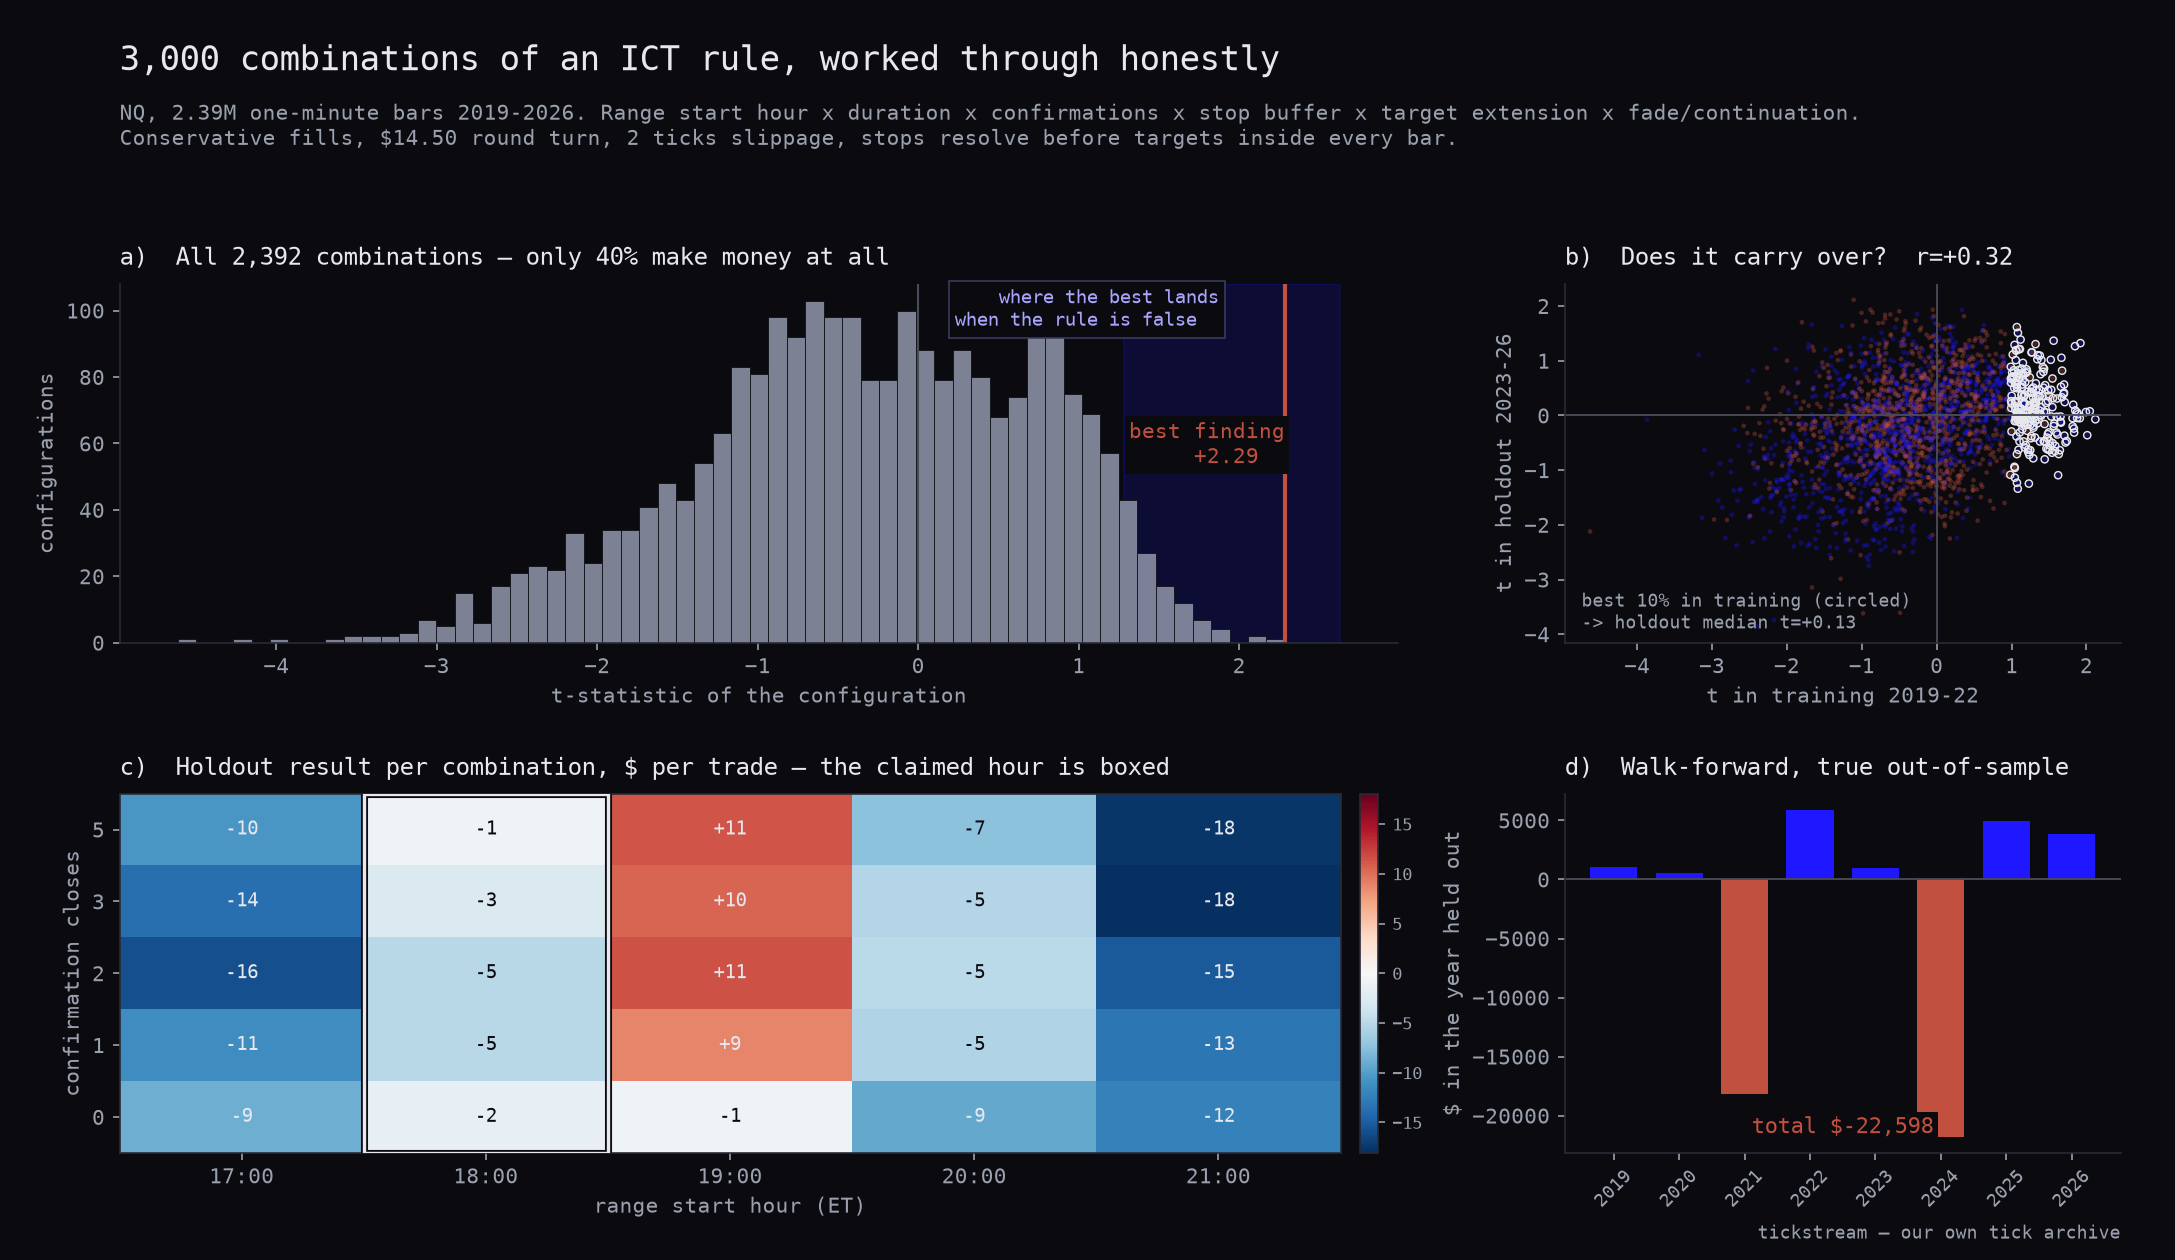
Only 40.5% of all combinations make money at all — worse than a coin flip. The median t is −0.31. The best of all 2,392 reaches t = +2.29, and not a single one clears t = 3.
Then the honest version of parameter selection: for each year, choose the best configuration on the other six years, then apply it once to the year that was held out. Eight independent out-of-sample tests.
2019  train t=+2.27  ->  OOS  $  1,048     2023  train t=+2.31  ->  OOS  $    999
2020  train t=+2.09  ->  OOS  $    558     2024  train t=+2.19  ->  OOS  $-21,774
2021  train t=+2.21  ->  OOS  $-18,144     2025  train t=+2.24  ->  OOS  $  4,937
2022  train t=+2.04  ->  OOS  $  5,886     2026  train t=+2.21  ->  OOS  $  3,892
Total: −$22,598, t = −0.76. The best search you can run, applied without hindsight, loses money.
Note which configuration wins each year: 19:00, then 20:00, then back to 19:00, fade one year and continuation the next. A rule that keeps changing its mind about which hour matters is not describing the market.
The measurement that settles it
Here is the part that matters beyond this one strategy.
A t-statistic of +2.29 sounds like evidence because we are trained on the idea that t > 2 is significant. That intuition holds for one test. It is meaningless after 2,392.
So we measured the alternative directly. Take the same market, the same trade geometry, the same conservative fills, the same search — and destroy only the claim. Each night draws its range hour at random, so the level no longer means “the Asian open” to anyone. Everything real stays real; only the premise is false. Then run the search again and keep the best result it finds. 120 times.
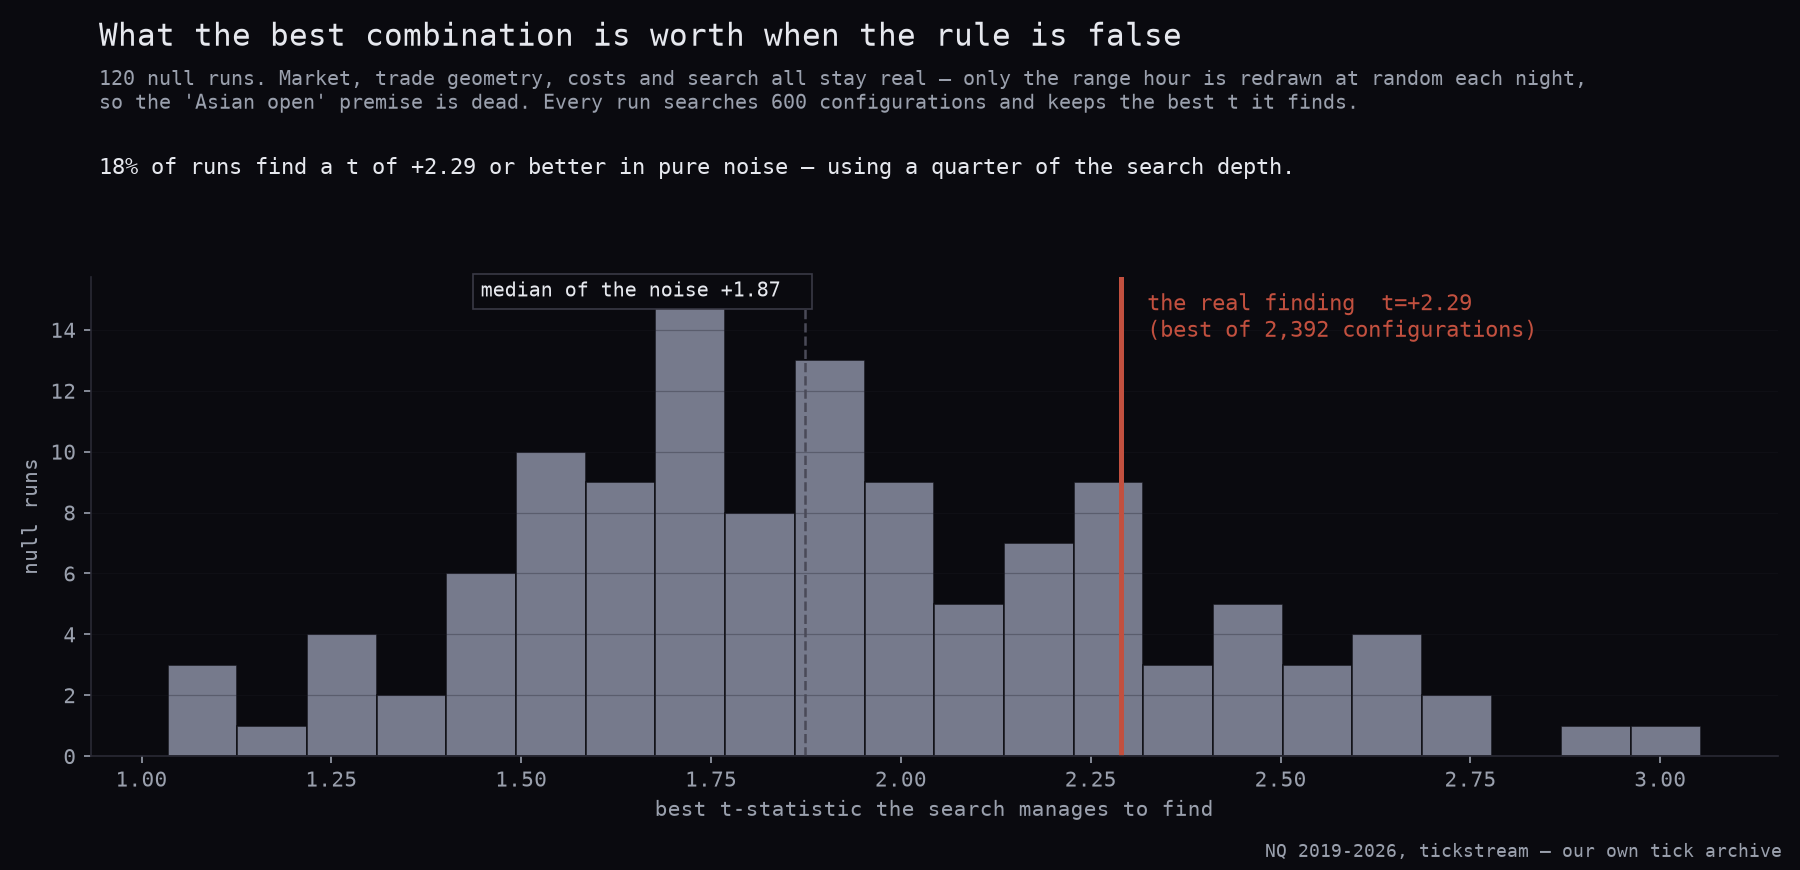
When the rule is false, the search still finds a best t of +1.87 in the median, ranging from +1.28 to +2.63, topping out at +3.05. And 18% of those runs reach +2.29 or better — using 600 combinations, a quarter of the search depth that produced the real result.
The real finding does not sit above the noise. It sits inside it, and once you account for having searched four times harder, it sits below what noise alone would have handed us.
That is the whole verdict, and it needed no opinion about ICT to reach.
Where we are being fair to the rule
Two honest caveats, because the numbers show both.
The correlation between training and holdout is +0.32, not zero. Configurations that do well in the first four years do somewhat better in the last four. But look at what that persistence is worth: the top 10% of configurations by training performance earn $6.20 per trade out of sample, at a median t of +0.13. The persistence is mostly the losers staying losers — continuation setups and awkward stop distances that fail in both halves. Real structure, no money in it.
The waiting genuinely does something. With no confirmation the win rate is 5.6%; with three confirmation closes it is 42%. That is a large, real effect — but it is about not entering directly into a running move, which changes where your stop can sit. It makes the trade survivable. It does not make the direction right.
And one mistake of ours worth publishing: the first version placed the stop two ticks behind the sweep extreme of a one-minute bar, which puts it essentially at the entry price. That produced a 5.6% win rate and looked like a dead strategy. It was a dead stop. Anyone testing sweep reversals should parameterise the stop buffer as a fraction of the range and show the whole surface, because a single arbitrary choice can kill a real effect just as easily as it can manufacture a fake one.
The transferable part
Most published trading rules have this shape: a session window, a level, a trigger, a confirmation, a stop, a target. That is six knobs, and six knobs is a few thousand combinations.
At that search depth, a t-statistic around 2.3 is the expected maximum even when nothing is there. Not a lucky outlier — the expectation. Which means any backtest of a multi-knob rule that reports “t = 2.1, statistically significant” without saying how many variants were tried has reported nothing at all.
The fix is cheap and we would rather it spread than any particular result of ours: break the claim on purpose, keep everything else, re-run the identical search, and see what it finds. If your discovery lives inside that distribution, you have measured your own searching.
Method: NQ continuous front month, 2019-03-01 to 2026-02-27, 2.39 million one-minute bars built from our own tick archive. Session dates follow the CME convention where the 18:00 ET open belongs to the next day. All times are true New York time with daylight saving applied per date. Costs $14.50 round turn plus two ticks of slippage on every exit; stops resolve before targets within any bar; no entry and exit share a bar. Null distribution: 120 runs × 600 configurations, range hour resampled per session.
The tick data behind this is the same historical futures data we sell, and the free GEX levels run on the same infrastructure. Nothing here is financial advice.
Frequently asked questions
Does the ICT Asian-session sweep strategy work?
Not on NQ over 2019-2026. Traded as described it made $62,261 per contract over seven years, but 78% of that came from a single year, only the long side earned anything, and a walk-forward that chose parameters honestly out of sample lost $22,598. Across 2,392 valid parameter combinations, only 40.5% were profitable at all.
What is the 6pm-7pm range in ICT?
The high and low formed between 18:00 and 19:00 New York time, at the start of the Asian session. The rule says that after 19:00 you wait for one side of that range to be taken, then trade the reversal targeting the opposite side. We tested exactly that, plus range start hours from 17:00 to 21:00 and durations of 30, 60 and 120 minutes.
Why does a t-statistic of 2.29 not count as evidence?
Because it came from searching 2,392 combinations. We measured the null directly: scramble which hour each night uses, so the rule is false by construction, then run the same search. The best result it finds has a median t of +1.87 and reaches +2.29 or better in 18% of runs — with only 600 combinations. At that search depth, t around 2.3 is the expected maximum, not a discovery.
Is there anything in the rule that does work?
Two things, neither of them the rule. Waiting for confirmation after the sweep raises the win rate from 5.6% to 42%, but that is stop placement, not direction. And the long side earns $97 per trade while the short side loses $12.70 — an asymmetry that tracks the overnight drift in an index that rose for seven years, not a symmetric edge.