The Leveraged-ETF Rotation Backtest That Turns $100k Into Billions — And Why You Can't Trade It
Leveraged-ETF rotation 'symphonies' — daily RSI/SMA bots flipping between TQQQ, SOXL and volatility hedges — are everywhere on retail trading forums, and their backtests look unreal. We ported one to our engine and ran it on 13 years of real data with real costs. It turns $100k into $5.5 billion. Here's exactly why that's a red flag and not an edge, and what a tradable version would look like.
Open any algo-trading forum and you’ll find them: leveraged-ETF rotation “symphonies.” Daily bots that read RSI and moving averages, then flip a portfolio between TQQQ (3x Nasdaq), SOXL (3x semis), TECL (3x tech) and a basket of volatility and bond hedges. The backtests look like nothing else in finance — smooth, relentless, up-and-to-the-right curves that turn a small account into a fortune. Someone shared one with us and asked the honest question: is it worth pursuing?
So we took the exact strategy — a four-bot RSI/SMA ensemble — ported it into our backtest engine, and ran it on 13 years of real, dividend-adjusted ETF data with real costs, instead of the one year with zero slippage it shipped with. Here’s what we found, and what’s actually true.
The backtest turns $100k into $5.5 billion
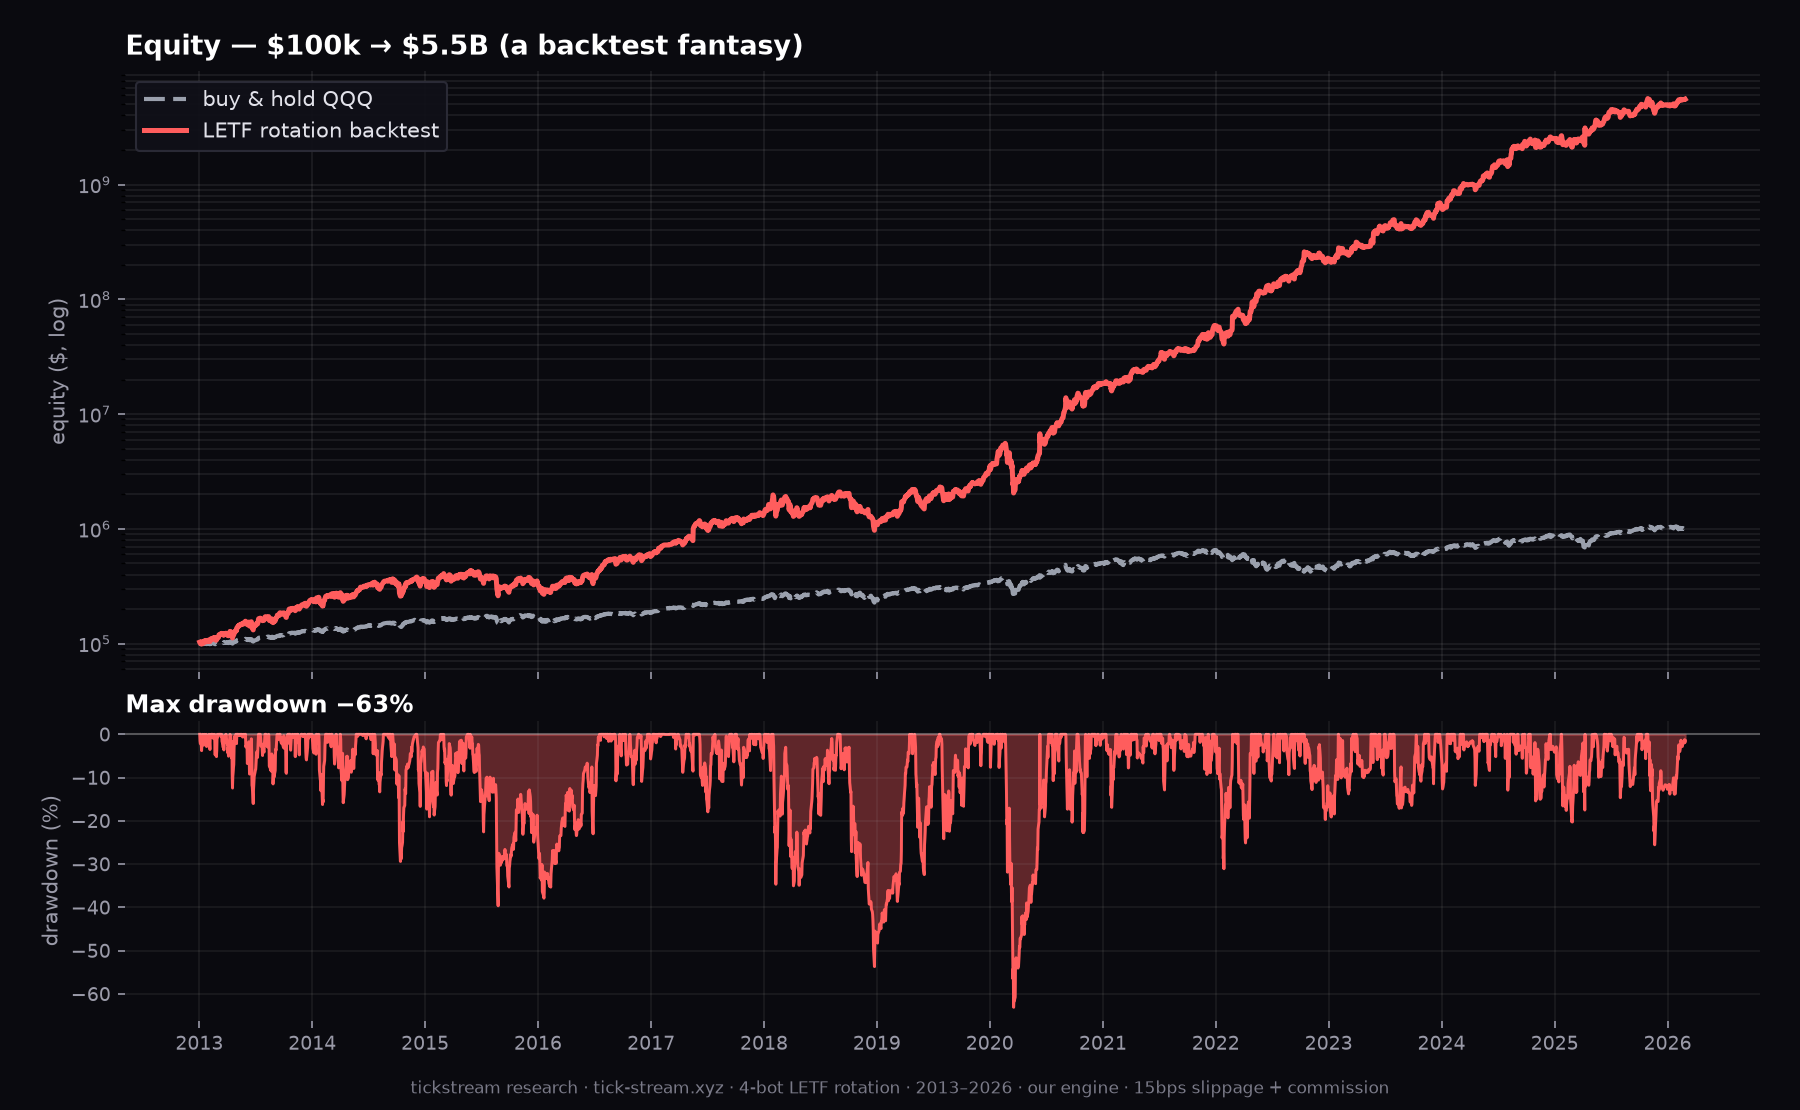
That’s not a typo, and it’s not a bug. Run faithfully on real prices, the strategy compounds at about 129% per year over 2013–2026. We had to plot it on a log scale because on a linear axis buy-and-hold QQQ — which itself 10x’d — is a flat line at the bottom.
Your first instinct should be the correct one: a backtest that turns $100k into billions is a red flag, not an edge. No fund in history has compounded at triple digits for a decade. So where does the number come from — and is the strategy “good” or not?
It’s not a bug — it’s just unrealizable
We checked carefully: there’s no lookahead, no calculation error. The rules, applied to real split/dividend-adjusted prices with whole-share rebalancing and commissions, genuinely produce this. The backtest is correct. It’s just not achievable, for three concrete reasons:
- Capacity. The strategy rebalances the entire book into 3x leveraged ETFs every single day. On $100k in a simulator, fine. At any real size, you can’t get filled in TQQQ/SOXL/SVIX daily without moving the price against yourself. The edge evaporates as you scale — the strategy’s own “estimated capacity” would be tiny.
- Leveraged beta plus survivorship. TQQQ rose roughly 70x over the period. Being concentrated-long the exact leveraged ETFs that mooned, through the biggest tech bull in history, produces fantasy compounding. That’s not skill — it’s 3x exposure to a one-way market.
- Overfitting. Look at the thresholds: RSI above 79, 80, 81; a 202-day moving average (why 202?); a −12% 60-day filter. These are hand-tuned to this specific history. Forward, they don’t replicate.
And here’s the tell that it isn’t even a slippage problem: we re-ran it at progressively brutal costs.
slippage   compounding annual return   end equity
   0 bps            +150% / yr           $17.7 B
   5 bps            +143% / yr           $12.0 B
  15 bps            +129% / yr           $5.5 B
  30 bps            +110% / yr           $1.8 B
  50 bps             +83% / yr           $293 M
Even at a punishing 50 bps per trade it still “makes” 83% a year. The returns are so large that the problem isn’t the fills — it’s capacity and compounding fantasy.
Every year is absurd — and it bleeds in the off-years
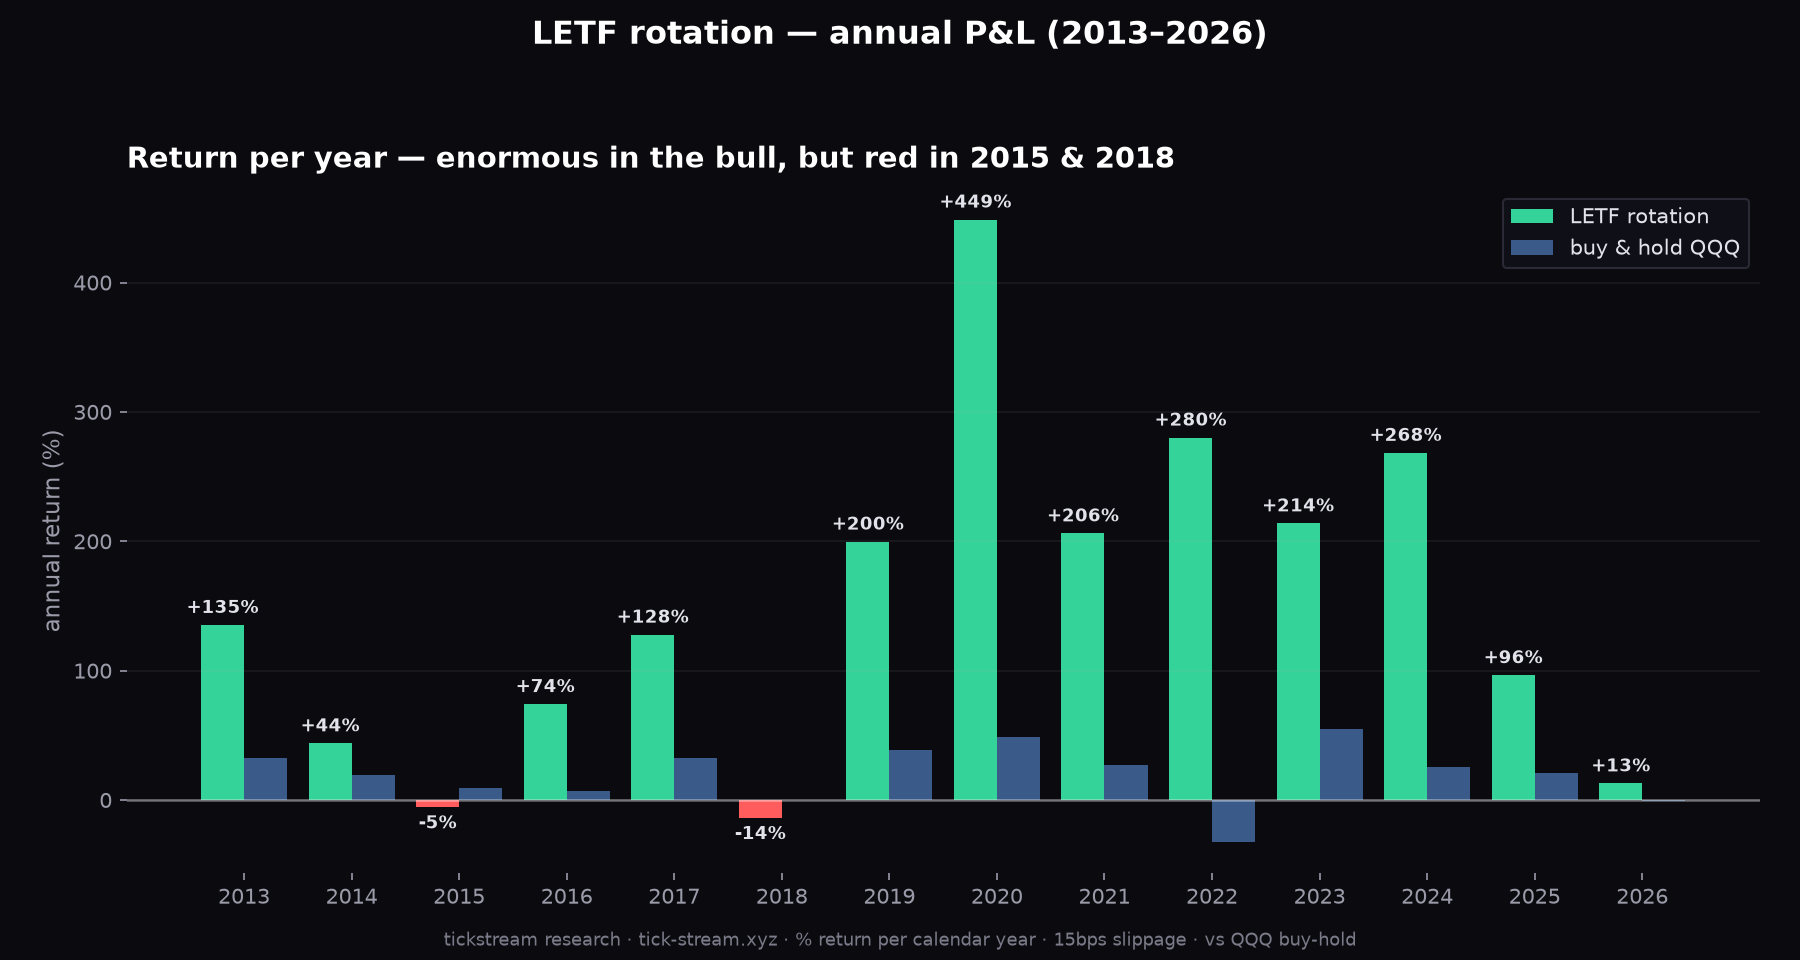
Year by year, the returns aren’t just good — they’re impossible to sustain: +135%, +200%, +449% in 2020, +280% in 2022. That’s the signature of leveraged beta, not a repeatable edge. And notice the cracks: it was red in 2015 and 2018 — the years without a clean V-shaped recovery, when leverage cuts the other way.
The summary looks like a dream — until you read two lines
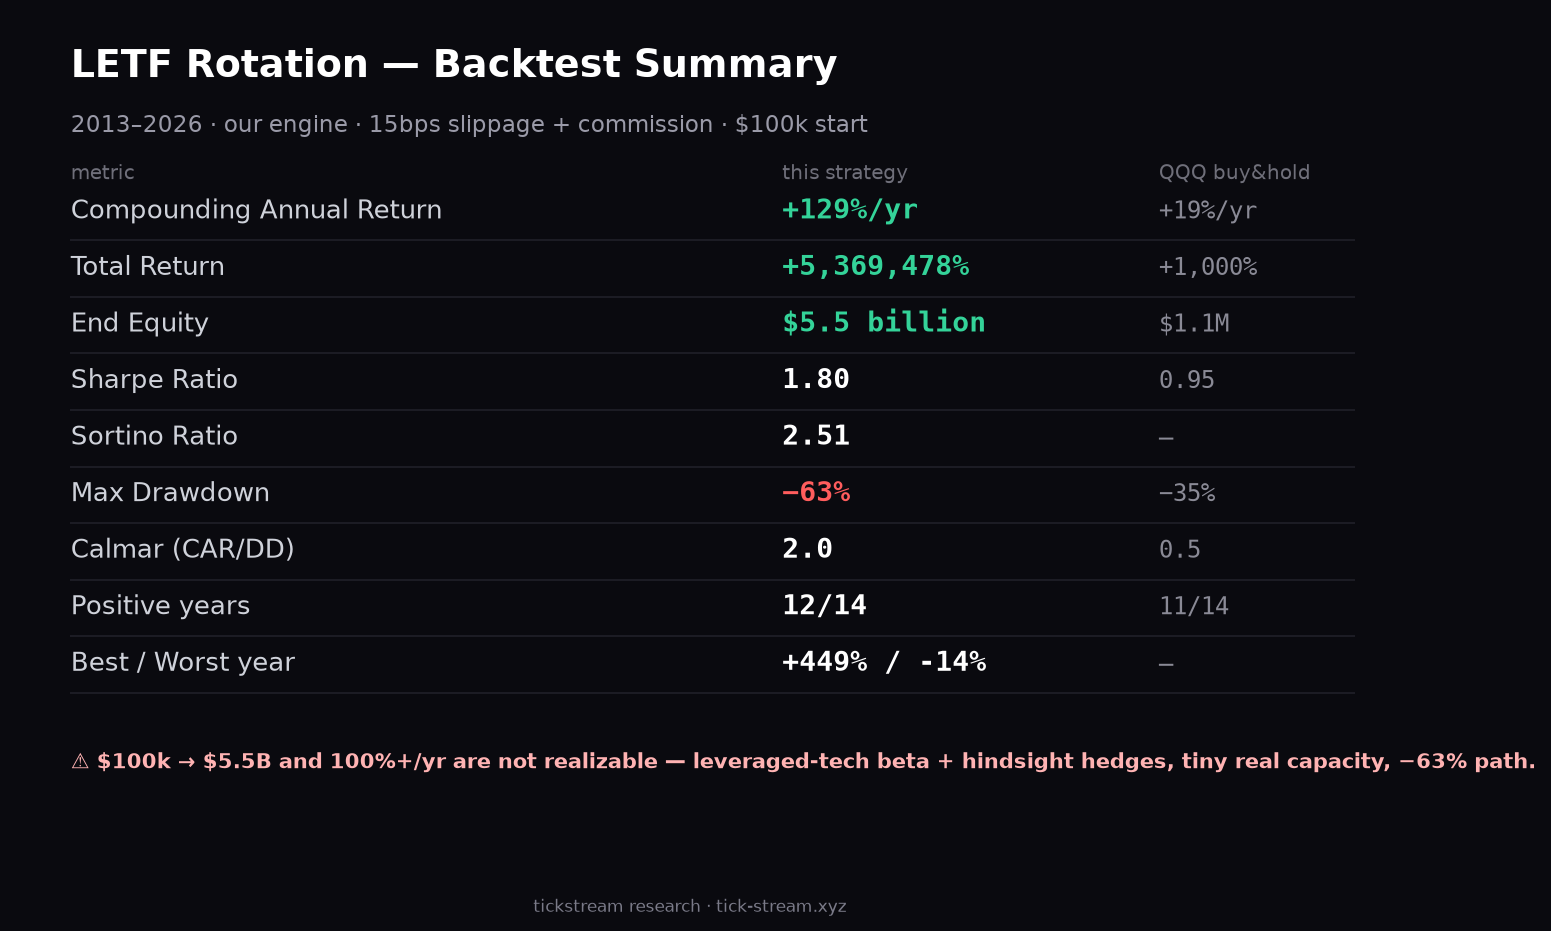
Sharpe 1.80, Sortino 2.51, Calmar 2.0, 12 of 14 years positive. On a metrics sheet, it looks unbeatable. Then you read End Equity: $5.5 billion and Max Drawdown: −63% and the spell breaks. A −63% drawdown is worse than simply holding QQQ (−35%), and almost nobody can sit through losing two-thirds of their account — least of all when the account is a large, leveraged number.
So is the strategy “successful”? Real, but overstated
Be fair to it: on a risk-adjusted basis it does beat buy-and-hold on paper — Sharpe 1.8 versus QQQ’s 0.95, Calmar 2.0 versus 0.5. The risk-on/risk-off rotation genuinely improved drawdown-per-unit-of-return compared with just holding 3x. That part isn’t nothing.
But the “success” is mostly leveraged tech beta in a historic bull, plus hindsight hedges — the volatility and managed-futures positions were added precisely because they would have helped in 2020 and 2022. It’s never been tested in a regime it wasn’t built on. The honest forward expectation is a small fraction of the backtest, with deep drawdowns and real tail risk (it holds short-volatility ETFs, which can halve in a day).
What a tradable version would look like
The idea — be aggressive in uptrends, defensive in downtrends — is sound. It’s the implementation that turns it into a backtest toy. A tradable version strips the toy parts:
- Drop or cap the leverage. Trade QQQ/SPY at 1x, not TQQQ/SOXL at 3x. That removes the daily-rebalancing decay and the short-vol blow-up risk — and makes the result something you can actually scale.
- Simplify the rules. One trend filter plus one risk-off switch, not four bots and thirty thresholds. The real edge is just the regime call; the rest is curve-fit.
- Validate out-of-sample. Build the rules on 2008–2018, then test untouched on 2019–2025. If it survives that, it’s real. If it falls apart, it was fit to the bull.
- Set honest expectations. Aim for ~15–25% annual return with 20–30% drawdowns. That’s a genuinely good, real trend/risk-on strategy — not 129% a year.
The bottom line
The backtest isn’t fake and the strategy isn’t worthless — but the headline is fantasy. It’s a faithful-but-unrealizable simulation of leveraged-tech beta with hindsight hedges and overfit thresholds, carrying a 63% drawdown and no proof it survives a real crisis. If a backtest turns $100k into billions, that’s the single strongest signal it won’t hold live. Strip out the leverage, the complexity and the hindsight, validate it on data it wasn’t built on, and you might have something you can actually trade — at a fraction of the returns, and all the more believable for it.
Methodology: a faithful port of the four-bot RSI/SMA rotation engine, run on real split/dividend-adjusted daily ETF prices (37 tickers, AV-sourced), 2013–2026, with whole-share rebalancing, commission and 0–50 bps slippage tested. Buy-and-hold QQQ as the control. Pre-2013 (dot-com, 2008) requires synthesizing the leveraged ETFs from their underlying indices — a separate acid test.
Frequently asked questions
Why does the leveraged-ETF rotation backtest show such huge returns?
Because it holds 3x leveraged tech ETFs (TQQQ, SOXL, TECL) through the largest tech bull market in history, and rebalances daily into whichever ones are running. On 13 years of real data with real costs it compounds at ~129% per year — turning $100k into about $5.5 billion. That number isn't a bug; it's faithful math applied to real prices. But it's unrealizable: it's leveraged beta plus hindsight-chosen hedges, with a 63% drawdown, and no fund in history compounds at triple digits for a decade.
Is the backtest fake or just unrealistic?
Neither a bug nor achievable. We ported the exact rules and ran them on real, split/dividend-adjusted ETF prices with whole-share rebalancing and commissions — no lookahead, no calculation error. The numbers are correct. They're just not realizable, for three concrete reasons: capacity (you can't daily-rebalance size into 3x ETFs without moving them), survivorship (the specific ETFs went up 50–100x), and overfitting (the thresholds are tuned to this exact history). The backtest doesn't lie by math — it lies by omission.
Why can't you actually trade a strategy like this?
Four reasons. Capacity: daily rebalancing into leveraged ETFs works on $100k in a sim but dies at real size. Leveraged beta: most of the 'edge' is simply being 3x long tech in a historic bull, not skill. Overfitting: RSI thresholds of 79/80/81 and a 202-day SMA are curve-fit and won't repeat forward. And the path: a 63% maximum drawdown that almost no one can hold — worse than just holding QQQ — plus it's never been tested in a crisis (2008, the dot-com bust) where its volatility hedges didn't even exist yet.
Are leveraged-ETF rotation strategies (Composer symphonies) worth using?
Be very skeptical. On paper this one beat buy-and-hold on risk-adjusted terms (Sharpe 1.8 vs 0.95), so the risk-on/risk-off rotation idea isn't worthless. But the eye-popping headline returns are a backtest artifact of leverage, survivorship and overfit thresholds — and the genre almost universally underperforms its backtest forward, because the rules are fit to a known history and the hedges are chosen with hindsight. If a backtest turns $100k into billions, that's the strongest possible signal it won't hold live.
What would a tradable version look like?
The idea — rotate risk-on in uptrends, defensive in downtrends — is sound. The tradable version strips the toy parts: drop or cap the leverage (trade QQQ/SPY 1x, not 3x, to kill the decay and tail-blowup risk), simplify to one trend filter plus one risk-off switch instead of four bots and thirty thresholds, validate out-of-sample (build the rules on 2008–2018, test on 2019–2025), and set honest expectations: ~15–25% annual return with 20–30% drawdowns, not 129% a year.