Is Market Entropy 'More Important Than the VIX'? We Tested Shannon Entropy on 98 Years of the S&P 500
A viral thesis says Shannon entropy measures whether the market is 'losing structure' — spiking in every crisis, telling you when to hedge, possibly beating the VIX. We computed it on 24,700 days of S&P data and asked the only questions that matter: does it replicate, is it different from volatility, and does it predict anything? One of those three answers is yes — and it's not the one the pitch needs.
The pitch is seductive because it’s half-humble: entropy doesn’t predict tomorrow, it measures whether the market is “losing structure” — it spiked in every major crisis, it tells you when to trust your models less, when to hedge, when to run beta. Possibly more important than the VIX. We’re building it into our terminal.
Unlike most indicator folklore, this one comes with a paper screenshot and a precise definition family (normalized Shannon entropy). So we computed it — on 24,700 trading days of the S&P 500 (1928–2026) — and asked the three questions that decide whether any new indicator earns a slot: does the flagship claim replicate, is it different from what we already have, and does it predict anything?
Claim 1: “Entropy spiked in every crisis” — depends entirely on the definition
We used the standard construction: normalized Shannon entropy of daily returns over a rolling 60-day window (8 histogram bins). The two flagship episodes:
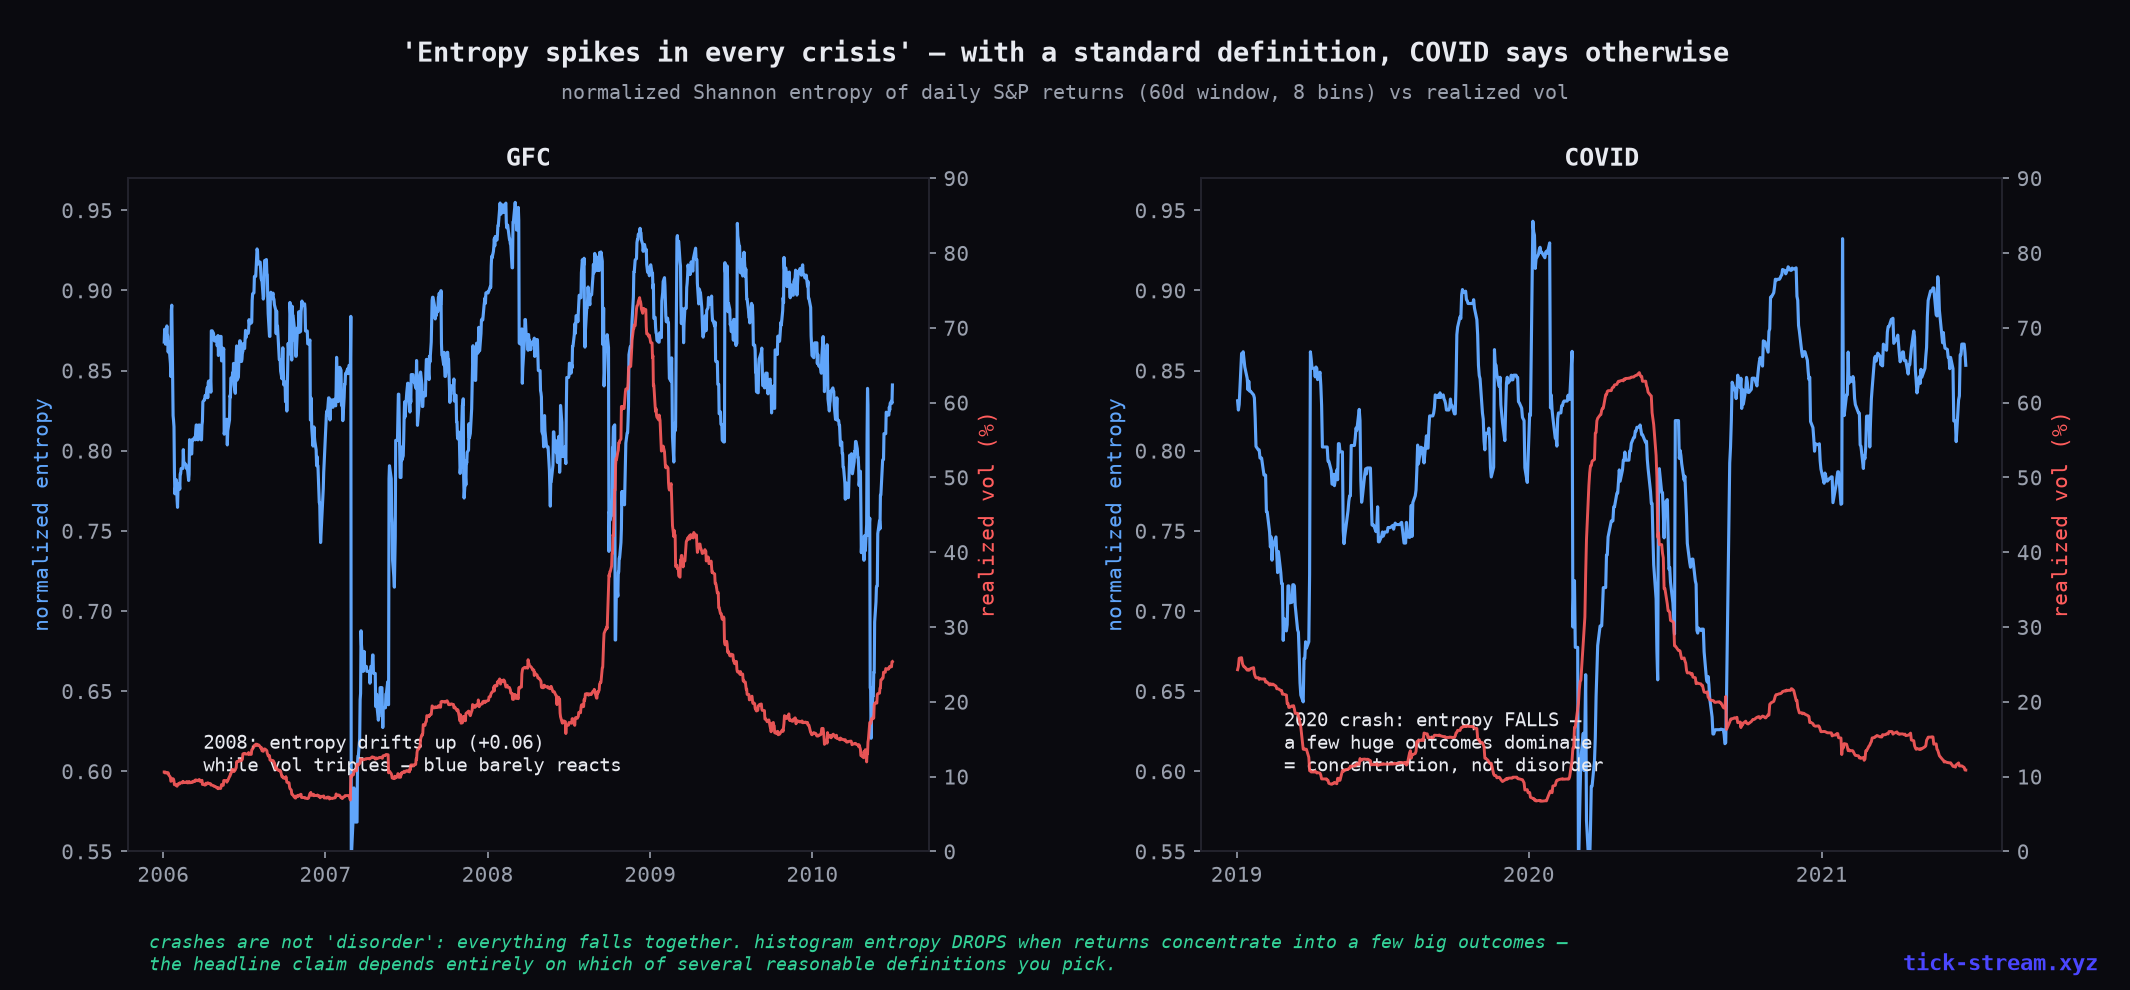
- 2008: entropy drifts up +0.06 while realized volatility triples. Directionally consistent with the paper — but a whisper, not a spike.
- 2020: entropy falls during the crash.
The 2020 result isn’t a bug — it’s the tell. Histogram entropy measures how evenly spread outcomes are. A crash is the opposite of evenly spread: a few enormous down-days dominate the distribution. Crashes are concentration, not disorder — everything falls together. Whether entropy rises or falls in a crisis depends on which of several equally reasonable definitions you pick, which is fatal for a “one gauge to watch” product. (The paper’s exact numbers use its own Definition 3; ours is the textbook construction. When a signal’s sign flips between textbook definitions, the signal is the definition.)
Claim 2: “Same volatility, different structure” — actually true
Credit where due: across the full century, histogram entropy correlates −0.22 with realized volatility (permutation entropy: +0.08). It is not vol in a costume — it genuinely measures the shape of the return distribution rather than its width. Most “new” indicators we test are 0.9-correlated rebrands of something old; this one isn’t. One claim survives.
Claim 3: the one that matters — does it predict anything?
An indicator earns its place by knowing something about the future. Rank IC against the next month’s realized volatility — the exact thing an instability gauge should warn about:
| Signal | IC vs next-month vol |
|---|---|
| Plain realized vol (the boring baseline) | +0.69 |
| Histogram entropy | −0.04 |
| Permutation entropy | +0.05 |
| Entropy residual (vol removed) | +0.11 |
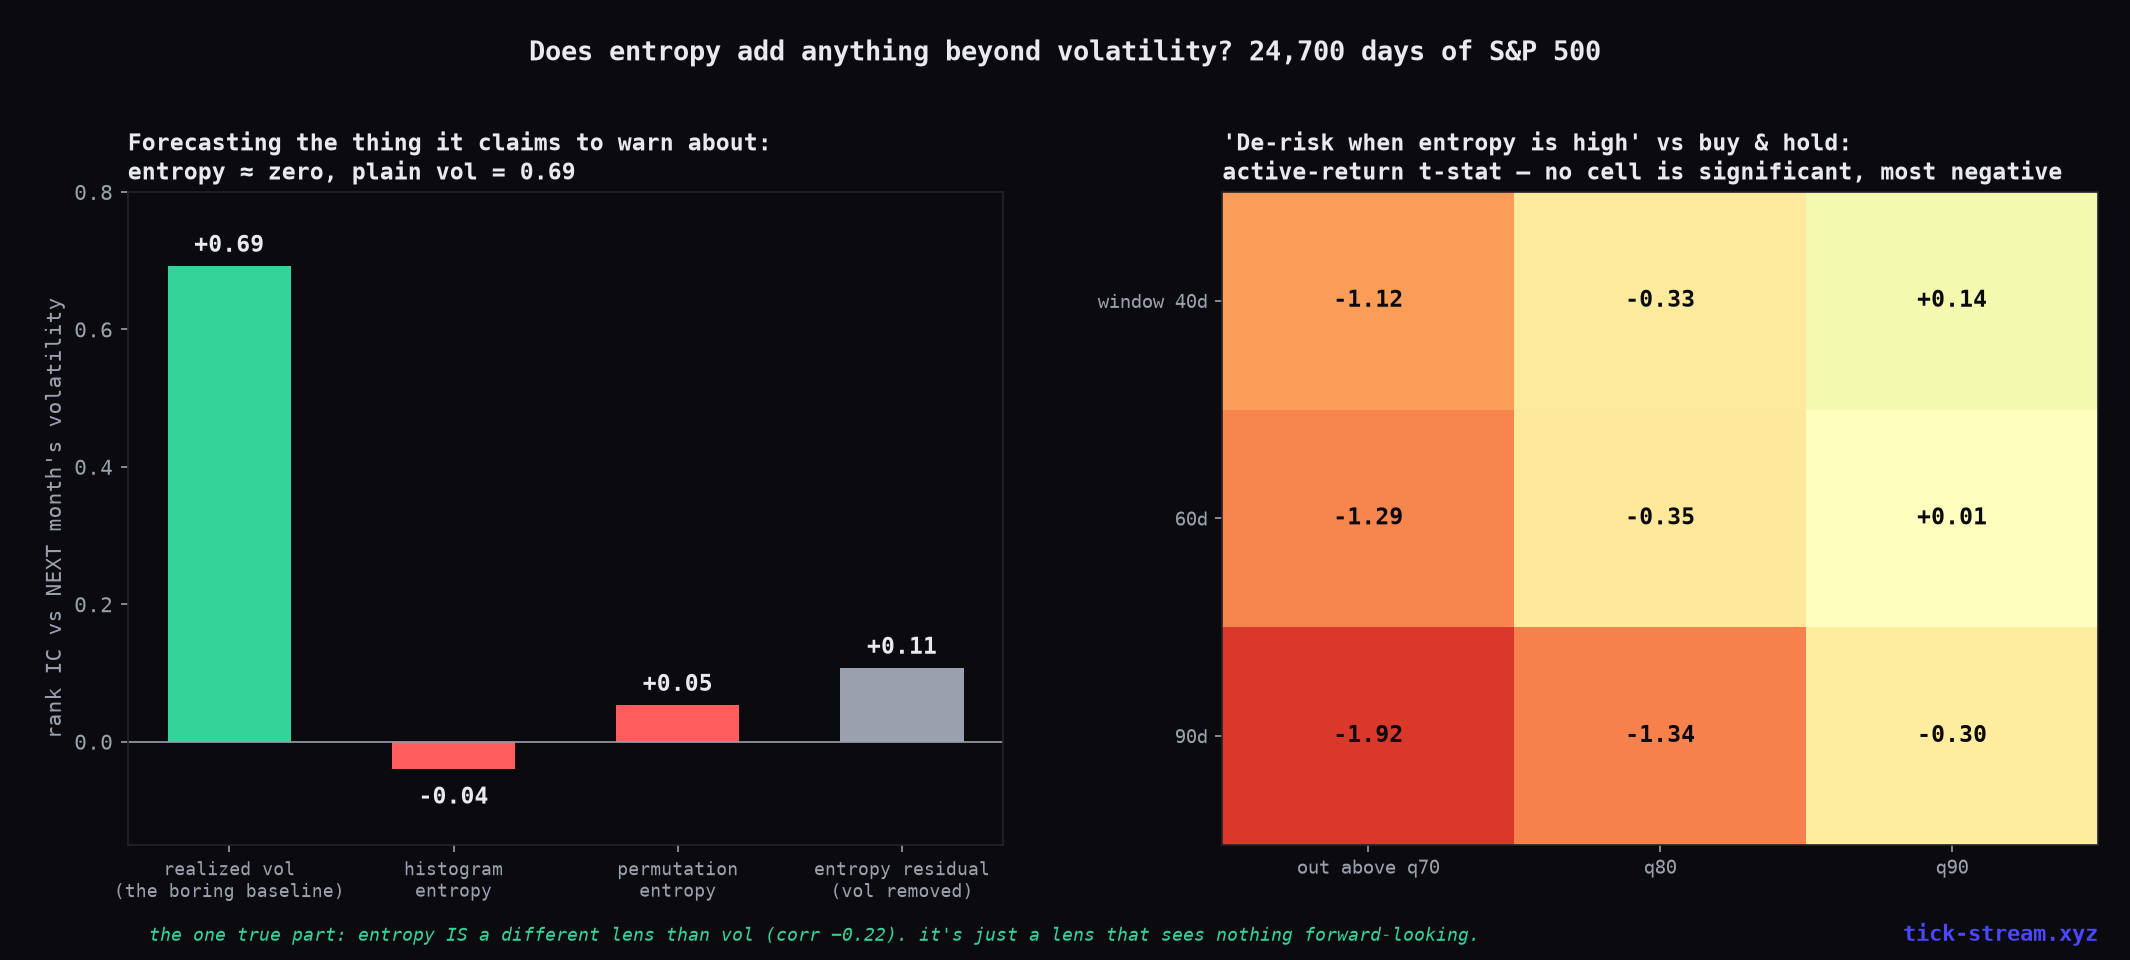
Entropy knows nothing about future volatility. Yesterday’s volatility knows a lot (0.69 — the same persistence that makes implied vol a genuinely strong forecast). Forward returns: entropy scores −0.05. There is no forecast here, under either definition, with or without the vol component removed.
And the actionable version — “high entropy = hedge, low entropy = run beta” — traded as a gate (long the index unless entropy is in the top quintile of its trailing decade): across nine window/threshold configurations on ~90 years, the active-return t-stat versus buy-and-hold ranges from −1.9 to +0.1. Most cells lose money by being out of the market; none is significant; the occasional prettier Sharpe is the generic cosmetic of any rule that sits in cash a quarter of the time.
The honest summary
One claim out of three survives, and it’s the least useful one. Entropy really is a different lens than volatility — a rare property — but it’s a lens pointed at the past: it replicates its flagship story only under a favorable definition, forecasts neither volatility nor returns, and its hedging rule never beats doing nothing across a century. Meanwhile the indicator it’s supposed to dethrone (plain volatility, realized or implied) carries an IC of 0.69 for exactly the risk it claims to see first.
“One additional lens” sounds free. It isn’t: every gauge on a dashboard competes for attention and confidence. Before adding one, ask the three questions above — they took us one afternoon and a hundred years of data, and they’re the difference between an indicator and a terminal feature.
Methodology: S&P 500 daily closes 1928–2026 (24,741 days). Entropy: normalized Shannon entropy of daily log returns over a rolling 60-day window, 8 equal-width bins per window (H/log 8); permutation entropy with embedding m=4 as robustness; realized vol = 60-day annualized. Descriptives: pre-GFC (2006–H1 2007) vs GFC (2008–H1 2009), 2019 vs Feb–Dec 2020. Forecasts: Spearman rank IC vs forward 21-day realized vol and forward 21-day returns. Gate test: long index unless signal above its trailing 10-year quantile (q70/80/90 × windows 40/60/90d), next-day execution, active returns vs buy-and-hold, t-stats on daily active returns.
Frequently asked questions
Does market entropy spike in every crisis?
Not with a standard definition. We computed normalized Shannon entropy of daily S&P returns (rolling 60-day window) across 98 years: in 2008 it drifted up mildly (+0.06) while volatility tripled — but in the 2020 COVID crash it FELL. There's a clean reason: histogram entropy measures how evenly outcomes are spread, and a crash concentrates returns into a few huge outcomes, which is LOWER entropy. Crashes are not disorder — everything falls together. The viral claim's numbers come from one specific definition in one paper; a equally reasonable definition flips the sign of the flagship example.
Is entropy just volatility with a fancier name?
Surprisingly, no — and that's the most interesting result of the test. Across 24,700 days, histogram entropy correlates −0.22 with realized volatility, and permutation entropy +0.08. It genuinely measures something different (the shape of the return distribution rather than its width). The video's claim that 'a market can have the same volatility but different structure' is technically true. Different, however, is not the same as useful.
Does entropy predict future volatility or returns?
No. Rank correlation of entropy with the NEXT month's realized volatility: −0.04 (permutation entropy: +0.05). The boring baseline — current realized volatility — scores +0.69 on the same test. For forward returns entropy scores −0.05. Even after removing the volatility component, the residual adds an IC of just 0.11 for future vol and nothing for returns. Entropy describes the recent past differently than vol does; it forecasts neither better.
Does 'de-risk when entropy is high' work as a strategy?
No configuration we tested beats buy-and-hold significantly. We ran the gate across three windows (40/60/90 days) and three exit thresholds (top 30%/20%/10% of trailing ten-year entropy), on nearly a century of data: the active-return t-statistics range from −1.9 to +0.1 — most cells negative, none significant. The Sharpe ratio sometimes looks mildly better, but that's the generic effect of any rule that parks you in cash 25% of the time; the risk-adjusted improvement never distinguishes itself from noise.
Is entropy worth tracking at all?
As a curiosity about the present, maybe — it's genuinely orthogonal to volatility, which is rare for a new indicator. As a decision input, our test says no: zero forward information for vol or returns, a flagship historical claim that depends on the definition, and a hedging rule that never beats doing nothing. If a terminal sells you an entropy gauge, ask for the same three numbers we computed: its correlation to realized vol, its rank IC against next-month vol, and the out-of-sample t-stat of the hedging rule.