Does the 'Previous-Day Value Area' Strategy Work? We Tested Every Version on 7 Years of NQ
Open inside the prior day's value area → fade back to value; open outside → trade the trend. It's one of the most popular Market Profile day-trading frameworks. We tested every version mechanically on 7 years of NQ futures — lookahead-free, real costs, train/holdout. The premise is a coin flip and every rule loses. Here's the data, and why 'it's just my psychology' is the wrong diagnosis.
“If I just traded the previous-day value-area rules consistently every day, I’d be massively profitable. The only thing stopping me is psychology and discipline.”
It’s one of the most common things a Market Profile trader will tell you, and it sounds airtight. The framework is clean, mechanical, and intuitive: mark the prior day’s value area (the 70% zone where most of the session’s trade happened, bounded by the Value Area High / VAH and Value Area Low / VAL). Then read today’s open:
- Open inside value → expect a rotational day. Fade the edges — short VAH back toward VAL, long VAL back toward VAH.
- Open outside value → expect a trend day. Trade in the breakout direction off the value-area rejection.
So we did the thing that settles it: we built the prior-day value area properly and ran every version of these rules over seven years of NQ futures. The result is decisive, and the most useful part isn’t the P&L — it’s what it says about the “it’s just my psychology” diagnosis.
What we tested
We computed the prior day’s cash-session (9:30–16:00 ET) value area using the standard 70% TPO method — POC, VAH and VAL — and classified each new day by where it opened relative to that zone (inside, above VAH, or below VAL). Then we tested the two rules people actually trade:
- Rotation (open inside): on the first tag of a value-area edge, fade it back toward the opposite edge / POC.
- Trend (open outside): enter in the breakout direction — both naively at the open and on the more sophisticated “rejection” (pullback that holds at the value-area edge, then continues).
How we made the test un-arguable
- NQ 5-minute bars, 2019 → 2026 (~7 years).
- Lookahead-free. Today’s signal only uses the prior day’s completed value area and already-closed bars.
- Real costs. $4.50 commission + 2 ticks of slippage per trade, with extra slippage on stops.
- Train / holdout split (2019–2023 vs 2024–2026) so a curve-fit can’t pass as an edge.
The premise is a coin flip
Before any strategy, look at the raw base rates on seven years of NQ:
Open ABOVE value → day closes in trend direction   53.8%   (coin flip)
Open BELOW value → day closes in trend direction   43.4%   (it REVERTS)
Open inside      → full VAH↔VAL rotation occurs     38.4%   of days
Either case      → price returns to the VA edge     ~60%
This quietly destroys the whole framework. “Open outside → trend” is barely a coin flip when price opens above value, and it’s worse than a coin flip when price opens below value — NQ tends to revert higher, not continue lower (a consequence of the index’s long-run upward drift and intraday mean-reversion). And the famous full rotation from value-area high to low? It happens on well under half of inside-open days, not “almost every day.”
Every version loses
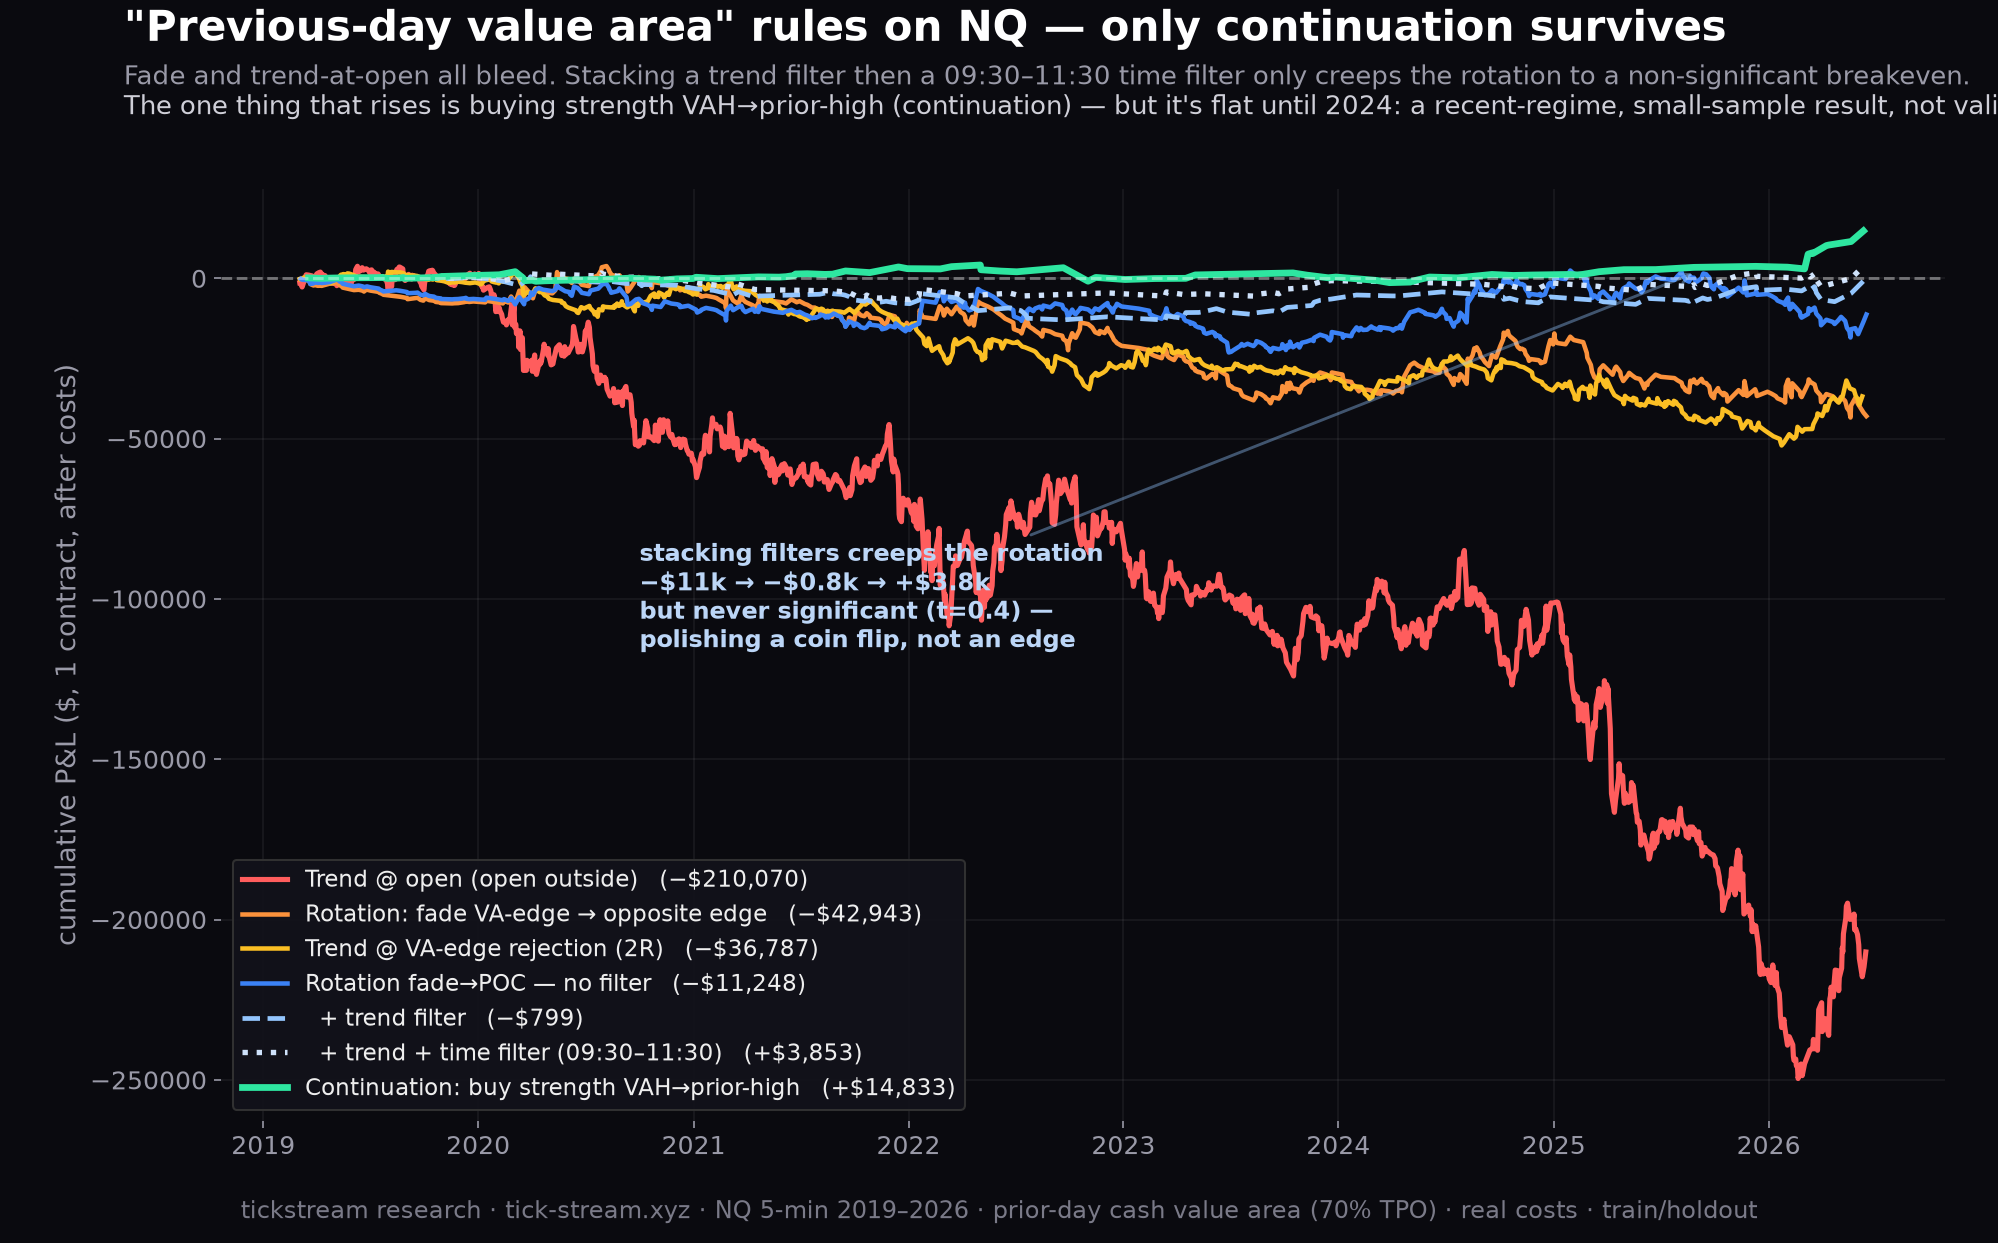
Cumulative P&L, one contract, after costs. The t-statistic next to each measures signal vs noise — how far the result sits above zero relative to its own noise (standard errors): beyond ±2 it’s reliable (a real edge if positive, a reliable loser if negative), and −2 to +2 is indistinguishable from random:
Trend @ open (open outside)              −$210,070    t = −2.07  (significant loser)
Rotation: fade VA-edge → opposite edge    −$42,943    t = −1.28
Trend @ VA-edge rejection (2R)            −$36,788    all t < 0
Rotation: fade VA-edge → POC (best case)  −$11,249    breakeven at best
The rotation fade loses because the value-area edge breaks about as often as it holds — when you fade VAH expecting a return to value, the day that doesn’t rotate runs straight through your stop. And the trend rules lose worst of all: entering in the breakout direction when price opens outside value is a statistically significant loser (t = −2.07), because the directional premise behind it isn’t true on NQ.
”It’s not your psychology”
Here’s the part that matters more than any number. The standard defense — “the strategy works, I just can’t execute it with discipline” — has it exactly backwards.
“Trade the rules consistently, every single day, the same way” is the literal definition of a trading bot: zero emotion, perfect discipline, no hesitation. We ran that bot, over seven years, and it loses money. If these rules contained a real edge, the robot would compound it effortlessly — no willpower required. The thing people are blaming on their psychology is a strategy that has no mechanical edge to execute in the first place. That’s a much kinder truth than “you lack discipline,” and it’s the one the data supports.
The one apparent exception — and why it’s a mirage
To be fair, we did find one variant that didn’t bleed: buying strength in the zone above value — long from the VAH toward the prior day’s high (a continuation trade). On the full sample it showed +$15k and a 67% win rate, which looks promising.
So we tried to optimize it honestly — tune the parameters on the 2019–2023 train period, validate on the 2024–2026 holdout, and demand a configuration that’s positive in both halves. Across more than ten parameter sets, not a single one was positive in both train and holdout. Worse: when we tuned the parameters to make the train period look good, the holdout collapsed — the textbook signature of an overfit. Every dollar of that ”+$15k” comes from 2024–2026 alone; the strategy made nothing in the prior five years (which included the 2022 bear market).
The honest reading: that’s not an edge, it’s the 2024–2026 bull regime. “Buy strength toward new highs” works when the market is trending up and fails when it isn’t — which is just trend-following. We already harvest that edge properly, in a cleaner form, with our live trend and continuation sleeves. Optimizing the value-area version didn’t rescue it; it exposed it.
”But what if you add a trend filter?”
A natural fix is to stop fighting the trend. Define the trend by where the prior day closed relative to its value area — a close below value is a downtrend, a close above value is an uptrend — and on an inside-open day, only take the trend-aligned fade: in a downtrend, only short the VAH back toward value; in an uptrend, only long the VAL.
This is a genuinely good instinct, and it helps. It improves the per-trade expectancy from −$16.70 to −$6.70 by throwing out the counter-trend trades, and it lifts the best rotation variant from −$11k to roughly breakeven (−$799 over 120 trades) — the light-blue dashed line on the chart above.
But “stops the bleeding” is not “makes money.” Breakeven after costs still isn’t an edge: the train period stays negative, the tiny positive is again confined to the recent holdout, and no configuration is positive in both halves. The reason is structural — you cannot filter your way from no-edge to edge. The rotation fade has no edge to begin with (the level reaction is a coin flip); the trend filter removes the worse half of those coin flips, but the half that remains is still a coin flip after costs. A good filter can cut your losses; it cannot manufacture an expectancy the underlying signal never had.
The instinct itself — trade with the trend, not against it — is exactly right, and it’s baked into the strategies that do work on our book. The difference is that those harvest the trend through continuation (riding with it), not through fading a level (even a trend-filtered one).
And to be thorough, we stacked one more popular filter on top: only take entries in the active 09:30–11:30 ET window. It nudges the trend-filtered rotation again — from −$799 to +$3,853 — but watch what’s actually happening (the three blue lines on the chart). With each filter the strategy creeps toward profit (−$9k → −$0.8k → +$3.8k) while the sample shrinks (540 → 120 → 90 trades), and it is still not significant (t = 0.41) and still negative in the train period. That is the anatomy of filter-stacking: every condition you add makes the past look a little better and the sample a little smaller, flattering the backtest without ever producing a real, out-of-sample edge. If you have to stack three filters to drag a strategy to a non-significant breakeven, you don’t have an edge — you have a coin flip you’ve polished toward heads.
Why the level setups fail (again)
There’s a consistent reason value-area rotation, market-profile breakouts, key zones, SMC rejection blocks and most ICT setups all fail on NQ: they are all “trade the reaction at the drawn level” ideas. And on a heavily-watched, liquid future, the obvious level is exactly where the visible liquidity sits — so it’s where moves get absorbed, not where they cleanly reverse. Yes, VAH and VAL often coincide with real option-flow levels. It doesn’t matter: a watched level is not a directional edge. The durable edge lives in open air, away from the obvious line — continuation once price is already moving — which is why our trend and breakout sleeves work and the level-fade does not. You can see those on our live, paper-traded track record.
The bottom line
On seven years of NQ futures, the previous-day value-area framework is a coin flip dressed up as a system. Opening outside value doesn’t reliably trend; opening inside value doesn’t reliably rotate; and every mechanical version of the rules loses money after costs — the trend version significantly so. The “60R from high to low this week” is selection and recency, not an edge, and “I’d be profitable if I were just consistent” is contradicted by the most consistent trader of all: a bot, which loses. If your edge survives only on this week’s best chart, it isn’t an edge. Run it through costs, out-of-sample data and an emotionless backtest first.
Methodology: NQ continuous front-month, 5-minute bars, 2019–2026. Prior-day cash-session (9:30–16:00 ET) value area via 70% TPO (POC/VAH/VAL) and prior cash high/low. Open-location classification at 9:30 ET. Rotation (fade VA edges to opposite edge / POC), trend at open, trend at VA-edge rejection, and a VAH→prior-high continuation long with a volume-absorption trigger. Lookahead-free signals, $4.50 commission + 2-tick slippage, 2019–2023 train / 2024–2026 holdout, parameters tuned on train only.
Frequently asked questions
Does the previous-day value area strategy actually work?
Not mechanically, on NQ. We tested the full open-location framework — open inside the prior day's value area means rotation (fade VAH back to VAL), open outside means trend — on seven years of NQ futures, lookahead-free with real costs. The premise itself is a coin flip: opening above value continues higher only 53.8% of the time, opening below value continues lower only 43.4% (it actually mean-reverts), and a full VAH-to-VAL rotation happens on just 38.4% of inside-open days. Every tradeable version lost money.
Is 'open inside value = rotation, open outside = trend' a real edge?
It's a real description of how some days behave, but it is not a tradeable edge. Mechanically fading the value-area edges loses (the edge breaks as often as it holds), and entering in the breakout direction when price opens outside value loses significantly (t = −2.07 over seven years). Price returns to the value-area edge roughly 60% of the time regardless of direction, so the 'trend' premise is weaker than a coin flip on NQ.
If the value-area strategy is profitable for others, why does it fail in a backtest?
Because a backtest removes the two things that make it look profitable in real time: selection and recency. You remember the days price rotated cleanly from value-area high to low, and a chart showing '60R from high to low' is the theoretical maximum capture, not what a mechanical rule books. Run the actual rules every day for seven years with costs and the high-conviction setups average out to nothing. It's the same illusion that makes hand-picked ICT screenshots look like an edge.
Is it a psychology problem — would I be profitable if I just traded the rules consistently?
No, and this is the important part. 'Trade the rules consistently every day' is exactly what a bot does — zero emotion, perfect discipline. We ran that bot over seven years and it loses. If the rules contained a real edge, the robot would print money with no psychology required. The belief that consistency alone would make the strategy profitable is precisely what the data contradicts.
Does adding a trend filter make the value-area strategy profitable?
It helps, but not enough. Filtering the rotation to trade only with the trend — defined by where the prior day closed relative to its value area — improves the per-trade result from −$16.70 to −$6.70 and lifts the best rotation variant from −$11k to roughly breakeven. But breakeven after costs is not an edge: the train period stays negative and no configuration is positive in both train and holdout. You can't filter your way from no edge to an edge — a filter cuts losses, it can't create an expectancy the underlying signal never had.
Don't VAH and VAL line up with real option-flow levels?
Often, yes — but a watched level is not a directional edge. On a liquid instrument like NQ, the obvious level is exactly where the visible liquidity sits, so price reactions there get absorbed rather than cleanly reversing. We've now watched this same structural fact kill value-area rotation, market-profile breakouts, key zones, SMC rejection blocks and most ICT setups. The durable edge lives away from the obvious level, in continuation — not at the line everyone drew.