Why PBD Is Failing: We Backtested the Market-Profile Model on 7 Years of NQ
The viral PBD (P / b / D) market-profile model promises a daily edge from value-area rejections and acceptance breakouts. We backtested it lookahead-free on 7 years of NQ futures — every variant and timeframe failed, and the intraday version loses with significance. Here's the data.
A model called PBD is making the rounds right now. The pitch is seductive: a market-profile framework that “literally shows up in the market every single day,” with a clean buy signal and a clean breakout signal. We see a new version of this model every few weeks, so we did what we always do — we backtested it properly. Seven years of NQ futures, lookahead-free, real costs. This is what the data says.
What PBD claims
PBD reads the day’s auction as one of three profile shapes, drawn from where volume accumulates:
- P — aggressive buyers pushed the auction up first, then the market accepted those prices, so value builds at the top (a “P” letter shape, long tail below). Money moved up.
- b — aggressive sellers pushed down, value builds at the bottom (a “b” shape, long tail above). Money moved down.
- D — a balanced, normal distribution. Value in the middle.
Around the value area (the price band where ~70% of volume traded), PBD defines two trades:
- Rejection (the “buy signal”). Price tries to discover lower, poke below the value area — but buyers take the upper hand and close it back inside the range. That’s the long, targeting the other side of the value area “and maybe beyond.” (Mirror it for shorts at the top.)
- Acceptance breakout. If price breaks the value-area edge with conviction — with volume, with money — you follow it. If it breaks without conviction and falls back in, that’s a fade/scalp.
It’s a coherent story. The question is whether it survives contact with data.
How we tested it
We rebuilt the model faithfully on NQ 5-minute bars, 2019 through 2026:
- For each day, we computed the real volume profile → point of control, the 70% value area (VAH/VAL), and the P / b / D shape.
- We used the prior day’s value area to trade the next day — strictly lookahead-free.
- Then, because PBD is often used intraday, we also tested a developing-profile version: build the value area from the morning session, trade the rest of the day.
- Both signals (rejection and acceptance breakout), conditioned and unconditioned on shape (P → long bias, b → short bias).
- Real costs ($4.50 commission + 2-tick slippage), exits on bar closes and structure stops — no fantasy fills.
- A train/holdout split so a curve-fit can’t masquerade as an edge.
The result: it doesn’t work
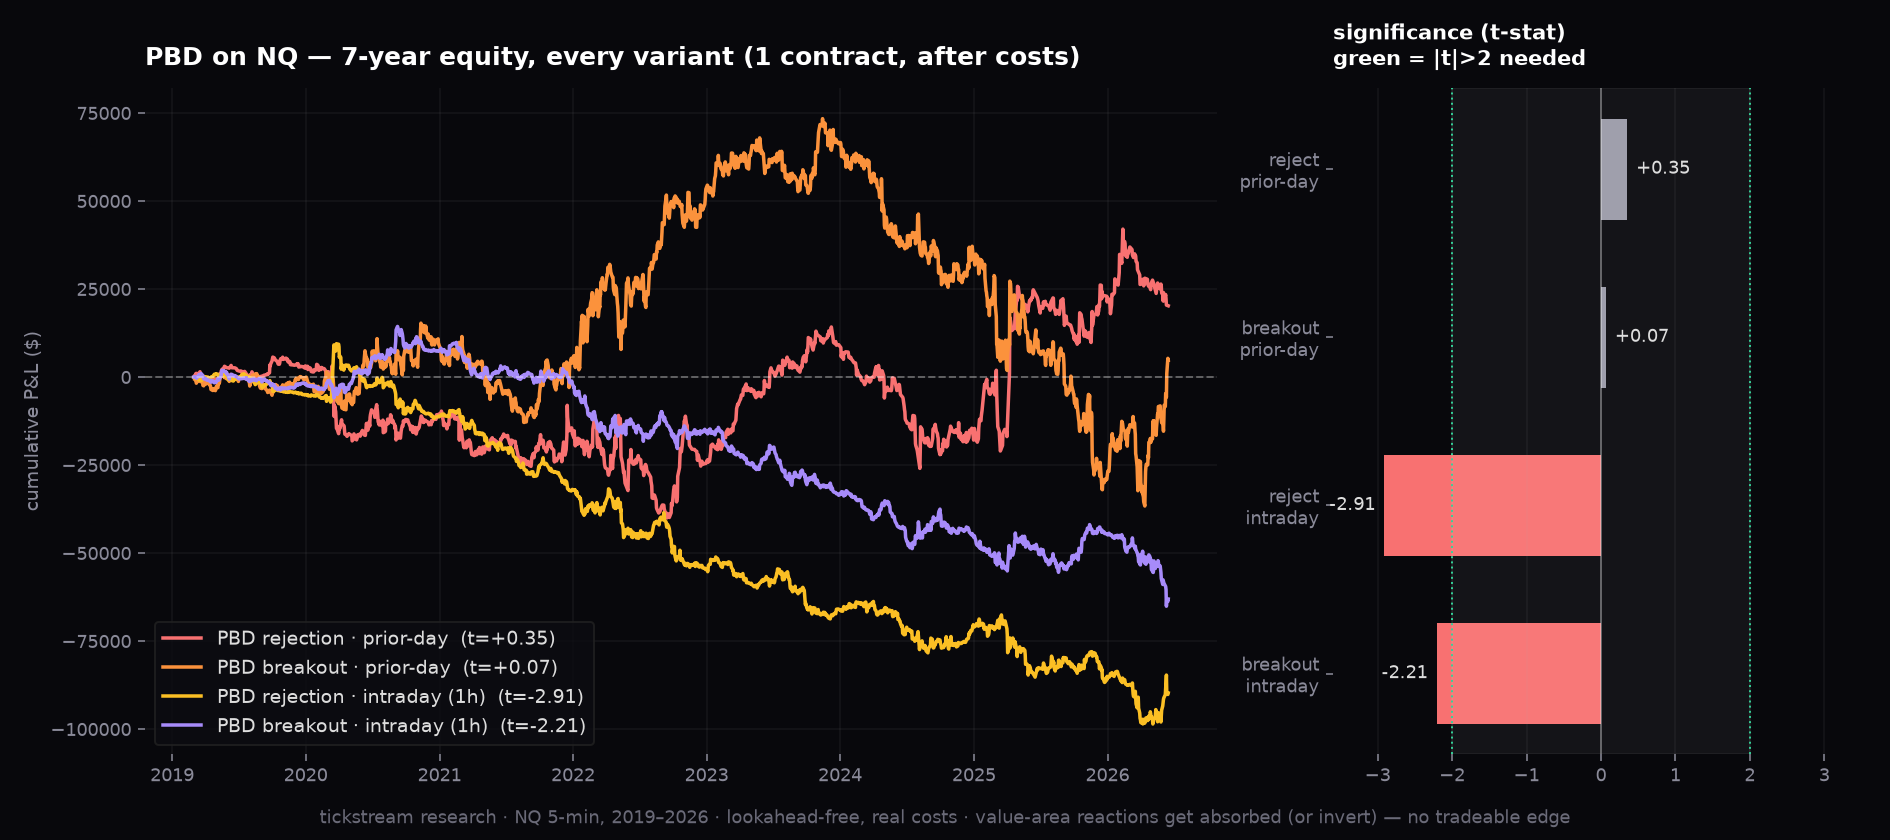
Every variant is flat or bleeding. Two numbers do the judging: t (the t-statistic) measures how far a result sits above zero relative to its own noise (how many standard errors) — |t| above 2 is a real result (<5% chance of luck), −2 to +2 is noise, negative loses; and PF (profit factor) is gross win ÷ gross loss, where 1.0 is breakeven. The numbers:
Prior-day value area
rejection ("the buy signal")   PF 1.03   t = +0.35   → noise
acceptance breakout            PF 1.00   t = +0.07   → noise
Intraday-developing profile
rejection (1-hour balance)   −$90k   t = −2.91   → significantly LOSES
breakout  (1-hour balance)   −$63k   t = −2.21   → significantly LOSES
For context: you generally want a t-stat above 2 to claim an edge even exists. The prior-day version is dead-flat noise. The intraday version is significantly negative — it doesn’t just fail to make money, it reliably loses it.
Why it fails — the part worth understanding
The intraday result is the tell. At the value-area edge, NQ does the opposite of what the theory predicts:
- “Failed breakouts” don’t revert — they keep going.
- Breakouts at the value-area edge get faded (absorbed).
The level isn’t a magnet that price respects. It’s where the visible liquidity sits — the line everyone has drawn on the same chart — so it’s exactly where moves get absorbed. This isn’t a one-off. We’ve now watched the same structural fact kill a string of “trade the level” models: volume-profile (VPTPO) breakouts, key zones, SMC rejection blocks, ICT liquidity sweeps, and now PBD. On NQ, reactions at the obvious level lose money. The durable edge lives in open air, away from it.
The kernel of truth
To be fair to PBD: one piece of it is real. “Follow an accepted breakout with conviction” is a genuine effect — momentum continuation after a real acceptance move is one of the few things that survives honest testing on index futures. But it only works away from the obvious levels, where there’s no overhead supply to absorb the push. PBD puts the entry right at the value-area edge, which is precisely where that edge dies. The instinct is right; the location is wrong.
The takeaway
A clean story and a daily pattern are not an edge. PBD is well-presented and intuitive, and it fails a basic, lookahead-free, cost-aware backtest — across two timeframes, both signals, with the intraday version losing at significance. Before you put a “model” on your charts because a champion or an influencer trades it, run it through data that includes slippage, commissions and an out-of-sample period. Most viral models don’t survive that. Occasionally one does — and that’s the whole point of testing.
Methodology: NQ continuous front-month, 5-minute bars, 2019–2026. Volume profile with 5-point bins, 70% value area. Prior-day and intraday-developing variants, both rejection and acceptance signals, shape-conditioned. $4.50 commission + 2-tick slippage per trade, bar-close triggers, structure stops, train/holdout split.
Frequently asked questions
What is the PBD trading model?
PBD is a market-profile framework. The day's volume distribution is read as one of three shapes: P (aggressive buyers pushed the auction up, value then built high), b (aggressive sellers pushed down, value built low), and D (a balanced, normal day). Traders then trade the value area — fading a 'failed' move that pokes outside value and closes back in (rejection), or following a breakout that holds beyond the value-area edge with volume (acceptance).
Does the PBD model actually work?
Not on NQ futures, in our testing. We backtested it lookahead-free over seven years (2019–2026). The prior-day value-area version produced a t-stat of 0.35 for the rejection signal and 0.07 for the breakout — statistically indistinguishable from noise. The intraday-developing version was worse: it lost money with significance (t = −2.9 and −2.2). You generally want |t| > 2 just to claim an edge exists.
Why does trading the value-area edge fail?
On NQ, reactions at obvious, widely-watched levels tend to get absorbed rather than respected. The value-area edge is exactly where the visible liquidity sits, so it is where moves get absorbed — failed breakouts keep going instead of reverting, and breakouts at the edge get faded. We have now seen the same structural result kill several 'trade the level' models: VPTPO breakouts, key zones, rejection blocks, ICT sweeps, and PBD.
Is there any part of PBD that is real?
Yes — 'follow an accepted breakout with conviction' is a real effect. But it only works away from the obvious levels, in open air where there is no overhead liquidity to absorb the move. PBD places the entry right at the value-area edge, which is precisely where that edge dies. So the kernel is true; the framing puts the trade in the wrong place.