Do Big Orders Predict Price? We Checked Every 25-Lot on 7 Years of Nasdaq Futures
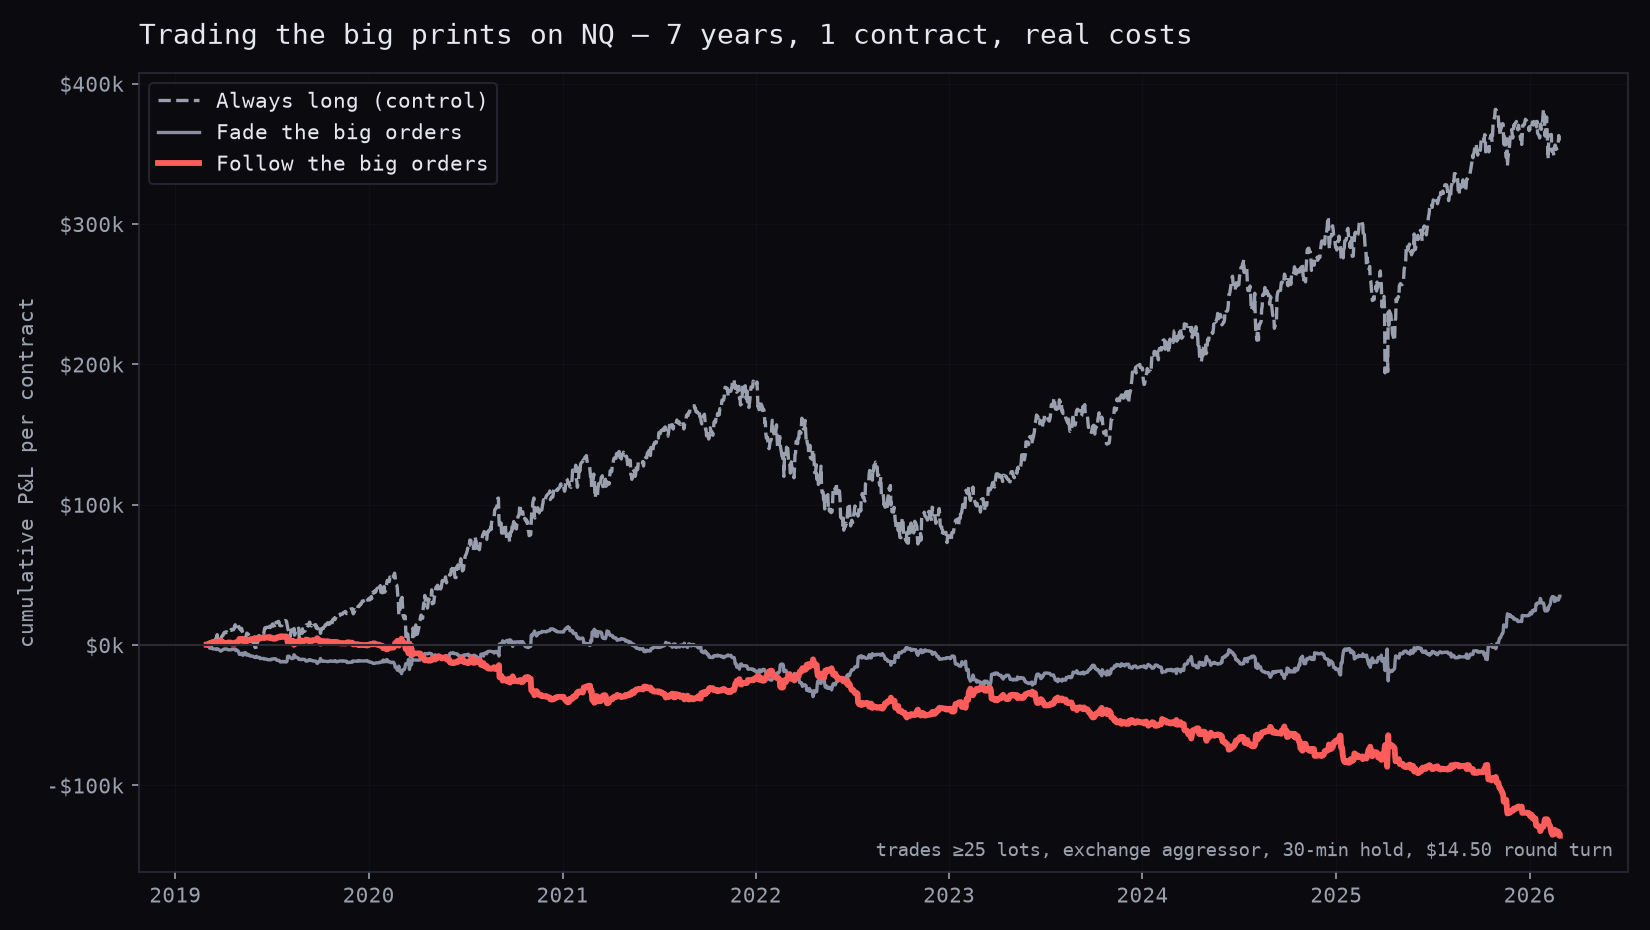
Whale alerts, footprint charts, 'follow the institutional order flow' — the premise is that large trades reveal where price is going. We had the data to check it properly: 1,847 days of NQ with the exchange's own aggressor flag on every single print, so a 300-lot and three hundred 1-lots are never confused. Following the big orders lost $135,834 per contract. Fading them made nothing. Across three sessions, four horizons and four formulations of 'big', not one crossed the noise threshold. The one thing that did predict is worth a quarter of a tick.
There is a whole product category built on one idea: that when somebody trades big, they know something, and you can see it on the tape.
Footprint charts colour it. Whale-alert bots tweet it. “Follow the institutional order flow” is the most reliable way to sell a trading course in 2026. The premise is intuitive — a 300-lot is not a retail impulse, somebody with a model and a mandate put it there, and if you can see it you can ride it.
We had the data to check it properly, so we did.
What “properly” means here
Two things usually get in the way of testing this, and we happen to be free of both.
The aggressor is normally guessed. Most retail data does not tell you whether a trade was a buy or a sell, so tools infer it from the prevailing quote. That inference is decent but not free, and its errors are not random. Our gateway records the exchange’s own aggressor flag on every print — 1,847 trading days back to March 2019. We verified it before trusting it: minute-level delta rebuilt from the store correlates +0.623 with the same minute’s return, and 1.000 with the delta column already in our bar files.
Size normally gets averaged away. Cumulative delta adds up signed volume, which means one 300-lot and three hundred 1-lots are the same number. That is precisely the distinction the whale premise rests on, and aggregate delta destroys it. So we kept every print’s size and rebuilt the flow with the large ones separated out: ≥10, ≥25 and ≥50 contracts, over 2.54 million minutes.
For scale: 5.1% of NQ minutes contain at least one print of 25 lots or more. The largest single print in seven years was 1,821 contracts.
Following the whales lost $135,834
Three plain rules, one contract, entries at the next bar’s open, $14.50 per round turn, thirty-minute hold:
Follow the big orders ........  -$135,834   Sharpe -0.82
Fade the big orders ..........   +$34,886   Sharpe  0.21
Only the extremes (top 10%) ..  -$136,642   Sharpe -0.83
Always long (control) ........  +$355,958   Sharpe  0.67
Following the big prints does not merely fail to help. It costs you money, steadily, for seven years, while the thing it is supposed to beat — sitting still — makes $355,958.
The third line is the one worth pausing on. “Only the extremes” restricts the rule to the top and bottom decile of large-print flow, which is the version most people actually mean: ignore the noise, act only when something genuinely unusual crosses the tape. It produces the same curve. Filtering harder does not rescue the idea, because there was nothing to filter towards.
Fading them makes $34,886 over seven years, which sounds like the inverse edge until you notice it is a Sharpe of 0.21 and a t-statistic of 0.6. That is a coin landing slightly heads.
It is not the horizon, and it is not the session
A fair objection: maybe thirty minutes is the wrong window, or maybe it works when the book is thin and one big order actually moves something.
So we tested four formulations of the signal against four horizons in all three sessions — 84 comparisons in total, with observations sampled non-overlapping so the statistics are not inflated by reusing the same bars.
| what we measured | strongest |t| anywhere |
|---|---|
| the minute’s large-print delta | 2.4 |
| only prints ≥50 contracts | 2.3 |
| accumulated over 60 minutes | 1.4 |
| large prints against the small ones | 2.8 |
With 84 comparisons, pure noise produces a largest value of about 3.0. Not one formulation cleared it. The signs flip between Asia, London and New York, which is what noise does and what a real effect does not.
That last row deserves its own note, because it is the most interesting version of the claim. “Smart money versus dumb money” says the informative signal is not what the big traders do, but when they do the opposite of everyone else. We built exactly that — large-print flow on one side, small-print flow on the other, signed by the large side. Maximum |t| across every session and horizon: 2.8, in London, at five minutes, and it does not survive anywhere else.
The one thing that does predict — and why you still cannot have it
Something did come out of this well above the noise. It just is not what anyone is selling.
Aggregate delta forecasts a five-minute reversion. Heavy buying is followed by price giving some of it back. In the Asian session the t-statistic is −9.0; in London −4.1. In New York it is nothing, which fits the mechanism: the effect is transient price impact, and it needs a thin book to be visible at all.
Statistically that is not ambiguous. Then you measure it in points.
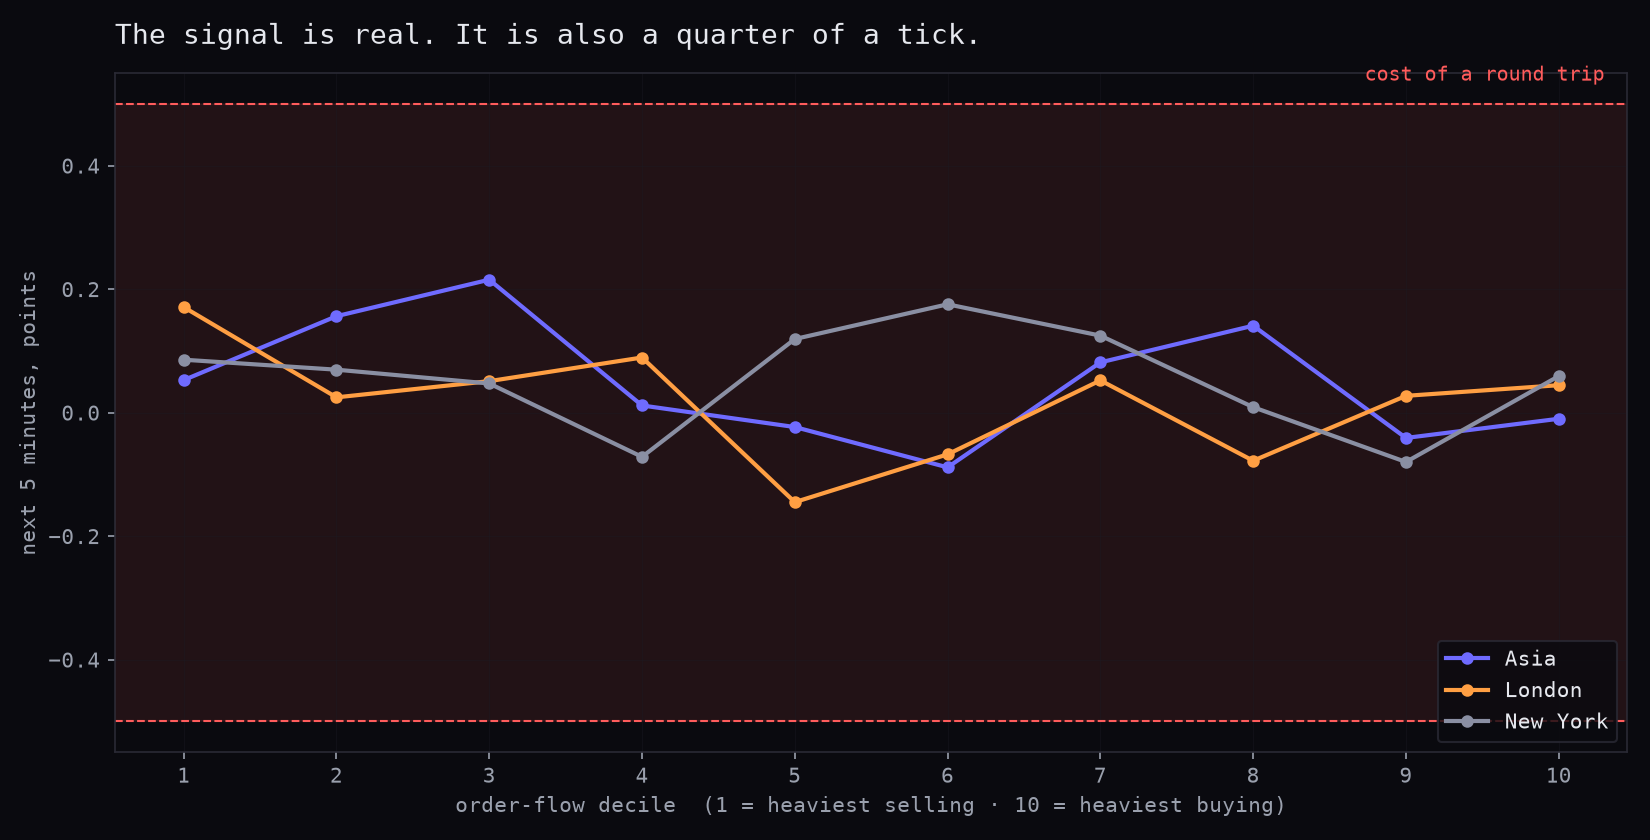
The spread between the heaviest-selling and heaviest-buying decile is 0.063 points in Asia, 0.126 in London, 0.027 in New York. A round trip across the spread with commission costs about 0.5 points. The entire red band on that chart is the cost of trading; every session’s decile curve lives inside it.
The t-statistic was large because the sample is large — 41,000 independent observations of an information coefficient of 0.04. In money it is a quarter of one tick.
This is the second time we have measured this exact shape. Order-book imbalance came out the same way: real, robust, reproducible, and entirely inside the spread. Short-horizon flow information on NQ is genuinely there. It belongs to whoever quotes the spread, not to whoever pays it — which is a statement about market structure, not about whether you found the right indicator settings.
What we think is actually going on
A large print is not a prediction. It is a footprint.
By the time a 300-lot appears on the tape, the decision behind it was made somewhere you cannot see, and the part of the move it was going to cause is the part that just happened. That is why order flow reads as coincident in every test we run — it explains the bar you are looking at, not the next one.
There is also a selection problem nobody mentions. The prints you can see are the ones somebody was willing to show you. An institution moving real size has every reason not to leave a 300-lot on the public tape, and a well-developed toolkit for not doing so. What reaches the print you are watching is disproportionately the flow that did not mind being watched.
What this does not say
It does not say order flow is useless. It says order flow does not carry direction on NQ at these horizons.
It carries magnitude clearly. A large breakout bar reliably forecasts a wider range afterwards — we measured t = 22.7 on that, and it survives the obvious artifacts. If you size positions, hedge, or trade options structures, that is worth something. It is simply a different thing from knowing which way to point.
And it says nothing about other markets. NQ is one of the deepest futures contracts in the world. The same test on a thin market, where one 300-lot is a meaningful share of the resting book, could easily come out differently. We would not assume either way without running it.
The data
Everything above is NQ, March 2019 to February 2026, exchange aggressor per print, 2.54 million minutes. Costs are $14.50 per round turn throughout — commission plus one tick of slippage per side. Signals use completed bars and enter at the next open, so nothing is acted on before it exists.
If you want to run your own version of this, the tick history is the same data we used, aggressor flag included.
Frequently asked questions
Do large trades predict which way price will move?
Not on NQ, over 7 years, at any horizon we tested. Large-print delta (trades of 25+ contracts, and separately 50+) reached a maximum |t| of 2.8 against forward returns across 84 tests — below the 3.0 you would expect from noise alone at that many comparisons. Trading it lost money: following the big orders cost $135,834 per contract over seven years, against $355,958 for simply holding.
What about big traders quietly accumulating over hours?
Tested directly. Large-print delta accumulated over 60 minutes reached |t| = 1.4 against the next hour and |t| = 1.2 against the next day. The 'they build positions quietly' version of the claim measures no better than the single-print version.
Does order flow predict anything at all?
Magnitude, not direction. Aggregate delta forecasts a 5-minute reversion with t = -9.0 in the Asian session — statistically unambiguous. In points it is worth 0.06, against a round trip costing about 0.5. It is real information that lives entirely inside the spread, which means it belongs to whoever quotes the spread, not to whoever pays it.
How is the aggressor determined?
It is not inferred. The gateway records the exchange's own aggressor flag per trade, covering 1,847 days from March 2019. We verified it before using it: minute-level delta rebuilt from the store correlates +0.623 with the same minute's return and 1.000 with the delta column already in our bar files.