Do Price Gaps Get Filled? We Tested 1,748 NQ Opening Gaps — the Fill Rate Is a Distance Illusion
A gap is the simplest object in trading: today's open minus yesterday's close. Three simple questions follow — is direction predictable after a gap, are gaps predictable from prior action, and do gaps get filled? We answered all three on 7 years of NQ with a placebo control, then tested the wait-and-see strategy everyone actually trades. The famous fill rate turns out to be about distance, not memory.
A price gap is the simplest object in trading: today’s open minus yesterday’s close. And from that one number, three simple questions follow — the kind of reasoning that should precede any strategy:
- Is direction predictable after the gap?
- Are gaps predictable from prior price action?
- Do gaps get filled?
We answered all three on 1,748 NQ sessions (2019–2026), with the control group almost no gap study bothers to run — and then tested the strategy people actually trade: look at the gap, wait, and see whether the market continues or starts working the gap off.
One stat does the judging below: t (the t-statistic) — how far an average sits from zero relative to its own noise. |t| > 2 is a real effect; less is indistinguishable from luck.
Q3 first, because it’s the famous one: do gaps fill?
| Gap size (vs 14-day avg range) | Filled same session | Mirror level touched (same distance, no story) |
|---|---|---|
| < 5% | 96% | 96% |
| 5–10% | 87% | 89% |
| 10–20% | 78% | 77% |
| 20–40% | 60% | 60% |
| > 40% | 33% | 26% |
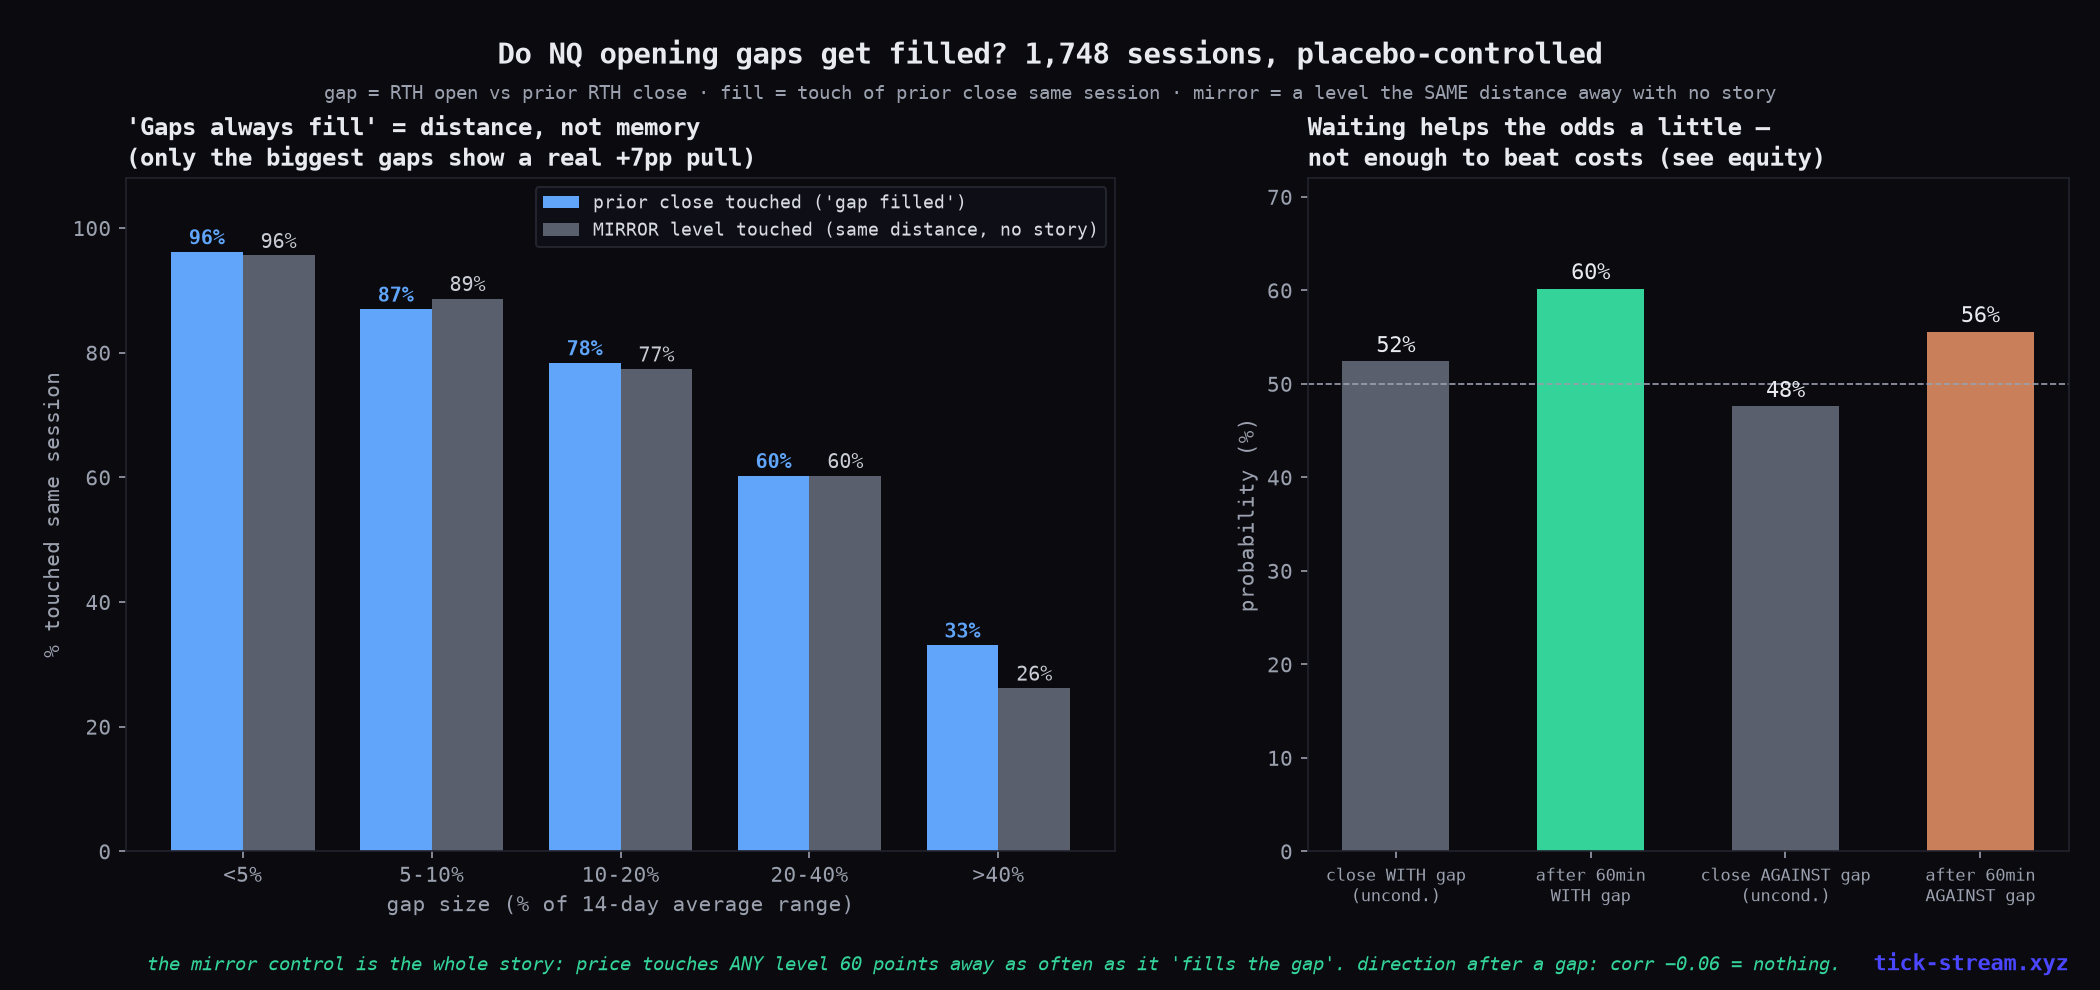
The mirror control is the whole story. For every gap we also checked a placebo level the same distance from the open in the opposite direction — a price with no story attached. The touch rates are identical for four of five buckets. “93% of gaps get filled” — the number the courses quote — is true and empty: price touches any level that close to the open, because the market’s daily wander is bigger than a small gap. Distance, not memory.
The honest nuance: the largest gaps (>40% of a day’s range) do show a genuine pull — 33% filled vs 26% for the placebo, about +7 points of true gap-directed attraction (z ≈ 2.8). The market does lean back toward big gaps slightly more than chance. Hold that thought until the P&L section.
And the folklore’s favorite escape hatch — “every gap fills eventually” — is just false: of the gaps that didn’t fill same-day, 46% were still unfilled five sessions later.
Q1: is direction predictable after the gap?
No. Correlation between the gap and the rest of the day: −0.06. No gap-size quintile reaches significance in either direction (the biggest up-gaps lean toward fading at t = −1.5 — suggestive, not real). Traded naively from the open, both classics fail:
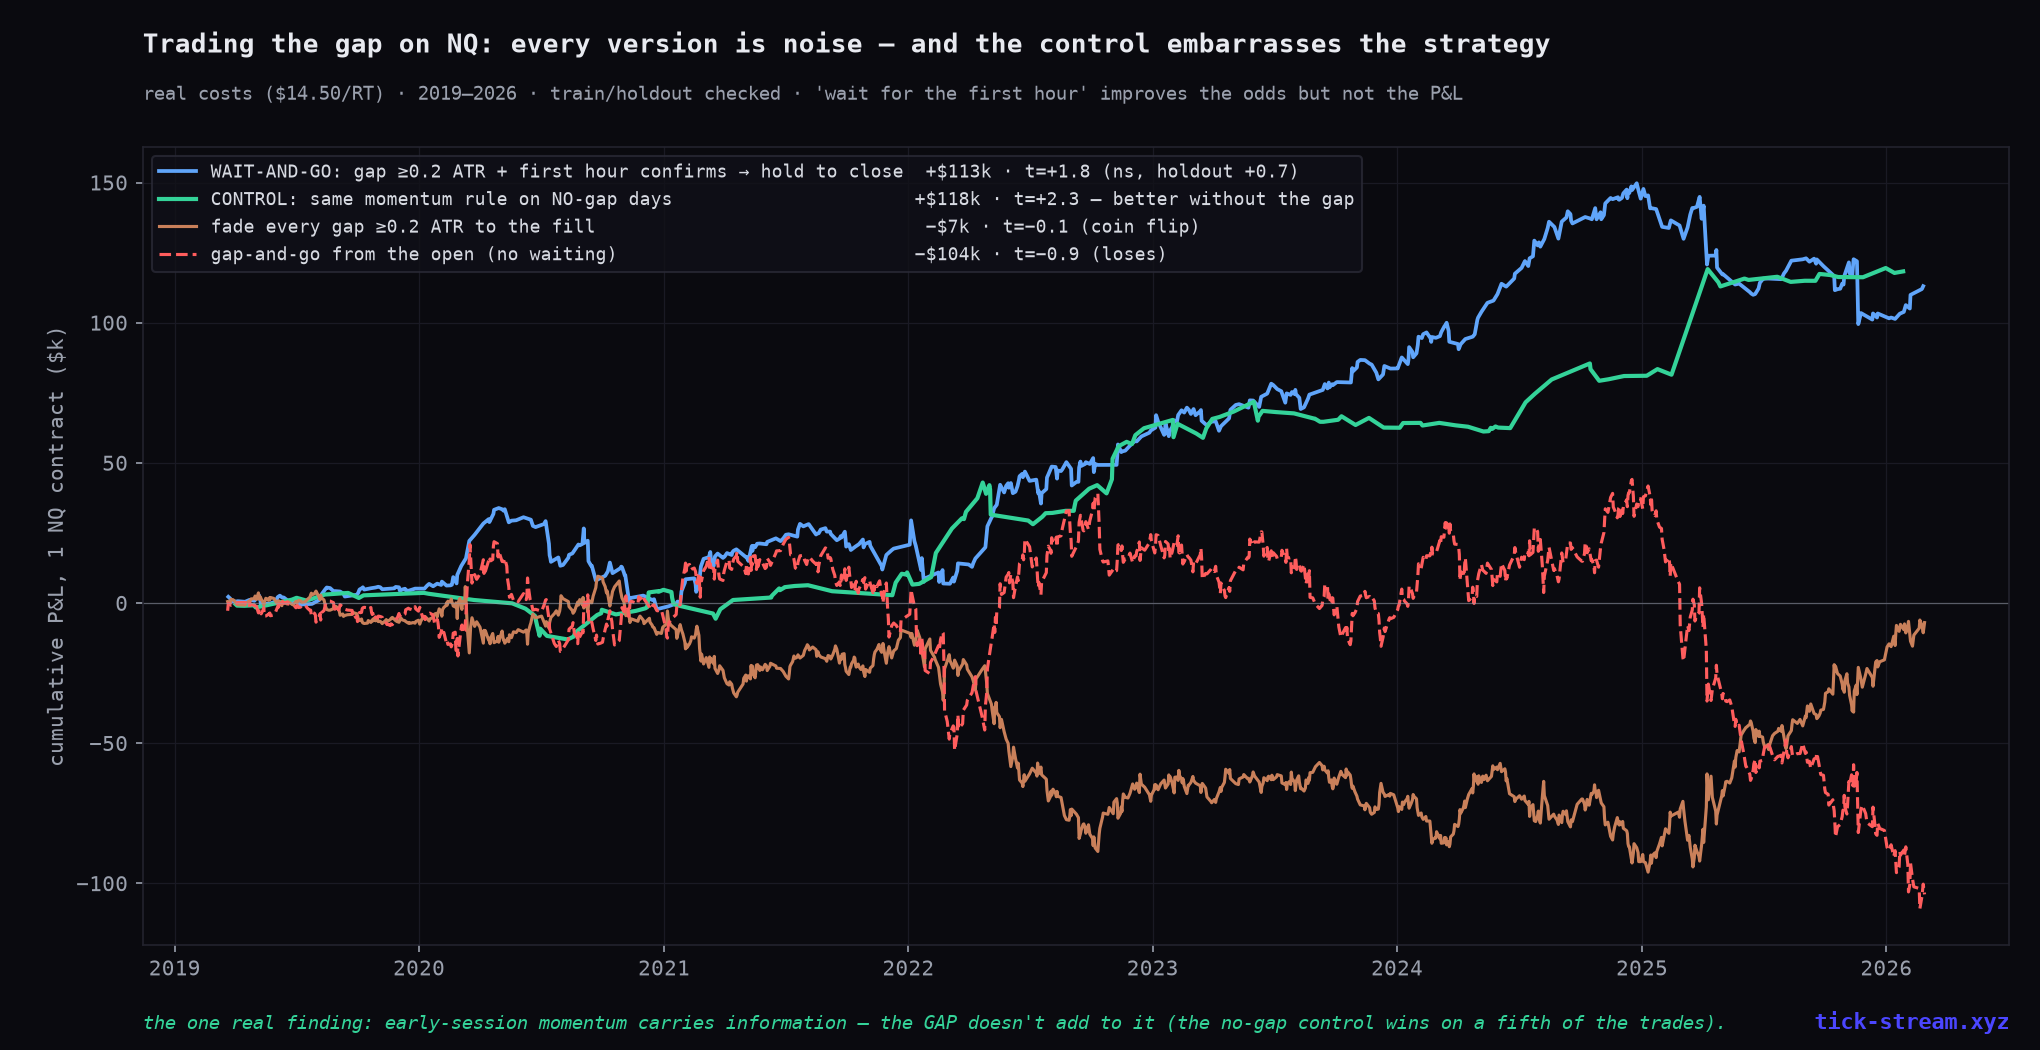
- Gap-and-go (follow the gap, hold to close): −$104k per contract over 7 years (t = −0.9).
- Fade to the fill (target = prior close, stop beyond the open): −$7k (t = −0.1) — a coin flip paying commissions. Its only good stretch is 2024–26; the 2019–23 train period is negative. We killed the same trade once before in our knowledge-base sweep for exactly this reason: a holdout-only “edge” is a regime, not a strategy.
Q2: are gaps predictable from prior action?
Size yes, sign no. Tomorrow’s gap magnitude correlates +0.32 with today’s range — volatility clusters, as it does everywhere (the one survivor of our day-type research). But the direction contains nothing: P(gap up | up day) = 55.7% against a 56.0% base rate. You can know a big gap is coming; you cannot know which way. A forecast of magnitude without direction sizes positions — it doesn’t create them.
The strategy everyone actually trades: wait and see
Nobody trades the open blind — the practitioner version is: watch the first minutes; if the market keeps pushing in the gap direction, go with it; if it starts working the gap off, trade the fill. We tested exactly that, K = 15/30/60 minutes:
- The tilt is real: if the first hour moves with the gap, the day closes with the gap 60.2% of the time (vs 52% unconditional). If it moves against, the day closes against 55.6%. Waiting genuinely improves the odds.
- The money isn’t: continuation-after-confirmation earns +$113k at t = +1.8 — under the significance bar, and the holdout alone is t = +0.7. The fill-trade side is noise at every K (at K = 60 it loses, t = −1.8).
- The control is the punchline: the identical wait-for-the-first-hour rule on days with no gap (<5% of range) made more money (+$118k, t = +2.3) on a fifth of the trades. The information is in early-session momentum itself. The gap contributes nothing — if anything it dilutes it.
The bottom line
Three simple questions, honestly answered: direction after a gap is not predictable (−0.06); gaps are predictable in size but not sign; and the famous fill rate is a distance illusion — a placebo level with no story gets touched exactly as often, except for the very biggest gaps, whose small genuine pull still doesn’t survive costs. The wait-and-see refinement improves probabilities and not P&L, and its own control group outperforms it without the gap.
That’s not a disappointing result — it’s the method working. The same three-question discipline that kills the gap trade is the one that occasionally says yes: the last submission that survived it is running live on our board right now. Most simple concepts die under a control group. The point of asking simple questions is finding the few that don’t.
Methodology: NQ continuous front-month, 1-minute RTH bars 2019–2026 built from real trade prints, 1,748 sessions. Gap = 09:30 ET open minus prior 16:00 ET close, normalized by the trailing 14-day average daily range. Fill = touch of the prior close within the same RTH session; mirror control = touch of open + gap-distance in the opposite direction. Direction tests on open→close returns, daily-aggregated t-stats, 2019–23 train / 2024–26 holdout. Trades costed at $4.50 commission + 2-tick slippage per round trip. Wait-and-see: first-K-minute move from the open as trigger, continuation held to close, fill-trade targeted at the prior close with a half-gap stop.
Frequently asked questions
Do price gaps really get filled?
The honest answer: gap fills are mostly a distance effect, not a market memory effect. On 1,748 NQ sessions, small gaps (under 5% of the average daily range) filled 96% of the time — but a placebo level placed the same distance from the open in the opposite direction got touched 96% of the time too. Price wanders more than a small gap is wide; touching the prior close is nothing special. Only the very largest gaps (over 40% of the daily range) showed a genuine pull: 33% filled vs 26% for the placebo level — real, but small, and not enough to trade profitably.
Is direction predictable after an opening gap?
No. Across 7 years of NQ the correlation between the gap and the rest of the day's move is −0.06 — statistically nothing. No gap-size bucket produced a significant edge in either direction. Gap-and-go from the open lost $104k per contract over the period; fading every gap to the fill was a coin flip after costs (−$7k). The earlier version of this test in our knowledge-base sweep died the same way: any apparent fade edge lives only in one regime.
Does waiting for the first hour improve gap trades?
It improves the odds, not the P&L. If the first hour moves in the gap's direction, the day closes that way 60% of the time (vs 52% unconditionally) — a real tilt. But traded with costs it earns t = +1.8 (below significance, and much weaker out-of-sample). The damning part: the same wait-for-the-first-hour rule applied on days with NO gap made slightly more money on a fifth of the trades (t = +2.3). The information is in the early session's momentum — the gap adds nothing to it.
Are gaps predictable in advance?
The size is, the sign isn't. Tomorrow's gap magnitude correlates +0.32 with today's range — volatility clusters, so big-range days are followed by big gaps. But the direction is a coin flip: the probability of an up-gap after an up day is 55.7% vs a 56.0% unconditional base rate — literally no information. You can forecast that a gap will be big; you cannot forecast which way.
Do unfilled gaps always fill eventually?
No — that part of the folklore is simply false. Of the gaps that didn't fill on day one, only 54% filled within the next five sessions; 46% were still open a week later. In a trending instrument like NQ, gaps in the trend direction routinely never look back. 'Every gap gets filled eventually' is survivorship talking: the fills get remembered, the runaways get renamed 'breakaway gaps' after the fact.