ORB30 Strategy Backtest: 30-Minute Opening Range Breakout on NQ, 7 Years, Placebo-Controlled
A reader sent us a precise ORB30 spec: long-only breakout over the 30-minute opening range, stop at 2.25× the range, target at 0.75×, flat by 5pm, 2% risk, one trade a day. We ran it through the full discipline — conservative fills, real costs, train/holdout, two control groups and a parameter grid. It's one of the rare submissions that survives, with caveats worth reading.
Most strategy specs we get sent are vague. This one wasn’t: ORB30, long only — break of the 30-minute opening range high, stop at 2.25× the range, target at 0.75× the range, flat by 5:00pm, 2% risk, one trade per day. A precise, testable rule set with an unusual inverted risk:reward (risking 3 to make 1), which is exactly the kind of high-win-rate construction that fixed-target ORB variants have used to look great while earning nothing. So we ran it through the full machine.
Short version: it survives — and it’s not the parameters, it’s the breakout.
One stat does the judging below: t (the t-statistic) measures how far an average return sits above zero relative to its own noise — |t| above 2 is a real effect, between −2 and +2 is indistinguishable from luck.
The rules we tested
- Opening range: high/low of 09:30–10:00 ET.
- Entry: buy stop one tick above the OR high, first touch after 10:00, one trade per day, long only.
- Exit: stop at entry − 2.25×OR, target at entry + 0.75×OR, or the 17:00 ET close — whichever comes first.
- Fills, conservatively: stop-order entry at max(OR-high, bar open) + 1 tick; on the entry bar only the stop may trigger (the target counts only from the next bar — the classic same-bar artifact that fakes entire strategies is excluded); stop checked before target on every bar; all exits debited 2 ticks; $4.50 commission per side.
- Data: 7 years of NQ minute bars (2019–2026) built from real trade prints, 1,740 sessions.
The results
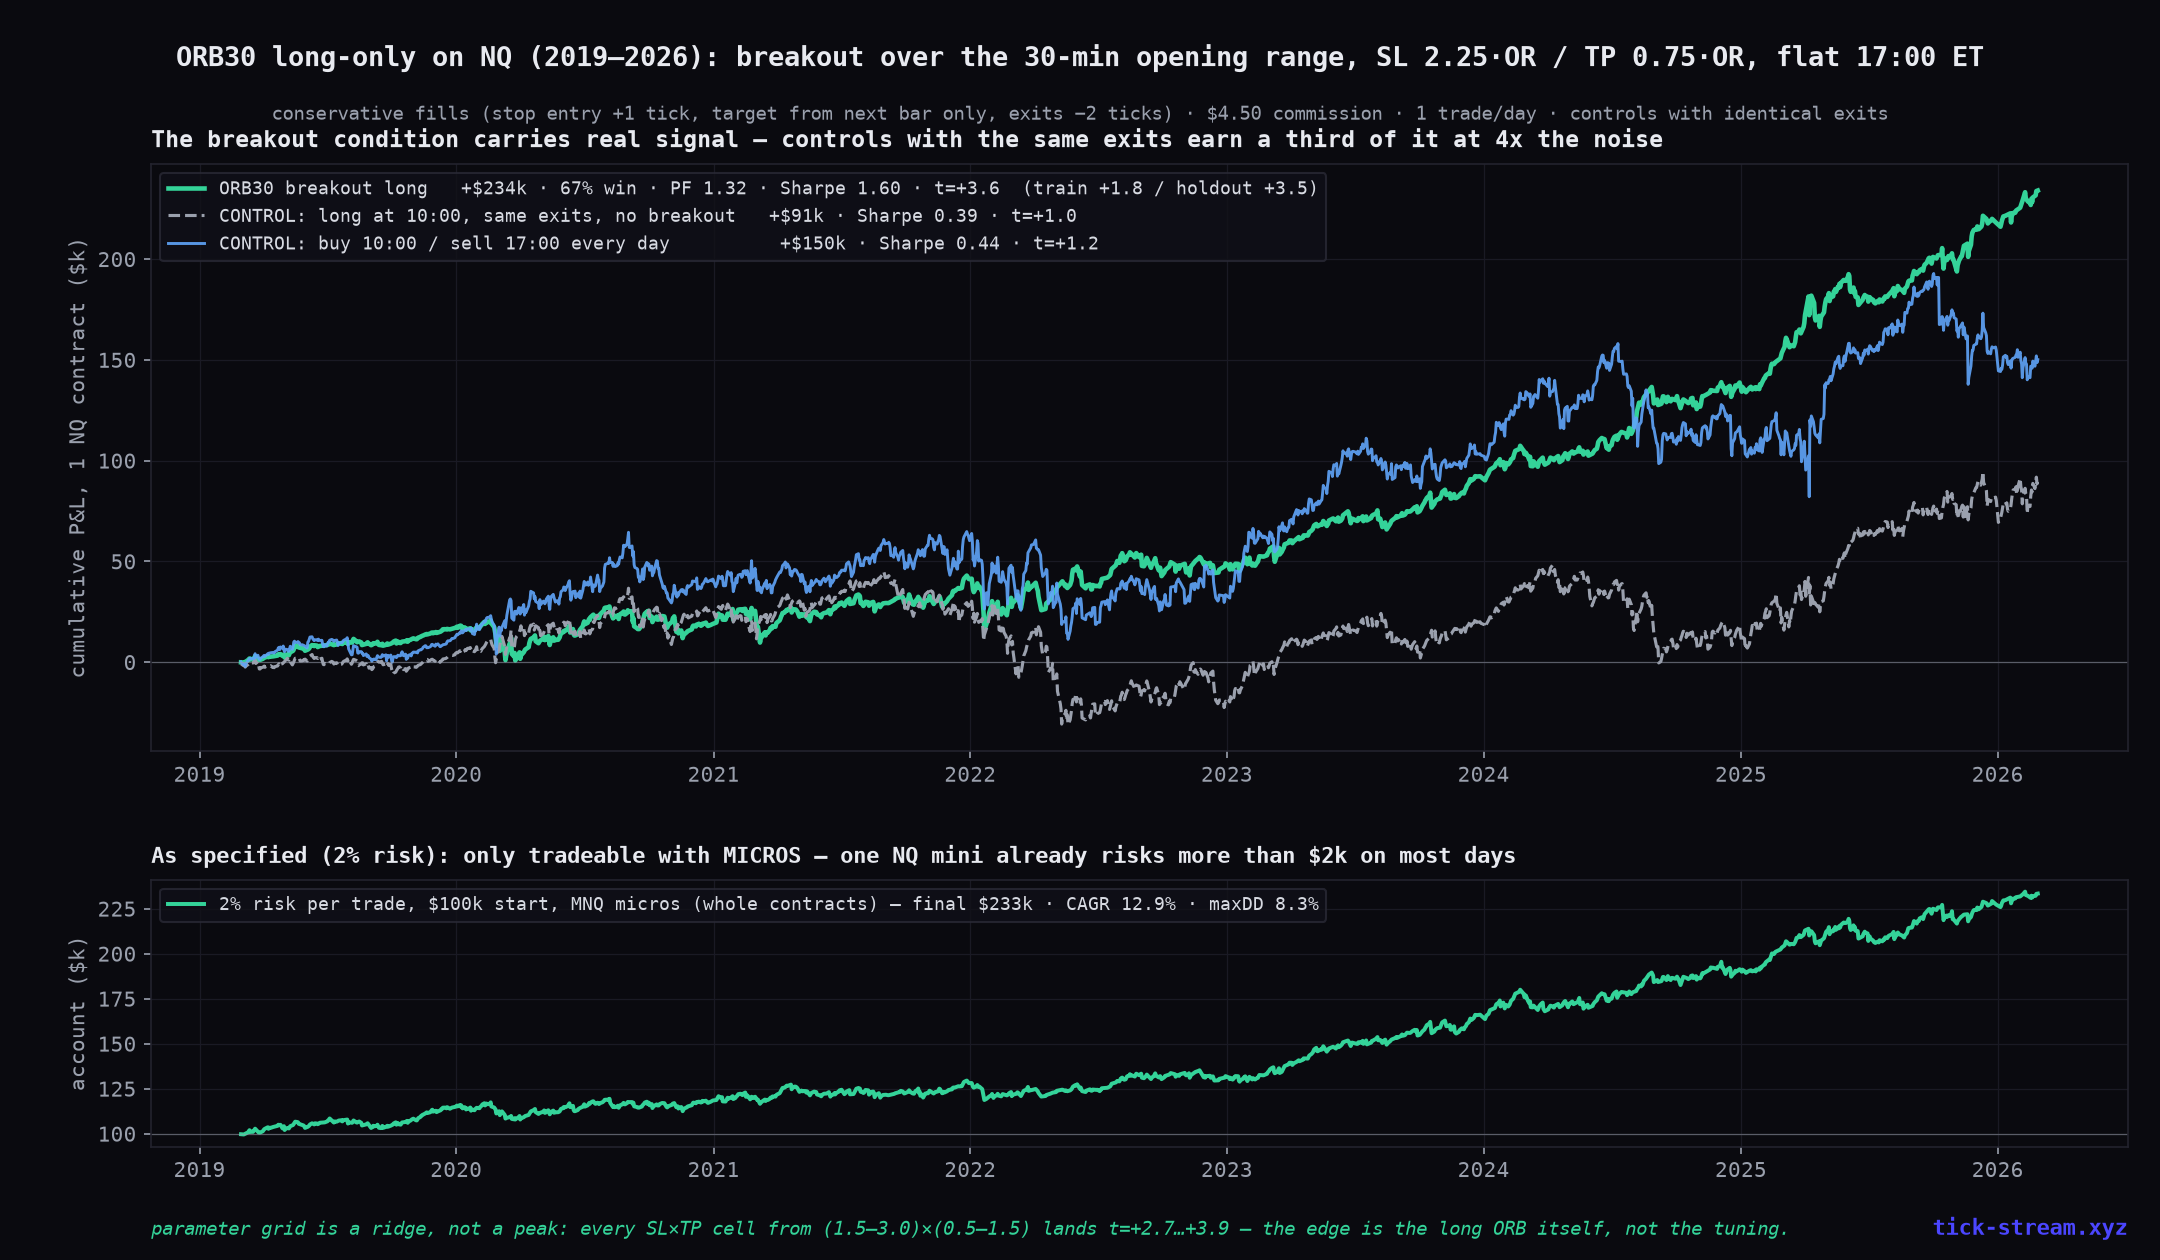
1,251 trades · +$234k net per contract · 67.1% win rate · profit factor 1.32 · Sharpe 1.60 · t = +3.6.
The splits that usually kill submissions, passed: the 2019–23 train years are positive on their own (+$92k, t = +1.8), the untouched 2024–26 holdout is positive on its own (+$142k, t = +3.5), and every calendar year is green — including 2022, when NQ fell 33% (+$7.8k that year). Exits: 52% at the target, 41% at the 17:00 cutoff, only 7% at the wide stop.
That last number explains the win-rate arithmetic. On paper, risking 2.25R for 0.75R needs a 75% hit rate; the measured 67% still profits because the cutoff exit harvests a lot of half-won days — average win $1,161 against average loss $1,802.
Is it just NQ going up? The controls say: mostly no
Long-only, on an index that tripled over the test window — the obvious objection. So we ran the same exits with the breakout condition removed:
| Variant | Net | Sharpe | t |
|---|---|---|---|
| ORB30 breakout long (trades 72% of days) | +$234k | 1.60 | +3.6 |
| Long at 10:00 every day, same OR-based exits | +$91k | 0.39 | +1.0 |
| Buy 10:00 / sell 17:00 every day | +$150k | 0.44 | +1.2 |
Both controls capture the drift — neither is statistically distinguishable from zero. The breakout version makes 1.5–2.5× the money in fewer trades at a quarter of the noise. The condition “price took out the opening-range high” is doing real work, which matches what our 7-year ORB study found from the other direction: fading the range loses reliably; going with the break and letting it run is the one thin, real edge in the opening range.
Are the parameters overfit? The grid is a ridge, not a peak
We swept the stop from 1.5× to 3× the range (and “no stop at all”) against targets from 0.5× to 1.5×:
| SL \ TP | 0.5 | 0.75 | 1.0 | 1.5 |
|---|---|---|---|---|
| 1.5 | t +3.2 | t +3.1 | t +3.4 | t +3.1 |
| 2.25 | t +3.7 | t +3.6 | t +3.9 | t +3.8 |
| 3.0 | t +3.3 | t +3.2 | t +3.5 | t +3.5 |
| no stop | t +2.8 | t +2.7 | t +2.9 | t +2.9 |
Every single cell is positive and significant. The submitted (2.25, 0.75) isn’t even the best cell — slightly larger targets test a touch better. This is what a real effect looks like: the money comes from the long opening-range break with a daytime cutoff, and the exit tuning just shapes the distribution around it.
The 2% risk problem: the spec needs micros
Here the spec as written breaks. A 2.25×OR stop is typically $3,000–6,000 of risk per NQ contract — 2% of a $100k account is $2,000, which buys zero contracts on 83% of days. As written, the strategy barely ever trades.
On MNQ micros (1/10 the size) the sizing works exactly as intended: 2% risk per trade, whole contracts, compounding from $100k → $233k over 7 years, ~13% CAGR, 8.3% max drawdown (lower panel of the chart). Micro commissions are proportionally higher, which is included. If you want the 2%-risk version, it’s a micro strategy — or a mini strategy on a $500k+ account.
Follow-up: what if you drop the 5pm cutoff and just hold to the target?
The natural next question (we got it within a day): why cut off at 17:00 at all — let it run until the TP or the stop hits. We tested that too, same entry and stop, positions held overnight and across days, gap-conservative fills (a stop gapped through fills at the open, not at the stop price):
| Variant | Net | Win | Sharpe | t | maxDD | median hold |
|---|---|---|---|---|---|---|
| With 17:00 cutoff (TP 0.75×OR) | +$276k | 70% | 1.84 | +4.0 | $35k | 3.4h |
| No cutoff, TP 0.75×OR | +$218k | 80% | 1.20 | +2.5 | $58k | 4.4h |
| No cutoff, TP 1.5×OR | +$306k | 67% | 1.46 | +2.6 | $52k | ~23h |
| No cutoff, TP 3.0×OR | +$347k | 49% | 1.69 | +2.4 | $75k | ~2.1 days |
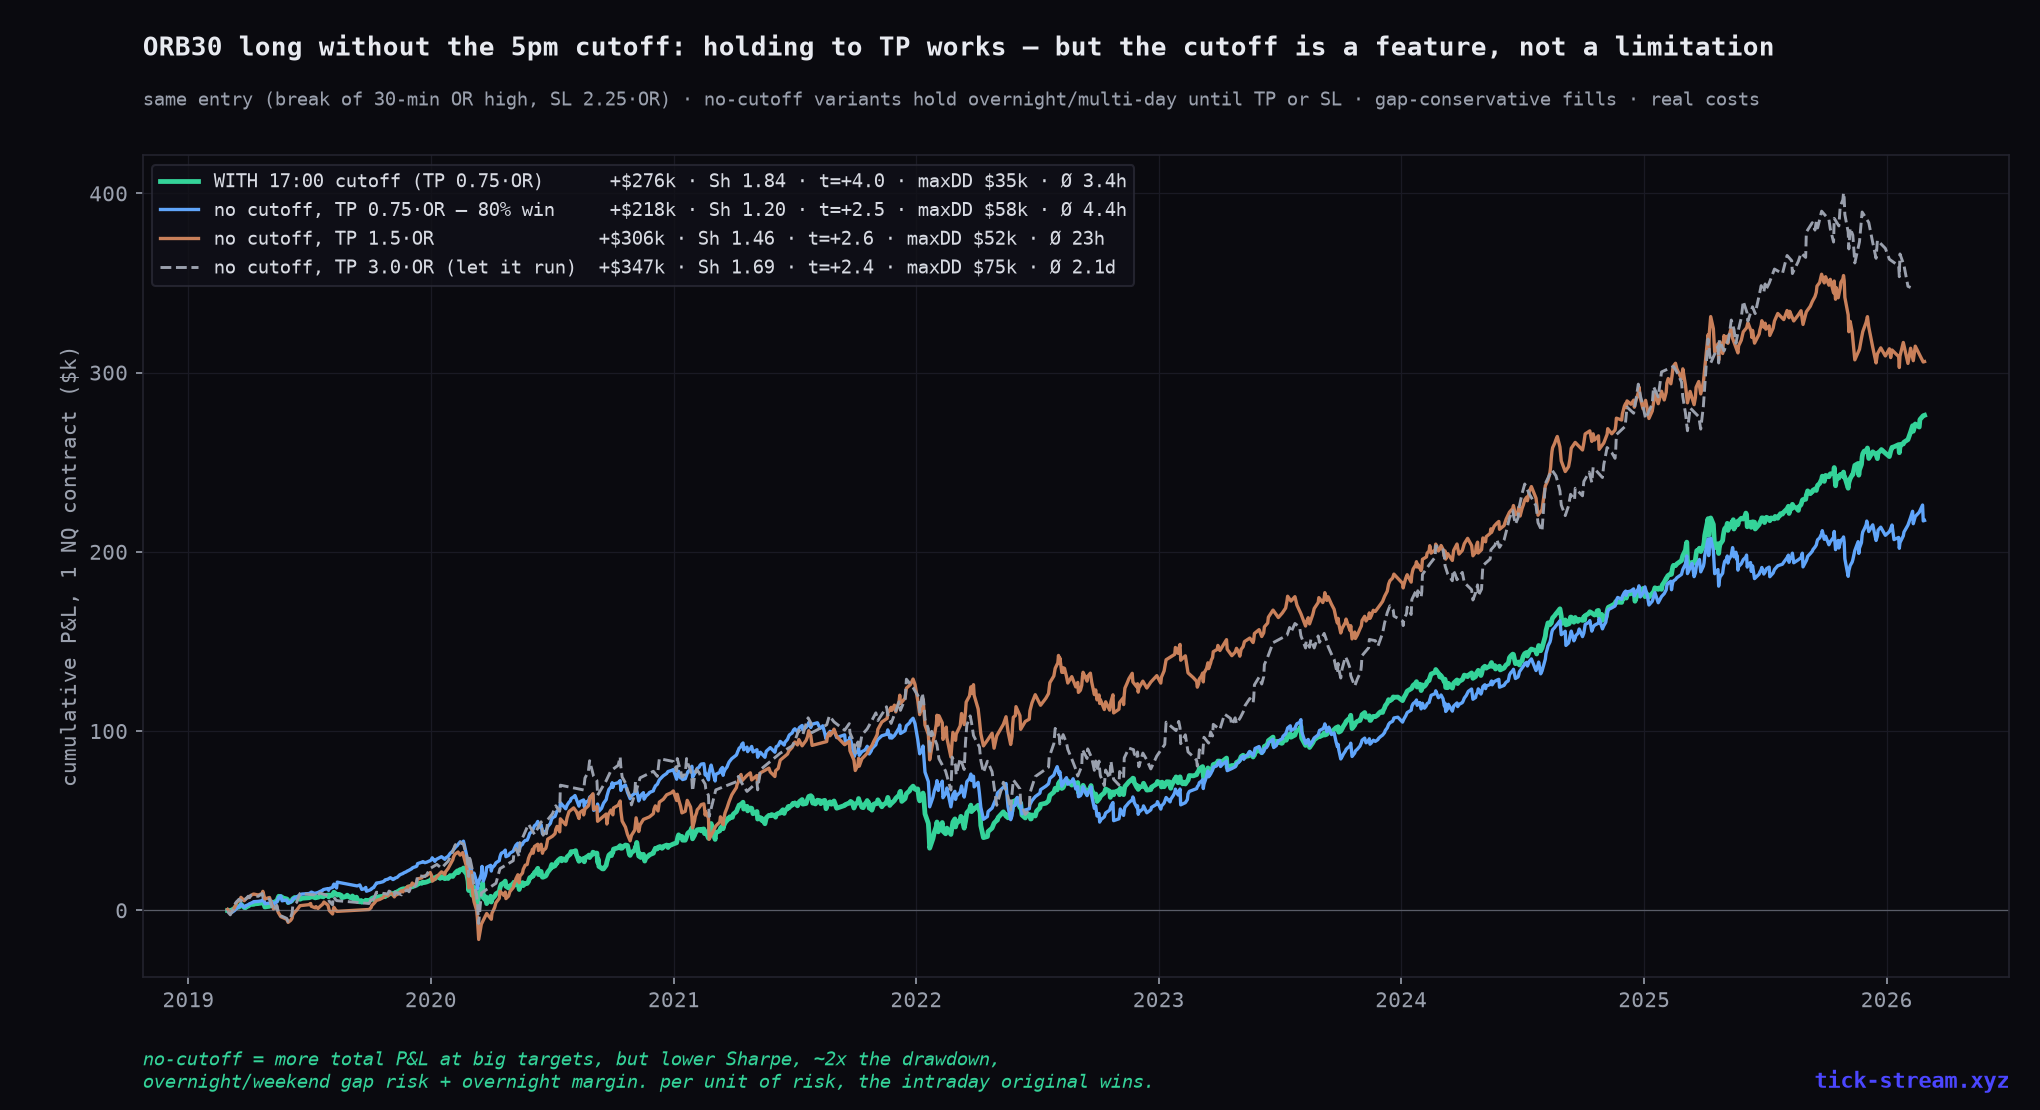
Holding to the target works — every variant stays significant — and the 80% win rate of the no-cutoff version is exactly the kind of number that sells courses. But look at what you pay for it: Sharpe drops by a third, the drawdown roughly doubles, losers stay open for days (the longest ran 44 days), and you now carry overnight margin plus weekend gap risk. Bigger targets recover the total P&L (+$347k at 3×OR) by quietly turning the day trade into a multi-day swing trade — still worse per unit of risk than the original.
The 17:00 cutoff is not a limitation, it’s the risk engine of this strategy. It’s the reason the wide 2.25×OR stop is almost never hit and the equity curve stays smooth. Our recommendation is the spec as submitted.
(This strategy is now running as a live paper algo — Daybreak on the live board — unchanged from the rules above, so you can watch the forward test instead of taking the backtest’s word for it.)
Honest caveats
- Long-only on the strongest index of the decade. The controls show the breakout adds real signal on top of the drift, and 2022 was green — but a regime where NQ grinds down for years is underrepresented in any 2019–2026 test. The short mirror is not the same trade: our earlier work shows downside breaks behave differently.
- The holdout is stronger than the train (t +3.5 vs +1.8). Statistically that’s the right way around to fail — nothing was fit to the recent years — but it also means the recent regime has been unusually kind to this trade. Expect the train-years version of it, not the 2024–25 version.
- Execution reality: entries are stop orders into a breakout — the +1 tick slippage we charged is fair for one contract, optimistic for size.
- This is a backtest, not a live record. We forward-test candidates as paper algos before believing them — that’s the whole point of the live board.
Methodology: NQ continuous front-month minute bars 2019–2026 built from real trade prints, 1,740 sessions. OR = 09:30–10:00 ET high/low; entry = buy stop 1 tick above OR-high after 10:00, ≤1 trade/day, long only. Stop before target on every bar; target valid from the bar after entry; exits −2 ticks; $4.50/side commission. Controls: identical exits without the breakout condition (long at 10:00 daily) and plain 10:00→17:00 long. Sizing: 2% of equity per trade on stop distance, whole contracts, MNQ point value $2, $1.50/side. Daily-aggregated t-stats; 2019–23 train / 2024–26 holdout touched once.
Frequently asked questions
Does the 30-minute opening range breakout (ORB30) work on NQ?
The long side did, on our 7 years of NQ minute data: 1,251 trades, +$234k per contract net of costs, 67% win rate, profit factor 1.32, Sharpe 1.60, t-statistic +3.6 — positive in both the 2019–23 train years and the 2024–26 holdout, and positive every single calendar year including the 2022 bear. Crucially, it beat two control groups with identical exits, so the result is not just NQ drifting up.
Is ORB30 profit just the market going up?
Partly, but not mostly. We ran two placebos: going long at 10:00 every day with the exact same OR-based stop/target/cutoff earned +$91k at Sharpe 0.39 (t = +1.0), and buying 10:00 / selling 17:00 daily earned +$150k at Sharpe 0.44. The breakout version earned +$234k at Sharpe 1.60 (t = +3.6) while trading only 72% of days. The breakout condition itself carries most of the signal — consistent with our earlier finding that opening-range continuation is real while fading the range loses.
Are SL 2.25×OR and TP 0.75×OR the best parameters?
They're fine, and that's the point: the parameter grid is a ridge, not a peak. Every stop from 1.5× to 3× the range (even no stop at all) combined with every target from 0.5× to 1.5× lands between t = +2.7 and +3.9, Sharpe 1.2–1.75. Slightly larger targets (1.0–1.5×OR) actually tested a bit better than 0.75. When a strategy only works at one magic setting, that setting is usually noise — this one works across the whole neighborhood.
Can you trade ORB30 with 2% risk per trade?
Not with NQ minis on a normal account. The stop is 2.25× the opening range — typically $3,000–6,000 of risk per contract — so 2% of a $100k account (=$2,000) buys zero contracts on 83% of days. On MNQ micros (1/10 size) the sizing works: 2% risk compounding turned $100k into $233k over 7 years (CAGR ~13%) with a 8.3% max drawdown, using whole micro contracts.
Why did the win rate come out 67% when the R:R needs 75%?
Because of the 17:00 cutoff. With a 0.75R target against a 2.25R stop you'd need 75% target-hits to break even if every trade ended at one or the other. But 41% of trades ended at the time cutoff instead — many of them small winners or small losers — which changes the arithmetic: average win $1,161 vs average loss $1,802 at a 67% win rate still nets out solidly positive. The wide stop rarely gets hit at all (7% of trades).