Does Price 'Fill' the Prior-Day Value Area? We Tested the 80% Rule on 7 Years of NQ
Market Profile's famous '80% rule' says that when price returns to the prior day's value area, it trades all the way through it ~80% of the time. We measured it on 7 years of NQ futures: the real number is about 45–50% — a coin flip — and a random band of the same width fills just as often. The value area isn't special. The data, with a control.
If you’ve studied Market Profile, you know the 80% rule: when price opens outside the prior day’s value area, returns to it, and accepts inside, it will trade all the way through to the other side of the value area roughly 80% of the time. It’s one of the most-repeated probabilities in all of trading — quoted as if it were a law of physics. So we measured it, properly, on seven years of NQ futures.
The real number is about 45–50%. A coin flip. And it gets worse for the rule: a random band of the same width fills just as often, so the value area isn’t even doing the work.
How we measured it
For every session we built the prior day’s cash-session value area (the 70% TPO zone, with its VAH, VAL and POC). Then, on each new day, we tracked what happened when price returned to that value area from outside — opened above the VAH and came back down to it, or opened below the VAL and came back up. From the moment price re-touched the edge, we measured how far through the value area it traveled before the close:
- Did it reach the midpoint (the POC)?
- Did it fill the area entirely (reach the far edge)?
- And the strict version: did it fill after accepting (closing) inside?
The probabilities
Here’s what seven years says, once price has returned to the value area:
returns to the value-area edge (from outside) ......  ~60%
  → reaches the midpoint / POC .....................  ~68%
  → fills the whole area (far edge) ................  ~45%
  → fills it after accepting inside ................  ~50%
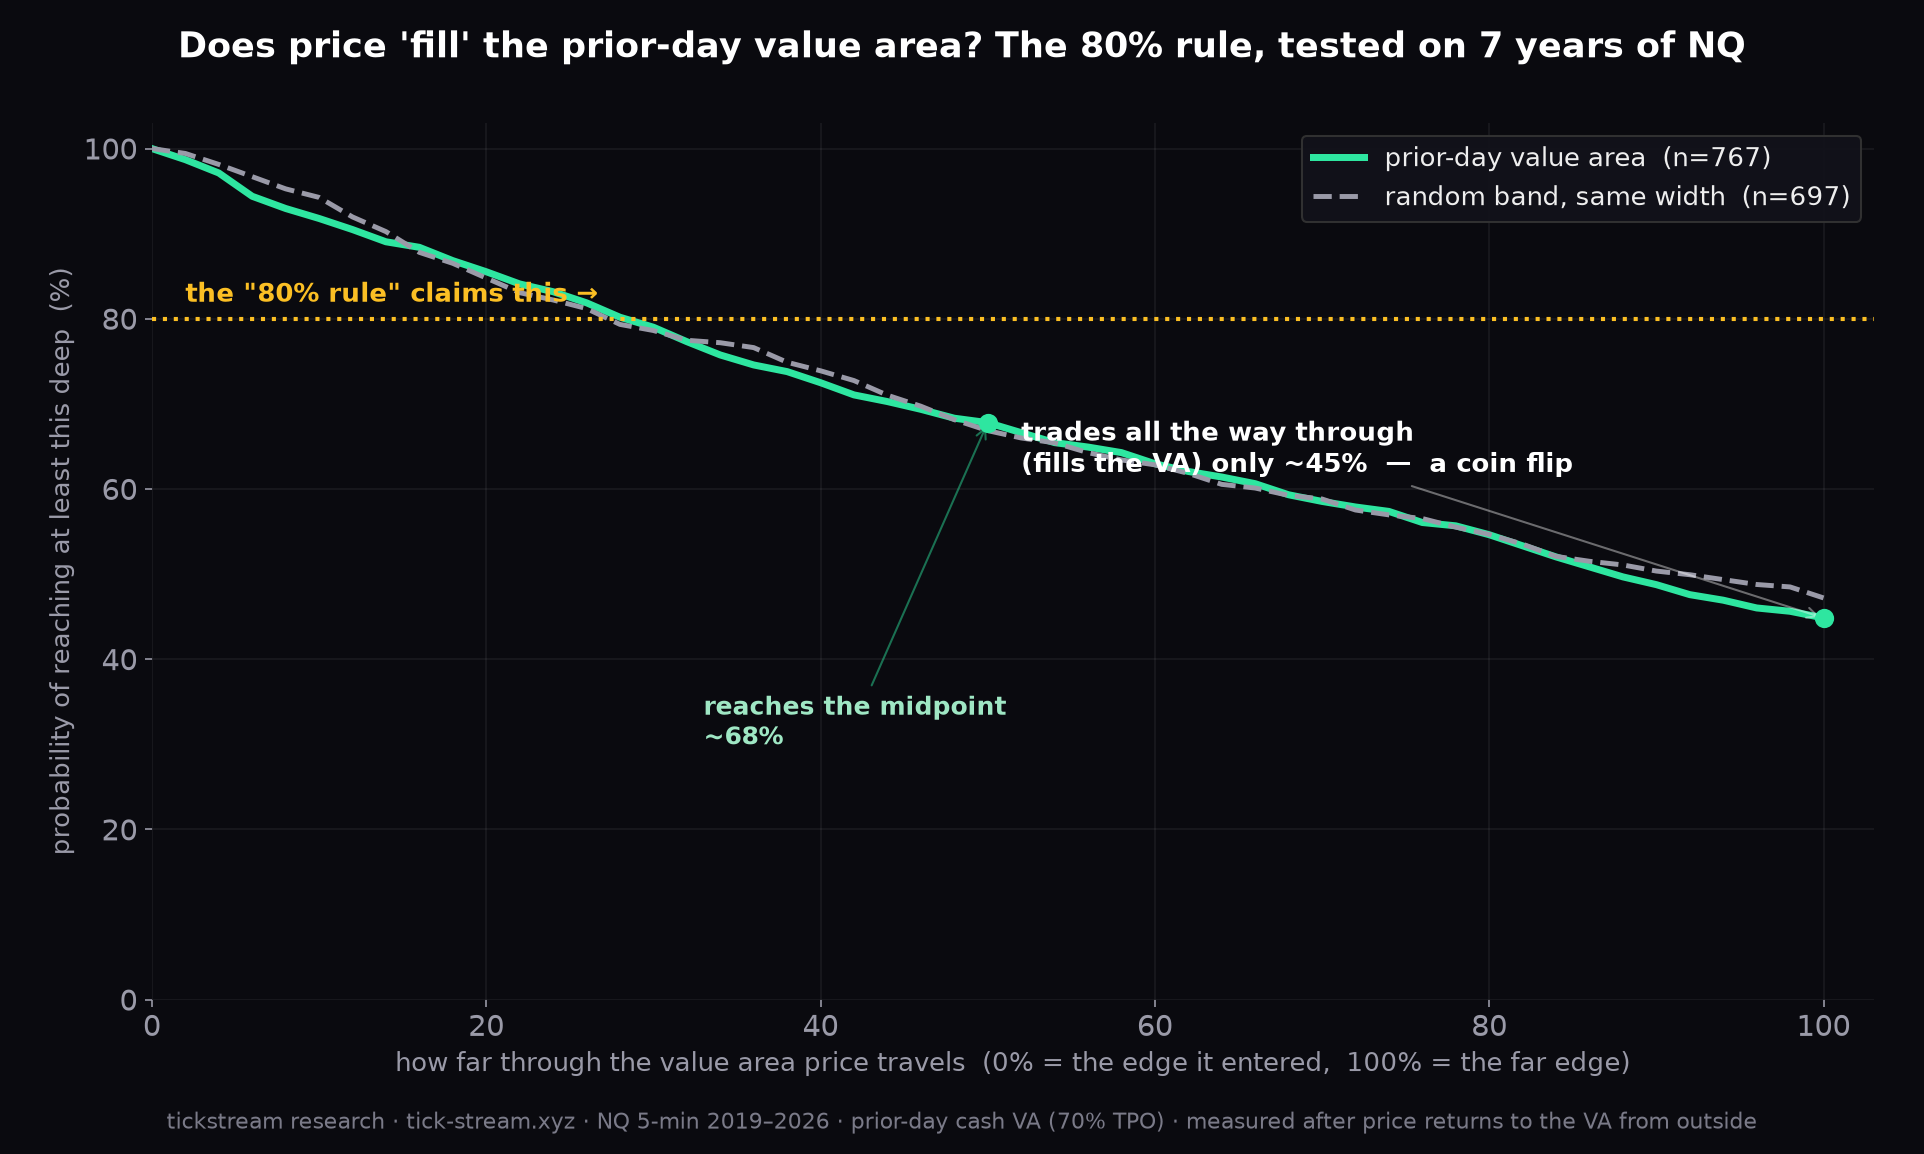
The green curve above is the whole story: it’s the probability that price penetrates at least a given depth into the value area. Near the edge it’s almost certain; by the midpoint it’s ~68%; by the far edge — the “fill” the 80% rule is about — it’s down to ~45%, nowhere near the dotted line where the rule says it should be. The decay is smooth. There is no special cliff at 80%, with or without the acceptance condition.
The control: the value area isn’t special
This is the part that should end the debate. We re-ran the exact measurement on a random band of the same width, placed away from the value area — a fake “value area” with no Market-Profile meaning at all. If the VAH and VAL were genuinely magnetic levels, the real value area should fill far more often than a random band.
It doesn’t. The random band (grey dashed line) sits right on top of the real one: it fills the far edge 47% of the time versus the real value area’s 45%, and reaches its midpoint 67% versus 68%. Statistically identical. The traversal probability is governed entirely by one thing — how wide the band is relative to the day’s range — and not at all by whether the band is “the value area.” The width is doing the work; the VAH and VAL are along for the ride.
Why the rule looks true anyway
Two reasons. First, selection: traders remember the clean days where price rotated neatly from one side of value to the other, and quietly forget the days it stalled at the POC or rejected the edge and left. Second, a definitional slide: “price reaches into value” — which really does happen ~68% of the time to the midpoint — gets reported as “price fills value,” which happens ~45–50%. Stack up enough marked-up screenshots and a roughly-even tendency starts to sound like an 80% law.
And no, you can’t trade the 50/50 either
A coin flip with the right payoff could still be tradeable — so it’s worth saying plainly that this one isn’t. The problem is the path. Fading the value-area edge toward the far side gets you stopped out on the ~50% of days that don’t fill (which tend to run, because price left value for a reason), while your winners are capped at the value-area width. We’ve tested every mechanical version of the value-area rotation and they all lose money after costs. A probability that’s neither far from 50% nor special is not an edge — it’s a description of geometry.
”But trade the 68% to the POC instead” — the win-rate trap
The natural next thought: forget the full fill — the POC gets reached ~68% of the time, so trade that. Enter at the value-area edge when price returns, and target the midpoint. We tested it, and it’s the same trap that sinks every “81% win rate” system. The chart below is the cleanest picture of it we’ve produced.
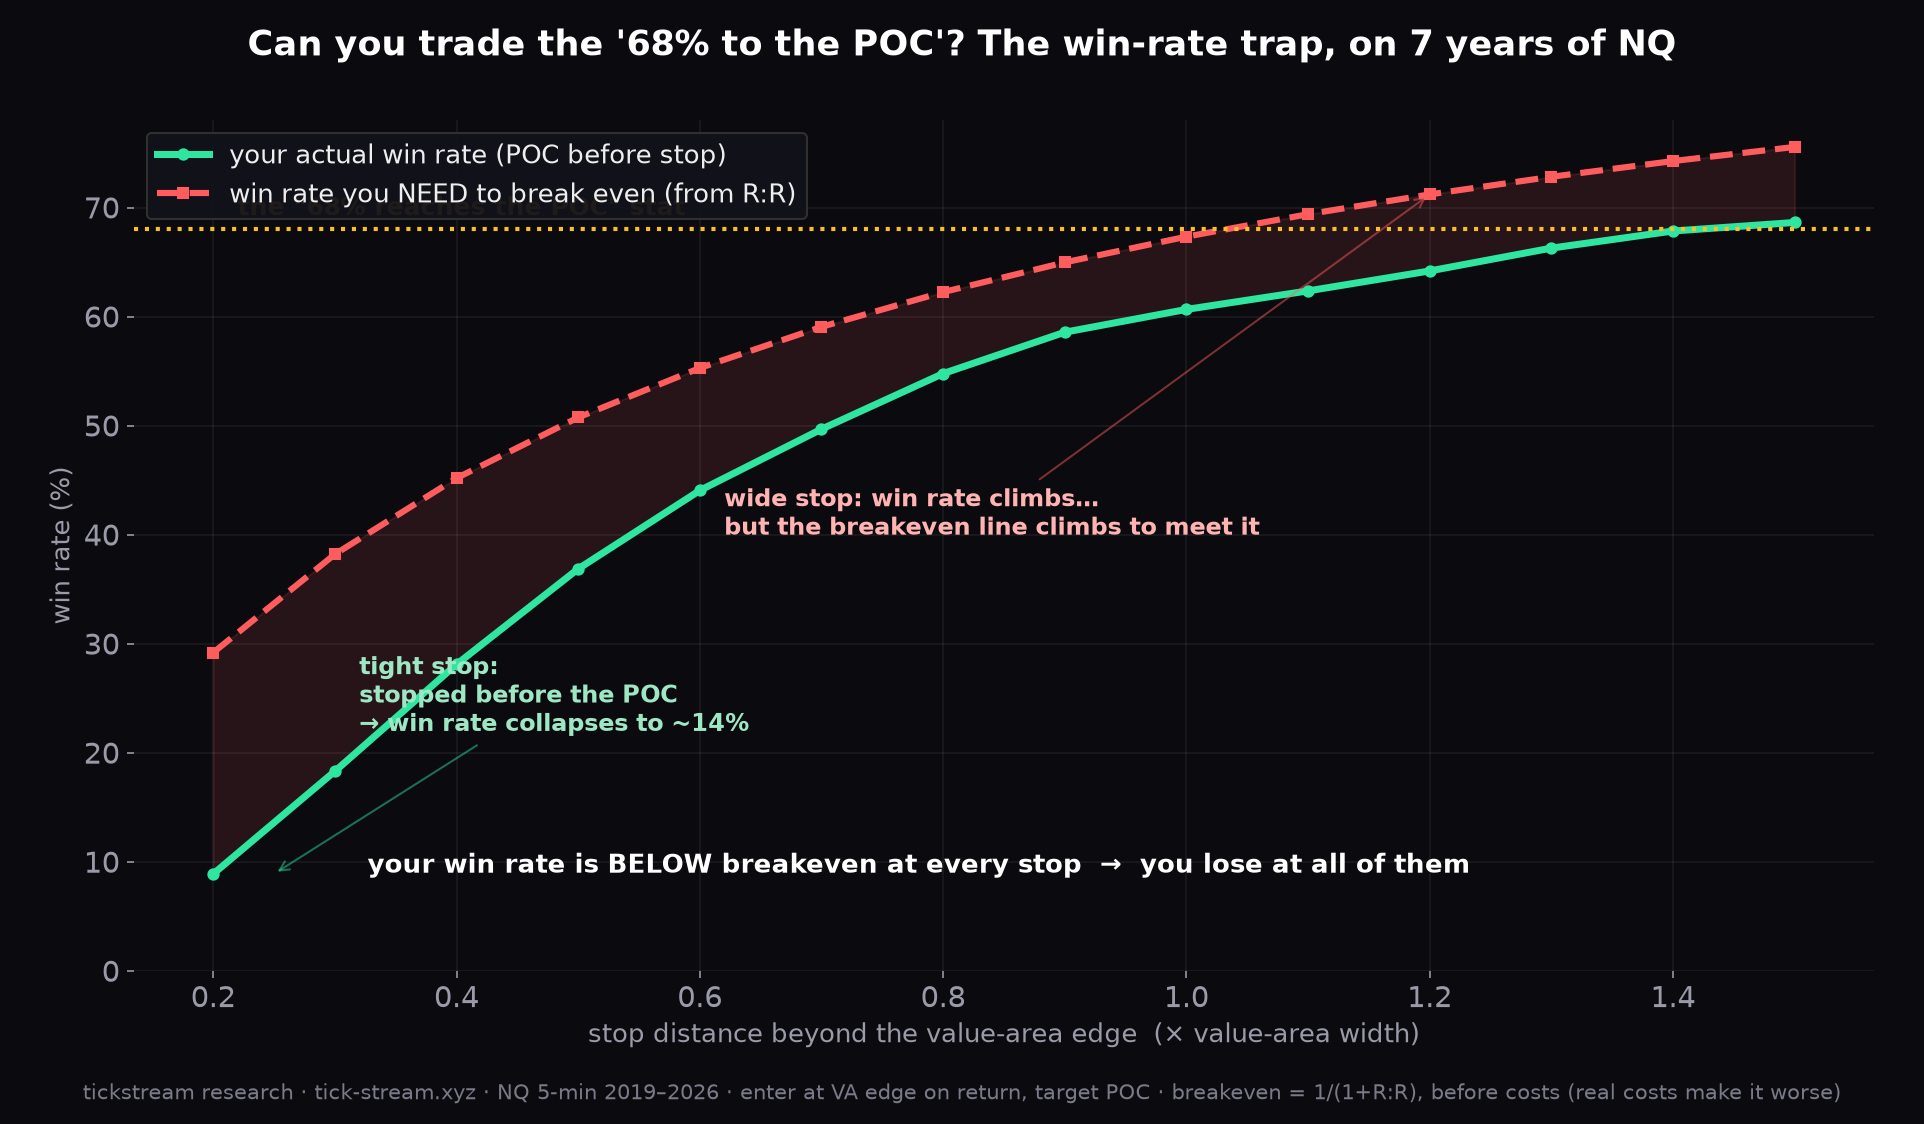
The 68% is a “reaches the POC at some point” statistic — not “reaches the POC before your stop.” Add a real stop and it comes apart:
- A tight stop (which gives you a good reward-to-risk) gets hit on noise long before price drifts to the POC — the win rate collapses to ~14%.
- A wide stop lets the win rate climb back toward the 68%… but now you’re risking two-to-three times what you’re targeting, so the win rate you need just to break even (the red line) climbs right alongside it.
The two lines never cross. At every stop distance we tested, the actual win rate sits below the break-even win rate the reward-to-risk demands — so the trade loses at all of them, with t-stats from −1.8 to −13.5 (the t-statistic measures a result against its own noise — beyond −2 it’s a reliable loss, not chance; the −13.5 end is about as conclusive as a backtest gets), before costs even bite. And the random band loses identically, so there’s nothing value-area-specific keeping it alive.
The mechanism is simple. When price doesn’t drift to the POC, it goes back the way it came — out of value, in the direction it was already moving — and those days run, taking your stop with them. You’re left fading the trend on precisely the days the trend is strongest. A high “touch” probability is never an edge when the misses are the big moves.
The bottom line
On seven years of NQ futures, the Market Profile 80% rule is really a ~50% rule, the full value-area fill happens less than half the time once price returns, and a random band of the same width does exactly the same thing — so the value area itself isn’t a meaningful level, just a zone of a certain width. The probabilities are real and kind of interesting, but they’re geometry, not magic, and they don’t survive contact with costs. If someone quotes you an 80% rule, ask them for the control.
Methodology: NQ continuous front-month, 5-minute bars, 2019–2026. Prior-day cash-session (9:30–16:00 ET) value area via 70% TPO (VAH/VAL/POC). Traversal measured from the first re-touch of the value-area edge after price opened outside; “acceptance” requires a subsequent close inside the area. Control = a band of identical width shifted one full width away (randomly above or below). Penetration depth normalised to the value-area width.
Frequently asked questions
Is the Market Profile 80% rule true?
Not on NQ. The 80% rule claims that when price returns to the prior day's value area and accepts inside it, it trades through the entire area (to the far edge) about 80% of the time. We measured it on seven years of NQ futures: after price returns to the value area from outside, it reaches the midpoint about 68% of the time but fills the whole value area only ~45% — and ~50% even when we require acceptance. That's a coin flip, not 80%.
How often does price fill the prior-day value area?
About 45% of the time it trades all the way through to the far edge once it has returned to the value area, rising to roughly 50% if you require price to accept (close) inside first. Reaching just the midpoint/POC is more common at ~68%. The deeper into the value area you ask price to travel, the lower the probability — a smooth decay, not a cliff at 80%.
Is the value area a 'special' level?
No. We ran a control: a random band of the same width placed away from the value area. It fills just as often as the real value area (47% vs 45%) and reaches its midpoint just as often (67% vs 68%). The traversal probability is a function of the band's width relative to the day's range — pure geometry — not of the value area being a meaningful level. The VAH and VAL aren't doing the work; the width is.
Can you trade the 80% rule even at 50/50?
Not profitably on NQ. A ~50% chance of filling the value area sounds like a fair coin you could trade with the right payoff, but the path kills it: fading the edge toward the far side gets stopped out on the days it doesn't fill, which run far, while the wins are capped at the value-area width. In separate testing, every mechanical version of the value-area rotation lost money after costs. A probability that isn't far from 50% and isn't special isn't an edge.
Price reaches the POC ~68% of the time — can you trade that?
No. The 68% is a 'reaches the POC at some point' statistic, not 'reaches it before your stop.' We tested entering at the value-area edge on a return and targeting the POC across every stop size. With a tight stop the win rate collapses to ~14% (you're stopped on noise before the POC); with a wide stop the win rate climbs back toward 68% but your reward-to-risk drops to ~0.5, so the break-even win rate you need climbs with it. At every stop distance the actual win rate stays below break-even — the trade loses at all of them (t = −1.8 to −13.5), and a random band loses identically. When price doesn't reach the POC it runs out of value the way it came, so the misses are the big moves. A high touch probability is not an edge.
Why does the 80% rule look true on charts?
Because of selection and a definitional slide. People remember the clean days where price rotated through value and forget the ones where it stalled at the midpoint or rejected the edge. And 'reaches into value' (common, ~68% to the midpoint) quietly gets reported as 'fills value' (~45–50%). Mark up enough hand-picked examples and any roughly-even tendency looks like a law.