The Earnings Calendar Spread Promises 90% a Year. We Tested 848 Earnings on Real Option Quotes
Sell the front expiry, buy 30 days out, hold one night through earnings and harvest the IV crush. The pitch claims $10,000 into $6 million over ten years at a 20% max drawdown. The IV crush is real — the front leg loses a median 28.9 vol points overnight while the back leg loses 6.3. But the round-trip bid/ask on those two legs is a median 50% of the capital at risk, and that is where the entire edge goes. At midpoints the strategy is flat; at any fill you can actually get, it is gone.
A reader sent over a strategy deck titled Volatility Crash Trading. The structure is clean, the reasoning is sound, and the numbers at the bottom are the kind that should make you check the numbers at the bottom.
The trade:
- sell the at-the-money call in the first expiry after the announcement
- buy the at-the-money call, same strike, roughly 30 days out
- enter at 15:45 ET, fifteen minutes before the close, before the company reports
- exit at 09:45 ET, fifteen minutes after the next open
- one night, about 18 hours, 15 of them with the market shut
You pay a net debit, and that debit is your maximum loss. The claimed track record: $10,000 into $6 million over ten years, 90% CAGR, 20% maximum drawdown, 66% win rate, Sharpe 3.5.
We tested it on 848 earnings events across 25 US large caps from 2014 to 2026, using real OPRA option quotes at 15-minute resolution — both legs, both timestamps, the actual bid and ask that existed at the moment the strategy says to trade.
First: the premise is completely correct
This is not a case of someone inventing a mechanism. The post-earnings IV crush is real, it is large, and the deck describes it accurately.
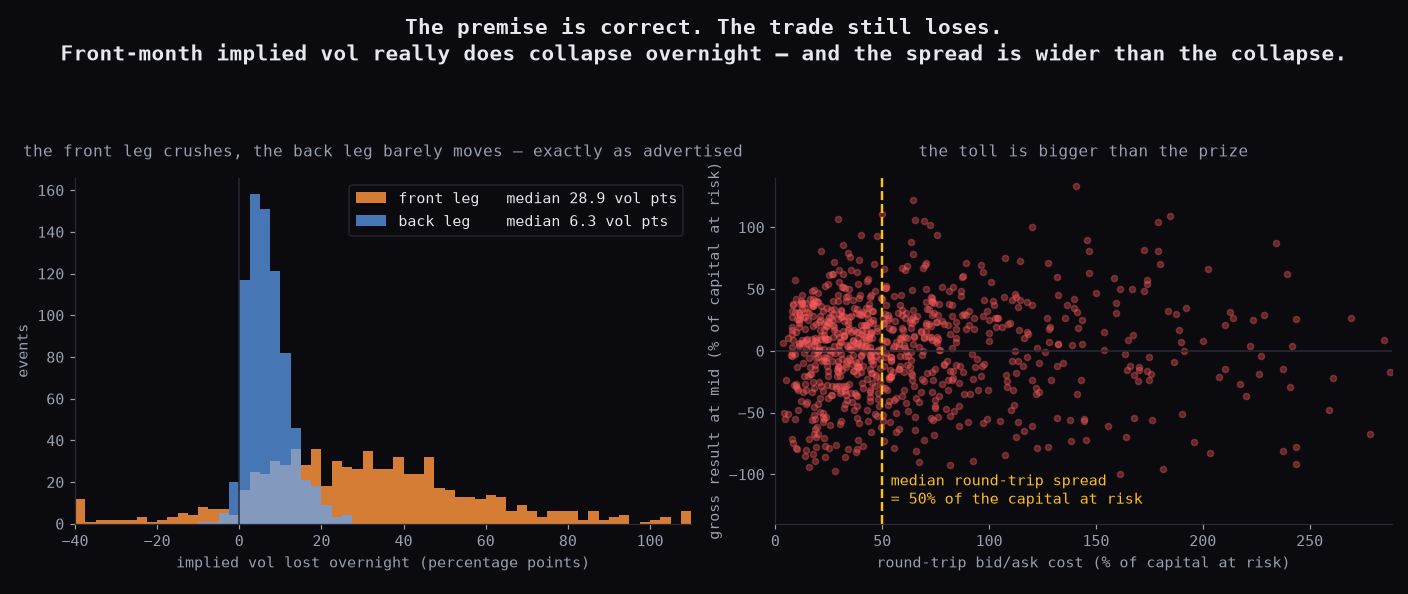
Between 15:45 the evening before and 09:45 the morning after, the front-expiry at-the-money call lost a median 28.9 implied-vol points. The ~30-day option, over the identical night, lost 6.3. The event risk really is compressed into the nearest expiry, and it really does evaporate the moment the numbers are out. The whole left panel is the strategy’s thesis, confirmed.
So the short leg does collapse in value faster than the long leg. The structure is pointed at a real phenomenon.
Then: what the position is actually worth
Here is where it comes apart, and it has nothing to do with the vol thesis.
An option is not worth its theoretical value. It is worth the bid if you are selling and the ask if you are buying, and this trade does four of those: sell the front and buy the back to open, buy the front and sell the back to close.
On single-name front-month options going into earnings — the exact contracts with the most uncertainty priced into them — those spreads are wide. Across our 848 events, the median round-trip bid/ask cost was 50% of the net debit. Half the capital you put at risk is handed over in tolls before the position has to be right about anything.
That is the right panel above: the vertical line is the median spread cost, and the scatter is what the position actually made at midpoint prices. The toll is bigger than the prize.
| Fill assumption | Win rate | Avg return per trade | t-stat |
|---|---|---|---|
| At the midpoint (impossible) | 54.6% | +0.70% | +0.46 |
| Spread order, quarter past mid | 39.3% | −16.2% | −9.75 |
| Crossing the full spread | 25.5% | −30.6% | −16.19 |
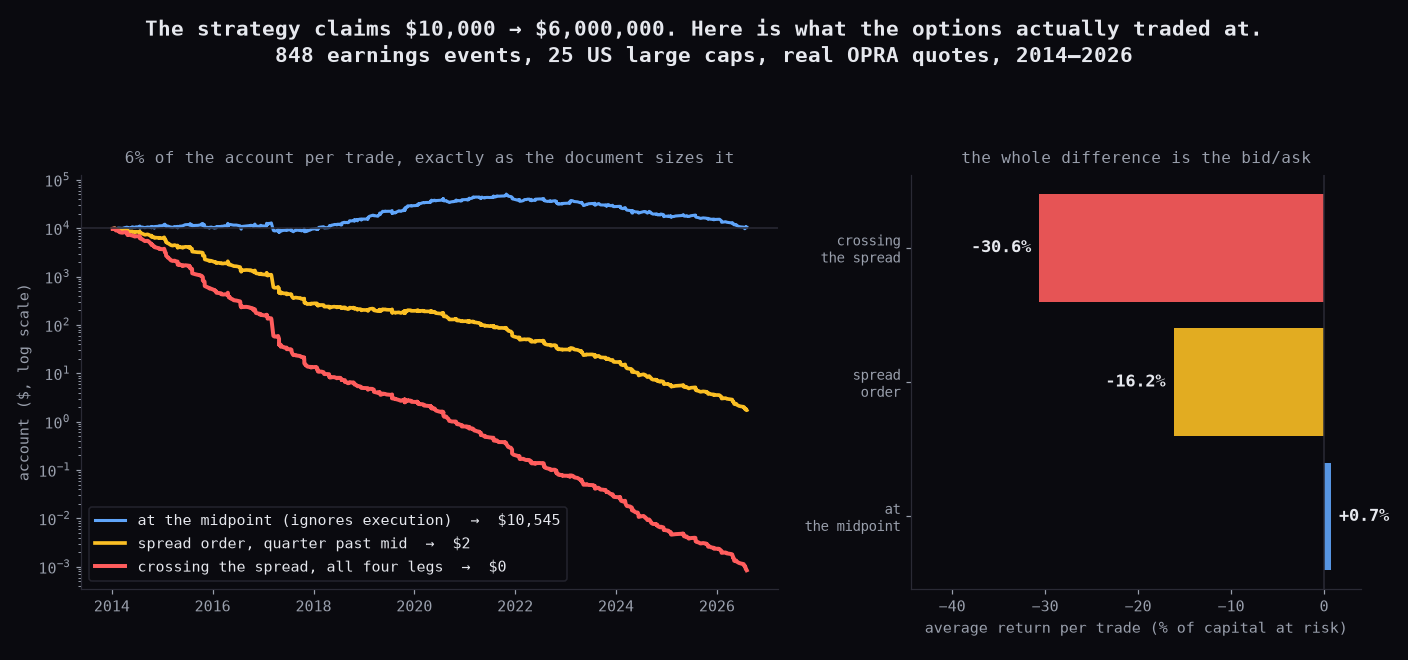
At midpoints the strategy is flat — a t-statistic of 0.46 is noise, not an edge. Which is itself the finding: even with free execution, harvesting the IV crush with a calendar spread earns nothing, because the market prices the crush into the debit you pay. You are buying a known event at a fair price.
And free execution is not on the menu. At a generous fill — working the spread as one order and getting a quarter of the way past mid, which is realistic in liquid names — you lose 16.2% of your capital at risk on the average trade.
The claims, side by side
Sizing at 6% of the account per trade, exactly as the deck specifies (10% Kelly):
| CAGR | Max drawdown | Sharpe | Win rate | $10,000 becomes | |
|---|---|---|---|---|---|
| Claimed | 90% | −20% | 3.5 | 66% | $6,000,000 |
| Measured, midpoint | 0.4% | −80.8% | 0.09 | 54.6% | $10,545 |
| Measured, spread order | −49.8% | −100% | −1.97 | 39.3% | $2 |
| Measured, full spread | −72.6% | −100% | −2.81 | 25.5% | $0 |
Note the drawdown column, because it is the most revealing part. Even in the fantasy scenario where every fill is free, the account draws down 80.8% — four times the claimed maximum. A structure whose worst case is losing the entire debit, sized at 6% of the account and run 70 times a year, cannot produce a 20% maximum drawdown. That number is not achievable by this strategy under any pricing assumption, which means it did not come from trading it.
At realistic fills, every one of the thirteen calendar years lost money.
Three details worth more than the headline
The entry filter admits everything. Rule 1 says to take the trade only when front-expiry IV sits above the 30-day — “the short leg must be more expensive than the long leg.” That was true on 847 of 848 events, 99.9%. Going into a scheduled announcement, front-month vol is essentially always elevated. The rule reads like a selective condition and functions as a description of the weather. A filter that admits everything is not a filter, and its presence in a strategy deck creates a false sense of discrimination.
The prescribed exit is the worst one available. The deck says to get out as early as possible — 09:45, fifteen minutes after the open — because the crush is instant. The crush is instant. But 09:45 is also when option spreads are at their widest, and you are paying them to exit something that has already happened:
| Exit time | Avg return per trade | Win rate |
|---|---|---|
| 09:45 (as prescribed) | −16.2% | 39.3% |
| 10:30 | −12.0% | 40.9% |
| 12:00 | −8.4% | 44.6% |
| 15:45 | −6.3% | 45.8% |
Waiting does not rescue the trade. But the timing rule presented as precision is costing about ten percentage points a trade, which is a large fraction of the total loss.
The example payoff is not reachable overnight. The deck illustrates a position with a $6,755 debit and a “max profit” of $8,955 — a 132% return. That figure is the payoff at front expiry with the stock pinned exactly at the strike. It is not available to a position held for one night and closed the next morning, which is the strategy being described. The illustration and the trade are two different things.
What this actually teaches
The interesting part of this backtest is not that the strategy loses. It is where it loses.
The vol thesis is right. The structure correctly isolates the effect. The entry and exit timing are precisely specified. Every piece of reasoning above the execution layer holds up — and the strategy still returns nothing at midpoint and bleeds at any real fill, because the effect it harvests is smaller than the cost of harvesting it.
This is the failure mode that a backtest built on theoretical option values will never show you. Price both legs off a model, or off the mid, and you get a strategy that looks flat-to-decent and can be tuned into looking good. Price them off the bid and the ask that actually existed, and 50% of your capital at risk disappears into the spread before the thesis gets a vote.
If you are evaluating any multi-leg options strategy, that is the number to demand first: what is the round-trip bid/ask as a percentage of the capital at risk? If it is a meaningful fraction of the expected move, nothing downstream matters. For earnings calendar spreads on single names, it is half.
Methodology: 848 earnings events across 25 US large caps (AAPL, MSFT, NVDA, AMZN, GOOGL, META, TSLA, NFLX, AMD, CRM, ADBE, ORCL, QCOM, AVGO, INTC, MU, COST, WMT, JPM, DIS, BA, CAT, GS, V, PYPL), January 2014 to August 2026, from 1,263 candidate events — the rest dropped where the ATM strike was not listed on the back board, or quotes were unavailable. Earnings dates and their before-open/after-close timing from Yahoo Finance; announcements after the close hold that night, announcements before the open are entered the prior session. Option quotes and implied vol from OPRA at 15-minute resolution via ThetaData. Front expiry is the first listed after the announcement; back expiry the one nearest 30 days out; strike is the at-the-money call at 15:45, identical on both legs. Where a quote was missing at the exact minute, the next two-sided market that session was used. Three fill conventions reported throughout: midpoint on both legs, a spread order filling a quarter past mid, and crossing the full bid/ask on all four legs. Position sizing 6% of the account per trade as specified, compounded in event order; returns measured against the net debit, which is the trade’s maximum loss.
Frequently asked questions
Does the post-earnings IV crush actually happen?
Yes, and it is large and reliable. Across 848 earnings events on 25 US large caps from 2014 to 2026, the at-the-money front-expiry call lost a median of 28.9 implied-vol points between 15:45 the day before the announcement and 09:45 the morning after. The ~30-day option lost only 6.3 points over the same night. The mechanism the strategy is built on is exactly as described — the event risk is priced into the nearest expiry and evaporates on the announcement.
Is the earnings calendar spread profitable?
Not at any price you can trade. Valued at the midpoint of the bid/ask on both legs — which nobody gets — the strategy averaged +0.70% of the capital at risk per trade, a t-statistic of 0.46, statistically indistinguishable from zero. Filled as a spread order a quarter of the way past mid, it averaged −16.2%. Crossing the full spread on all four legs, −30.6%. The reason is in one number: the median round-trip bid/ask on the two legs is 50% of the net debit, so the toll is larger than anything the position can win overnight.
Can you really turn $10,000 into $6 million with calendar spreads?
Not on this data. Sizing at 6% of the account per trade exactly as the strategy specifies, $10,000 became $10,545 over twelve years at midpoint pricing — a 0.4% CAGR against a claimed 90% — and that came with an 80.8% drawdown against a claimed 20%. At realistic spread-order fills the account ends at $2. Every one of the thirteen calendar years was negative at realistic fills.
Does the IV backwardation entry rule filter anything?
No. The rule says to enter only when front-expiry implied vol is above the ~30-day implied vol. That condition held on 847 of 848 earnings events — 99.9% of them. Front-month vol is essentially always elevated over the 30-day going into a scheduled announcement, so the rule describes the normal state of the world rather than selecting anything. A filter that admits everything is not a filter.
Should you exit an earnings calendar spread right after the open?
That is the worst version of the trade, in our data. The strategy prescribes exiting 15 minutes after the open, at 09:45, which is when option spreads are at their widest. Holding longer lost less at every step: −16.2% per trade exiting at 09:45, −12.0% at 10:30, −8.4% at noon, −6.3% by 15:45. Waiting does not make the trade profitable, but the prescribed timing actively makes it worse — you are paying the widest spread of the day to capture a vol collapse that has already happened.