We Audited the Viral 'Institutional Protocol' ORB Validation — On Real Tick Data, $151k Becomes $42k
Fabio Valentini's IVB opening-range-breakout model, 'independently validated' by Matfin OG with bootstrap, permutations and 20,000 Monte-Carlo sims: P(no edge)=0.001, VALIDATED/DEPLOYABLE. We re-executed the published EasyLanguage rules bar by bar on real NQ tick data — same window, same costs. The code is clean, the delta filter genuinely helps, and the same-bar fill trap we hunted for isn't there. But the headline numbers don't reproduce: +$42k instead of $151k, 52.6% win rate instead of 58%, t=0.96, with almost all profit in a single year. The lesson is bigger than one strategy: a bootstrap on a trade log validates the log — not the strategy.
This one is different from our usual debunks: it arrives with code, with a cost model, and with a statistics section that would pass most desk reviews. Fabio Valentini (@fabervaale) published a long-only NQ opening-range-breakout model; Matfin OG (@matfinog) wrapped it in a 16-page “Institutional Protocol”: bootstrap confidence intervals, 1,000 shuffled sequences, 20,000 Monte-Carlo simulations, a commission-loaded re-run, and a verdict — “VALIDATED / DEPLOYABLE”, net profit $151,013, P(no edge) = 0.001.
Publishing the full EasyLanguage source is exactly what the space needs more of, and it deserves a straight answer in kind. So we did the one thing the report itself says nobody did: re-execute the strategy, rule by rule, on raw market data — our own NQ tick store, real trades, real aggressor delta, their window (Jan 2021 – Apr 2026), their cost model.
The rules (from the published source)
Build the range from 08:30–09:00 NY. From 09:00 until 14:00, buy the first 5-minute close above the range high that prints with bar delta ≥ 200. Stop at the range low, target at +1R (entry minus range low), flat at cutoff, one trade a day, one contract. Clean, mechanical, fully specified — a spec we can test without interpretation arguments. (One wrinkle: the PDF’s prose says positions flatten at 15:00, its inputs panel says 14:00. We ran both; it doesn’t change the verdict.)
What reproduces — credit first
The code is honest. No lookahead, no repainting, correct next-bar order semantics. And the classic trap in this construction — take-profit limit and stop-loss stop live simultaneously, so a backtest engine must guess which filled first when both land in one bar — turns out to be structurally defused here: because both exits sit a full range-width from entry, TP and SL fall inside the same 5-minute bar on just 0.4% of trades. We ran stop-first (honest) and target-first (the engine’s best case) at 1-minute resolution: identical results. Whatever explains the gap below, it is not that.
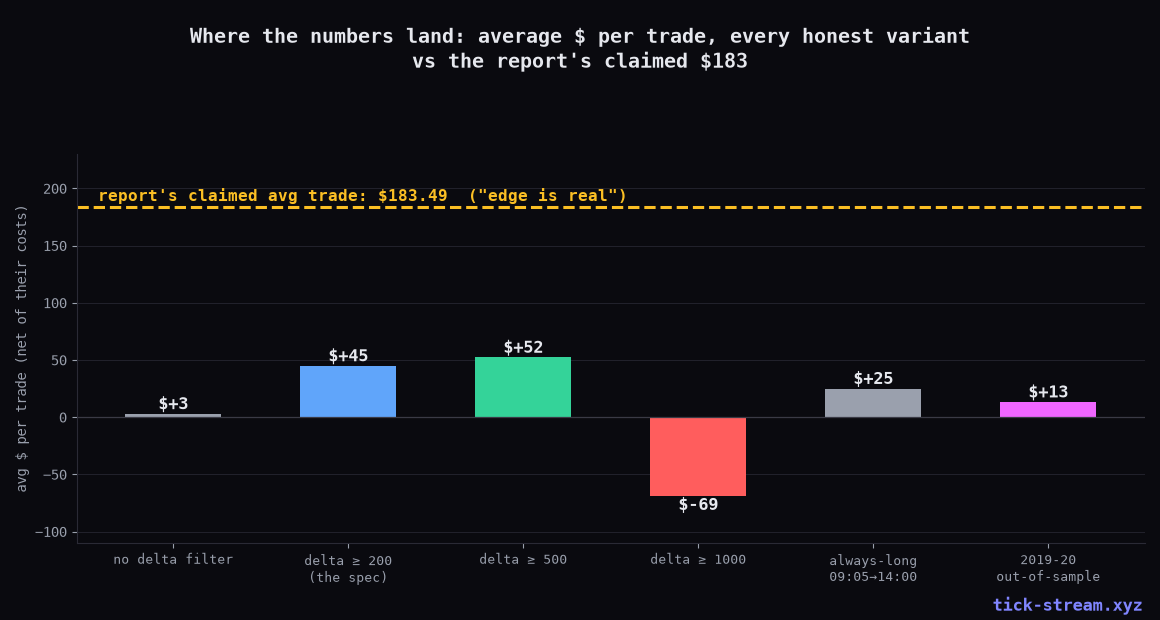
The delta filter is real. On identical rules with real aggressor delta from the tape: no filter = +$3 per trade. Delta ≥200 = +$45. Delta ≥500 = +$52. The idea that a breakout confirmed by aggressive buying is better than a bare breakout survives on real data. (It has a ceiling — at ≥1000 the filter over-selects into −$69 — but the concept works.)
What doesn’t reproduce — the headline
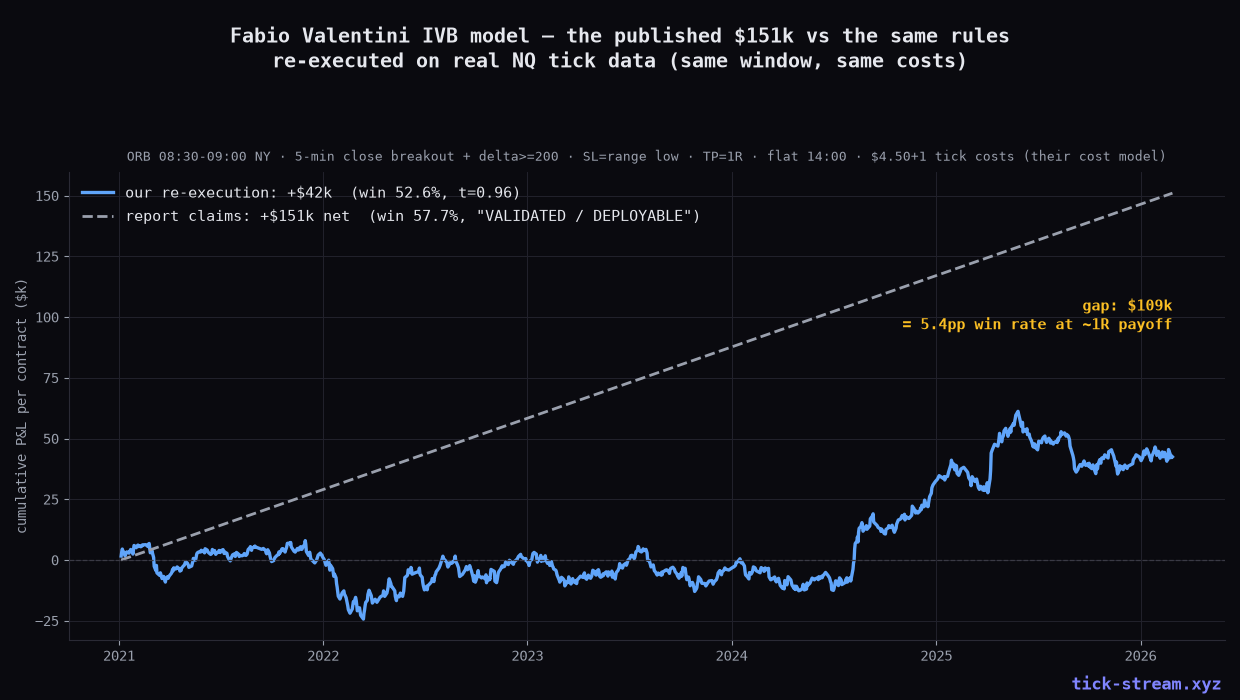
Same rules, same window, same costs: +$42,458 on 945 trades, average trade +$45, win rate 52.6%, t = 0.96 — statistically indistinguishable from zero. The report prints $151,013 on 823 trades, average $183, win rate 57.7%.
The entire gap is the win rate. With symmetric ~1R exits, 5 percentage points of hit rate ≈ $109k over 900+ trades. So the question becomes: what produces 58% winners in MultiCharts but 52.6% on the real tape? We ruled out the fill-priority assumption (0.4% ambiguity), exit-time readings (15:00 and 16:00 are worse), and every delta threshold from 0 to 4000 (nothing approaches $183/trade — see below). What remains is the input side: MultiCharts’ UpTicks/DownTicks on vendor minute data is an approximation of order flow, and vendor bar feeds are an approximation of the tape. Resolution: the report’s own limitations section, to its author’s credit, says it plainly — “no independent re-execution of the strategy on raw market data was performed.”
The shape problem
The report’s equity curve climbs smoothly from $100k to $265k — “no regime breaks.” The real-tick equity looks nothing like that:
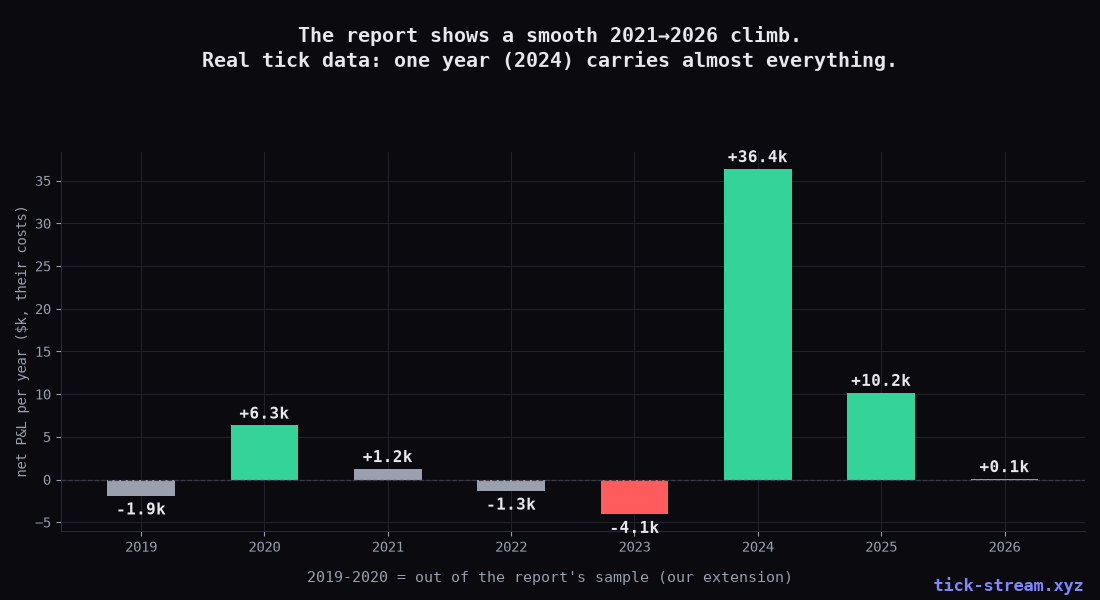
2021: +$1.2k. 2022: −$1.3k. 2023: −$4.1k. 2024: +$36.4k. 2025: +$10.2k. One year carries the sample. Extend out of the report’s window into 2019–2020 and the model adds +$4.4k at t=0.29 — nothing. An always-long control (buy 09:05, sell 14:00, no range, no filter) makes +$25/trade over the same period, so a meaningful slice of the model’s +$45 is morning drift in a bull sample. That is a regime artifact with a good filter on top, not a smooth institutional edge.
The bigger lesson: you can’t bootstrap your way out of bad fills
This is the part worth keeping after the specific numbers fade. The Protocol’s statistics are competent — and they are all conditioned on one object: the MultiCharts trade log. Bootstrap, permutation, Monte Carlo — every resample redraws from the same 823 fills. If the fills are optimistic, the resamples are optimistic with P = 0.001 confidence. Resampling machinery quantifies sampling uncertainty; it is silent about measurement error. The only test that catches measurement error is re-execution against independent, higher-resolution data — which is precisely the step that flips this verdict from “VALIDATED / DEPLOYABLE” to “weak, insignificant, regime-concentrated.”
Our own ORB research lands in the same place from the other direction: symmetric fixed-target breakouts hover near breakeven, and the one ORB variant that survived our full battery (Daybreak / ORB30) needed an asymmetric stop/target and still runs as a disclosed live paper test, not a $151k claim.
Verdict
| Claim | Our finding |
|---|---|
| Net $151k, avg trade $183 | +$42k, avg $45 (real ticks, same window & costs) |
| Win rate 57.7% | 52.6% |
| P(no edge) = 0.001 | t = 0.96 — not significant |
| Smooth equity, no regime breaks | 2024 carries ~85% of the P&L; 2021–23 flat/negative |
| Code quality | ✅ clean — no lookahead, fill trap structurally absent |
| Delta filter | ✅ real: +$3 → +$45/trade on identical rules |
To Fabio and Matteo: props for publishing the source — it’s the only reason this audit was possible, and both the code quality and the filter idea held up. The invitation stands: run the model against raw tick data (our free 2-month NQ tick + L2 sample is enough to see the win-rate gap appear), and if you get numbers we can’t, we’ll publish the follow-up. Got a strategy of your own you want put through this machine? Send us the full rules.
Methodology: NQ front-month tick store 2019–2026, real trades, aggressor side via quote rule against the prevailing BBO. ORB from 1-minute bars 08:30–09:00 NY; signals on 5-minute closes 09:05–14:00; real volume-delta for the filter (thresholds 0–4000 tested); management on 1-minute bars, stop-checked-before-target plus the optimistic variant; exits 14:00/15:00/16:00 tested; costs $4.50+1 tick (their model) and $14.50+1 tick (house standard); stale-range placebo and always-long drift control. All figures per single contract. This is research, not trading advice; our live, disclosed track records are on /algos.
Frequently asked questions
What is the Fabio Valentini IVB model?
A long-only opening-range breakout on NQ futures: build the range from 08:30–09:00 New York time, then buy the first 5-minute close above the range high that comes with a bar delta (UpTicks−DownTicks) of at least 200, any time until 14:00. Stop-loss at the range low, take-profit at one R (the entry-to-range-low distance), flat at session cutoff, one trade per day, one contract. The full EasyLanguage source was published in the 'Institutional Protocol' PDF, which is what made an independent re-execution possible.
Is the published validation wrong?
The statistical machinery is competently built — bootstrap confidence intervals, 1,000 permutations, 20,000 Monte-Carlo resamples, a cost-adjusted re-run. The problem is what it was pointed at: every one of those tests resamples the MultiCharts trade log. If the log's fills are more favorable than real market data, all downstream statistics inherit that bias with full confidence. The report itself discloses this: 'the validation is conducted on the author-supplied MultiCharts trade log; no independent re-execution of the strategy on raw market data was performed.' We performed exactly that missing step, and the numbers do not carry over: +$42,458 vs the claimed $151,013 over the same window with the same cost model.
Where does the $109k difference come from?
Win rate. The report prints 57.7% winners after costs; real tick data produces 52.6% on 945 trades — with take-profit and stop at symmetric ~1R distances, those 5 percentage points are worth almost exactly the missing $109k. We tested whether their engine's same-bar fill assumption explains it (it doesn't — TP and SL land in the same 5-minute bar on only 0.4% of trades), whether a later exit matches (worse), and whether any delta threshold gets there (the filter peaks at +$52 per trade at ≥500 and turns negative at ≥1000). No honest configuration reaches the published numbers. The remaining candidates are the data feed's UpTicks/DownTicks approximation on minute bars and fill assumptions inside the vendor engine.
Does the strategy work at all?
It's not a disaster — it's a weak, statistically insignificant positive. On real ticks, the exact spec nets +$42k over 2021–2026 with their $9.50 round-trip cost model (t=0.96), and +$34k over the full 2019–2026 sample at our harsher $19.50 costs. But the equity shape matters: 2021–2023 is flat to negative, and one year — 2024 — contributes +$36k of the +$42k. The 2019–2020 out-of-sample extension adds nothing (t=0.29). That is regime concentration, not a smooth deployable edge, and it is inconsistent with the report's smoothly rising equity curve.
What's genuinely good in the IVB model?
Three things earned props in our audit. The published EasyLanguage is clean: no lookahead, correct order sequencing, honest entry at the signal close. The dreaded same-bar TP/SL ambiguity is structurally rare in this design (0.4%) because both exits sit a full range-width away from entry. And the delta filter is real: on identical rules, real aggressor delta ≥200 improves the average trade from +$3 to +$45 — the filter concept survives contact with real data even though the headline numbers don't.
How was this audit run?
We rebuilt the strategy bar by bar from the published source on our own NQ tick store (2019–2026): 1-minute bars from real trades, aggressor side via quote rule, the opening range from 08:30–09:00 NY, 5-minute signal closes, real volume-delta for the filter, and trade management at 1-minute resolution with stop-checked-before-target. We ran their exact window and cost model ($4.50 + 1 tick), our house costs, both fill-priority assumptions, exit-time variants (the PDF's text says 15:00, its inputs say 14:00 — we tested both), delta thresholds from 0 to 4000, a stale-range placebo and an always-long drift control.