A Random Anchor Beats Three of the Four Meaningful Ones on ES
We ran anchored VWAP on 12.5 years of S&P 500 futures with five different anchors and nothing else changed. All five make money and all five clear significance, from t = 4.53 to t = 7.65. But an anchor placed at a bar drawn at random pays +$30.05 a trade against +$23.99 for the average of the four meaningful anchors, a difference of −$6.06, and only 1 of the 4 beats it. The two anchors the literature recommends most, the swing high at +$13.25 and the swing low at +$19.35, are the two worst columns in the table.
Anchored VWAP pays on the S&P 500. The anchor does not. We ran the same machine five times over 868,567 ES 5-minute bars, changing nothing but the bar the volume-weighted average starts from, and the line anchored at a randomly chosen bar returned +$30.05 a trade against +$23.99 for the average of four meaningful anchors.
Only one of the four meaningful anchors beat the coin. The two the literature pushes hardest, the swing high and the swing low, finished last and second to last.
The claim being tested
The anchored-VWAP literature is large and the claim is consistent. Anchor the volume-weighted average to a meaningful point, a swing high, a swing low, the session open, the heaviest-volume bar of the move, and price will respect the line that runs forward from it. The anchor is presented as the skill. Choose the right origin and the line becomes a level; choose a careless one and it is nothing.
That is a testable claim, and the way to test it is not to check whether anchored VWAP makes money. It is to run a meaningless anchor beside the meaningful ones with everything else held fixed.
The rule
The design matters more than the numbers here, so it goes first. Every column below runs identical machinery:
- ES 5-minute bars, 868,567 of them, 2 January 2014 to 10 September 2026.
- Pick an anchor bar by one of five rules.
- Build the running volume-weighted average forward from that bar, on typical price times volume.
- Wait at least 20 bars, then take the first pullback whose range touches the line, and only within 390 bars of the anchor. After that the line is dropped.
- Direction from the side price sits on: above the line, trade it as support; below, as resistance.
- Entry at the line. Stop one ATR(14) away, target two ATR, out after 48 bars.
- One position at a time. A new anchor is skipped entirely while a trade is open.
- A bar containing both stop and target is scored as the stop.
The five anchor rules: the high of a 60-bar centred window, the low of a 60-bar centred window, the 09:30 session open, the biggest-volume bar of a 60-bar centred window, and a bar drawn at random from a fixed seed. Nothing else differs between columns.
The one-position rule is not decoration. The first version of this test on our NQ book allowed overlapping positions and ran up to twenty at once, a book nobody could have carried and a result that was therefore never real. That run is internal and unpublished. This is why the constraint is written into the test file rather than left to judgment.
Costs are $4.50 commission plus two ticks of slippage per round trip. An ES tick is $12.50, so $29.50 comes off every trade in every number below.
All five columns pay
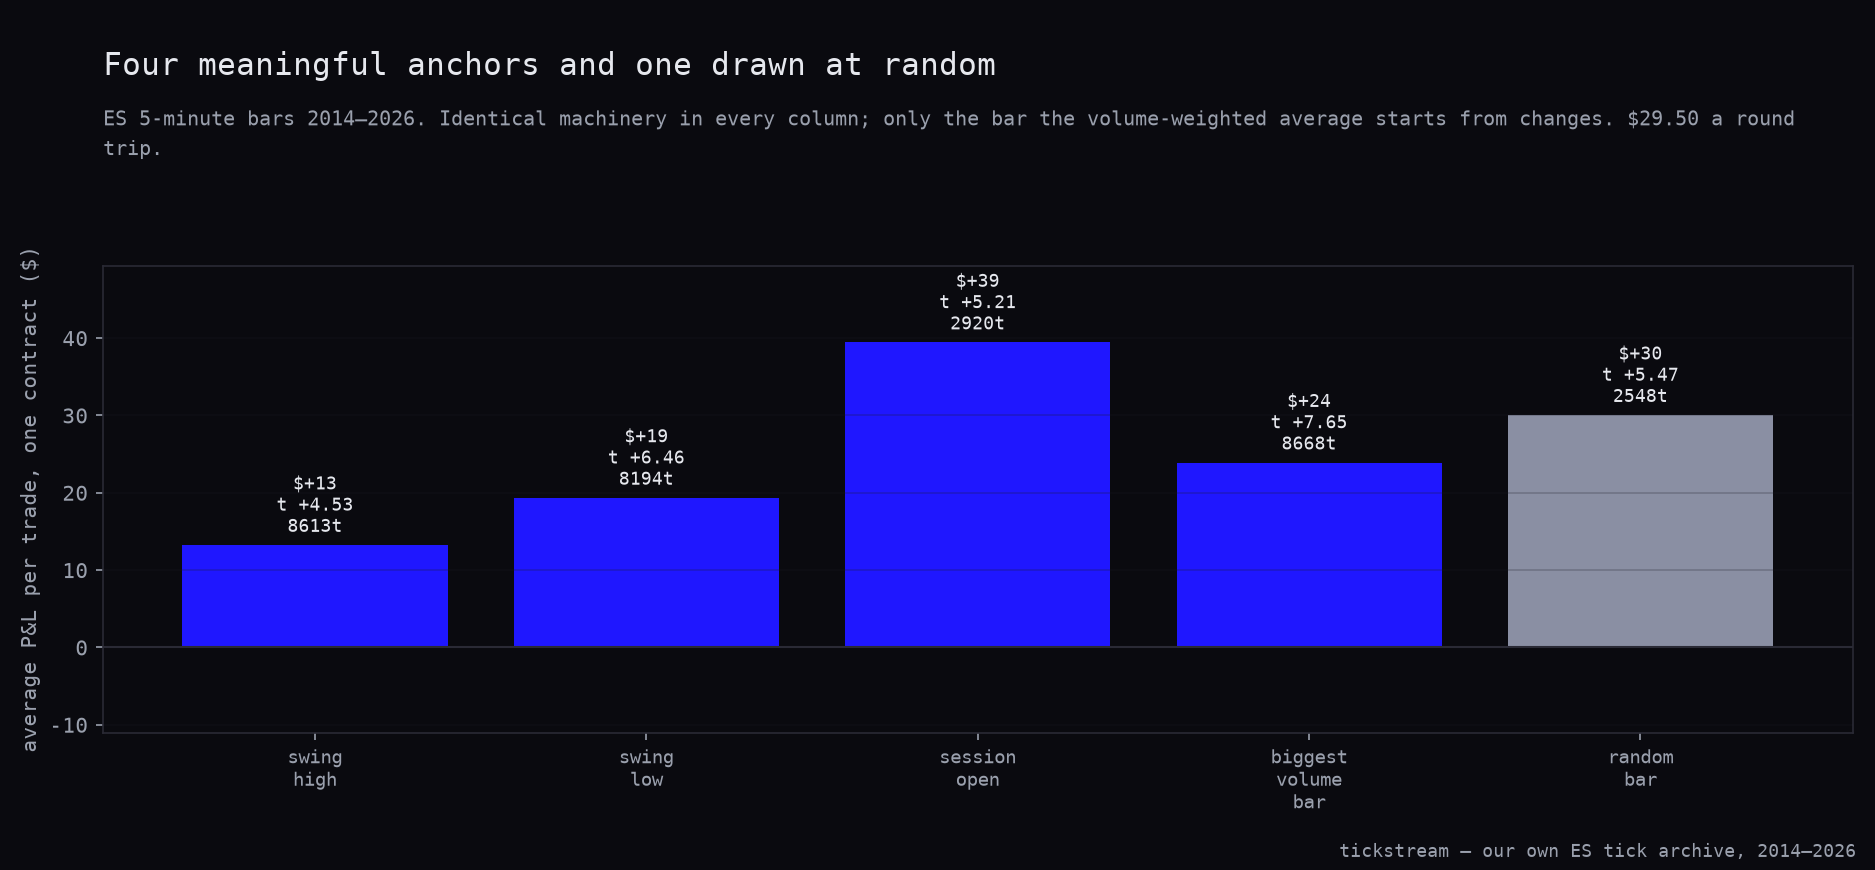
The chart puts the five average per-trade results side by side, with the random anchor in grey. It is not the short bar.
| Swing high | Swing low | Session open | Biggest volume bar | Random bar | |
|---|---|---|---|---|---|
| Trades | 8,613 | 8,194 | 2,920 | 8,668 | 2,548 |
| Win rate | 44.2% | 45.4% | 44.5% | 46.0% | 46.9% |
| Average per trade | +$13.25 | +$19.35 | +$39.44 | +$23.91 | +$30.05 |
| Total, one contract | $114,149.46 | $158,591.17 | $115,175.41 | $207,286.55 | $76,560.27 |
| Profit factor | 1.152 | 1.222 | 1.295 | 1.272 | 1.364 |
| Sharpe (per trade) | 1.27 | 1.81 | 1.46 | 2.15 | 1.54 |
| t | 4.53 | 6.46 | 5.21 | 7.65 | 5.47 |
| Stops | 4,731 | 4,431 | 1,609 | 4,652 | 1,336 |
| Targets | 3,772 | 3,669 | 1,267 | 3,954 | 1,185 |
| Timeouts | 110 | 94 | 44 | 62 | 27 |
Every one of the five makes money and every one clears significance, the weakest at t = 4.53 and the strongest at t = 7.65. That deserves to be stated plainly rather than buried under the anchor result: the line works.
It is also consistent with what we found earlier in this series. A resting limit into a dip, in an index that mean-reverts intraday, pays. That is the same effect we measured on the ES trend-pullback port, where the pullback carried the result and the wick filter attached to it cost money. Here the pullback carries the result again, and the anchor is the ornament.
The anchor is worth −$6.06
The four meaningful anchors average +$23.99 a trade. The random anchor pays +$30.05. The difference is −$6.06 in favour of the coin, and 1 of 4 meaningful anchors beats it.
The one that does is the session open, at +$39.44 a trade, the best column in the table by average. The two that do worst are the swing high at +$13.25 and the swing low at +$19.35. Those two are precisely the anchors the literature recommends first. The two anchors with the most theory behind them are the two worst columns in the run.
Our reading of the session open, and we label it as a reading rather than a measurement: it is the only anchor on the list that everybody watches at the same moment, and it resets daily, so the line never drifts far from price. Both properties are about where the orders are and how tight the pullback is. Neither is about the origin bar meaning anything. That is a liquidity story, not an anchor story, and this test does not isolate it.
The equity curves say the same thing over time rather than in aggregate, and the legend carries each column’s trade count because that is what separates the curves. The random anchor finishes lowest in total dollars, at $76,560.27, on the fewest trades of the five at 2,548 — while paying the most per trade of any column at +$30.05.
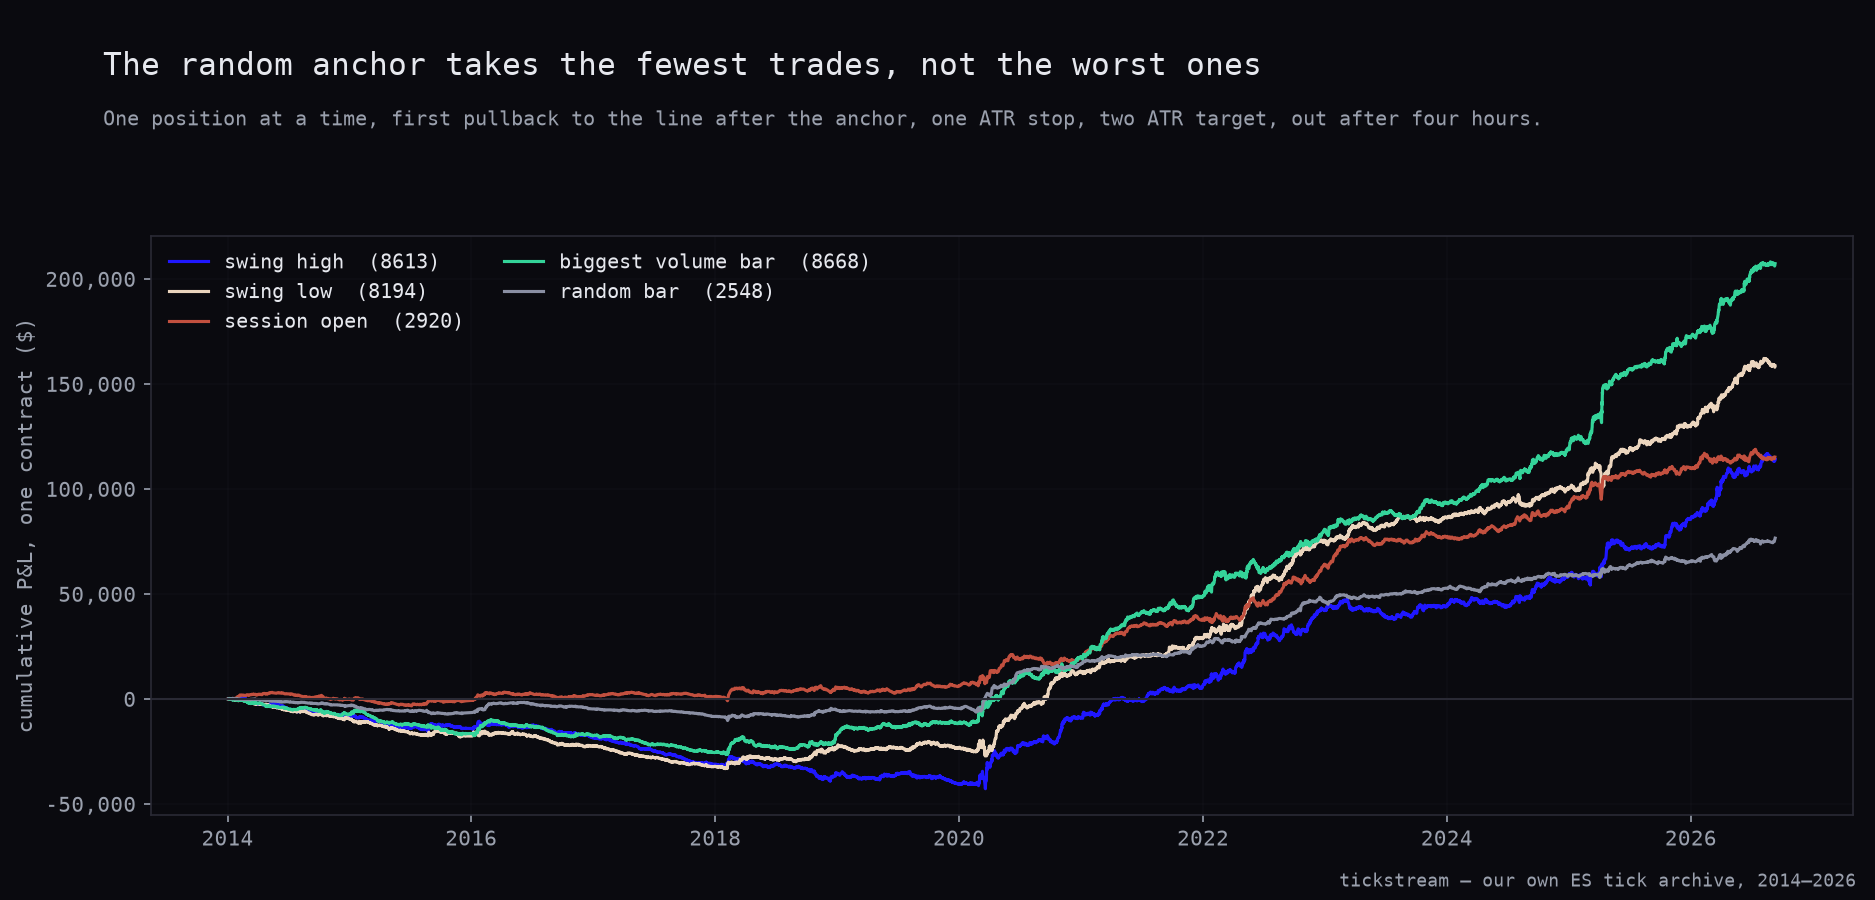
The same arithmetic runs the other way at the top of the chart. The biggest-volume-bar column leads on total dollars at $207,286.55 because it takes 8,668 trades, more than three times the random column’s count. Per trade the ordering is different, and the per-trade column is the one that answers the question.
Where ES and NQ disagree
Our NQ work on anchored VWAP is internal and unpublished, so there is no second verdict to link to, but it found something this run does not reproduce and it should be said plainly rather than smoothed over. On the Nasdaq, every configuration we tested lost its edge once its three best trades were removed. That is the signature of a result built on a handful of lucky moves.
On ES none of the five columns does that. Removing each column’s three best trades leaves:
| Full sample | Best 3 removed | |
|---|---|---|
| Swing high | +$13.25 | +$12.30 |
| Swing low | +$19.35 | +$18.63 |
| Session open | +$39.44 | +$36.28 |
| Biggest volume bar | +$23.91 | +$22.65 |
| Random bar | +$30.05 | +$27.80 |
Every column survives, and the ordering does not change. The ES version is not a three-trade mirage. It is a small, broad, real pullback effect with a decorative anchor bolted onto it.
Being accurate about that is more useful than pretending the two markets agreed. The NQ archive is seven years; the ES archive is twelve and a half. A result that lives on three trades in seven years is exactly the kind of thing a longer window is supposed to resolve, and here it resolved in the direction of the effect being real and the anchor being irrelevant.
What this means if you use the tool
The line is a reasonable pullback level. The ritual around choosing where to start it is worth nothing we can measure, and on this run it is worth −$6.06 a trade against picking a bar at random.
If you like anchored VWAP, anchor it wherever is convenient. The session open is the anchor we would use, at +$39.44 a trade, and our reason is that it is cheap to compute and stays near price, not that the open is a meaningful origin. Anchoring to last month’s swing high because it was a swing high buys you +$13.25 a trade, the worst column here.
This is the third VWAP-family result in the series to land the same way. The order-flow confirmation on VWAP bands made the fade worse in all four widths. Matteo Conti’s drift-VWAP pullback replicated and then stopped paying after 2023. Robert Rother’s first-touch VWAP scalp failed even when we cheated for it. In each case the VWAP was doing less work than the framework around it claimed.
What we changed in our own book
Nothing. We do not run an anchored-VWAP sleeve, and this result is not a reason to start one. A per-trade average of +$30.05 on a 46.9% win rate is a thin edge to build on once you add real slippage on a market stop, and the column that produced it is the control, not the strategy.
What it does change is how we read anchored-VWAP claims from other people. Any such claim now gets a random-anchor column beside it before we look at the equity curve. If the random anchor keeps up, the anchor was never the subject.
The ES tick archive this ran on, with the exchange’s own aggressor flag on every print back to 2014, is in our historical data packages.
Methodology: ES continuous front-month, 5-minute bars resampled from our own trade prints, 868,567 bars, 2 January 2014 to 10 September 2026. Anchors from a 60-bar centred window for the swing high, swing low and biggest-volume bar; the 09:30 ET bar for the session open; a fixed-seed random draw for the control. Running volume-weighted average built forward from the anchor on typical price, first touch taken after 20 bars and within 390 bars. Entry at the line, stop one ATR(14), target two ATR, timeout 48 bars. One position at a time, with a new anchor skipped while a trade is open. A bar holding both stop and target is resolved as the stop. One contract throughout, $4.50 commission plus two ticks of slippage per round trip, $29.50 on ES. Per-trade Sharpe and the t-statistic are computed on the closed-trade P&L series. The NQ comparison comes from our earlier anchored-VWAP study on the seven-year Nasdaq archive, which is internal and unpublished.
Frequently asked questions
Does anchored VWAP work on ES?
The line works. All five anchors we tested make money over 12.5 years and all five clear significance, from t = 4.53 on the swing high to t = 7.65 on the biggest-volume bar. What does not work is the anchor selection. A line started at a bar drawn at random pays +$30.05 a trade, more than the +$23.99 average of the four meaningful anchors.
Which anchor performed best?
The session open, at +$39.44 a trade across 2,920 trades. It is the only one of the four meaningful anchors that beats the random control at +$30.05. Our reading is that it wins because everybody watches it at the same moment and it resets daily, so the line stays near price. That is a liquidity story, not an anchor story.
What about the swing high and swing low anchors the literature recommends?
They are the two worst columns. The swing high pays +$13.25 a trade over 8,613 trades and the swing low +$19.35 over 8,194, against +$30.05 for the random bar. Both are still statistically positive, t = 4.53 and t = 6.46, but the theory behind them buys nothing measurable.
Is this another few-good-trades illusion like the NQ version?
No, and that is the difference between the two markets. On NQ, in an internal run we never published, every configuration lost its edge once its three best trades came out. On ES none does: removing each column's three best trades leaves +$12.30, +$18.63, +$36.28, +$22.65 and +$27.80 a trade against full-sample averages of +$13.25, +$19.35, +$39.44, +$23.91 and +$30.05.
Why does the test only hold one position at a time?
Because the first version of the same test on our NQ book did not, and ran up to twenty simultaneous positions at once. Nobody could have carried them, so the result it produced was never real. That run is internal and unpublished, and the constraint is written into this file instead: the biggest column here totals $207,286.55 on one contract at a time.