Absorption Carries Nothing on 247,090 S&P Bars
We graded absorption on twelve and a half years of ES five-minute bars using the exchange's own aggressor flag, splitting every bar into five strength buckets instead of a threshold. The most-absorbed fifth pays +0.0108 points against the pushing side over the next 30 minutes, at t = 0.23 and p = 0.8211. Effort correlates 0.4226 with the same bar's range and −0.0018 with what the next six bars do. Trading the strongest 5% of readings lost $164,275.39 fading the pusher and $142,213 following it, on 8,311 trades each.
The most-absorbed fifth of 247,090 five-minute S&P bars pays +0.0108 points against the side that was pushing, over the next 30 minutes, at t = 0.23. The bars are real absorption by any definition an order-flow chart uses: heavy one-sided aggressive volume, compressed range, delta pointing one way while price refuses to follow.
Absorption is the most photogenic idea in the order-flow family. Volume arrives, price stalls, someone large is soaking it up, and the turn follows. We tested it on twelve and a half years of ES from our own tick archive, where every print carries the exchange’s aggressor flag rather than a quote-rule guess. Our seven-year Nasdaq study already found the family coincident rather than predictive. The extra five years of S&P history reach the same place, and the one NQ survivor does not clear significance here either.
The rule
Two design choices come before the numbers, because they are what makes this a test rather than a screenshot.
Absorption is graded, not switched. For every five-minute bar we compute effort as the absolute signed delta, and result as the high-low range. Both are z-scored against their own trailing 240 bars. Absorption is effort minus result, so a bar with heavy delta and a small range scores high. Then we sort all 247,090 bars into five equal groups. A weak effect shows up as a gradient across the five. Nothing has to clear a threshold nobody agreed on.
The coincident reading is separated from the forward one. How well absorption describes the bar it lives in and how well it predicts the next bars are different measurements. Only the second is tradeable, and the two get reported in separate columns for the rest of this article.
The rest of the test:
- Bars are 5 minutes, regular session only, 09:30 to 15:55 New York.
- The pushing side is the sign of the bar’s delta. The claim under test is that price goes against it.
- The forward window is 30 minutes: from the next bar’s open to the close six bars later. Never the signal bar’s own close.
- The traded version takes the strongest 5% of absorption readings, enters at the signal bar’s close, stops one ATR away, targets two ATR, and exits at market after 24 bars. ATR is the mean range of the previous 14 bars.
- A bar containing both stop and target is scored as the stop.
- One contract, $4.50 commission plus two ticks per round trip. An ES tick is $12.50, so $29.50 comes out of every trade.
The gradient that goes nowhere
The five buckets sort exactly as they should. At the absorbed end, mean effort is +0.966 and mean result is −0.417: loud delta, quiet price. At the other end, effort is −0.246 and result is +1.262: price travelling on unremarkable flow. The classification is doing its job, which matters, because a null on a broken classifier says nothing.
| Absorption | Bars | Mean effort z | Mean result z | Next 30 min against pusher | t | p |
|---|---|---|---|---|---|---|
| Most absorbed | 49,418 | +0.966 | −0.417 | +0.0108 pts | +0.23 | 0.8211 |
| 4 | 49,418 | −0.109 | −0.561 | +0.0147 pts | +0.35 | 0.7266 |
| 3 | 49,418 | −0.279 | −0.330 | −0.0227 pts | −0.53 | 0.5928 |
| 2 | 49,418 | −0.321 | +0.079 | +0.0858 pts | +1.77 | 0.0773 |
| Least absorbed | 49,418 | −0.246 | +1.262 | +0.0670 pts | +1.15 | 0.2485 |
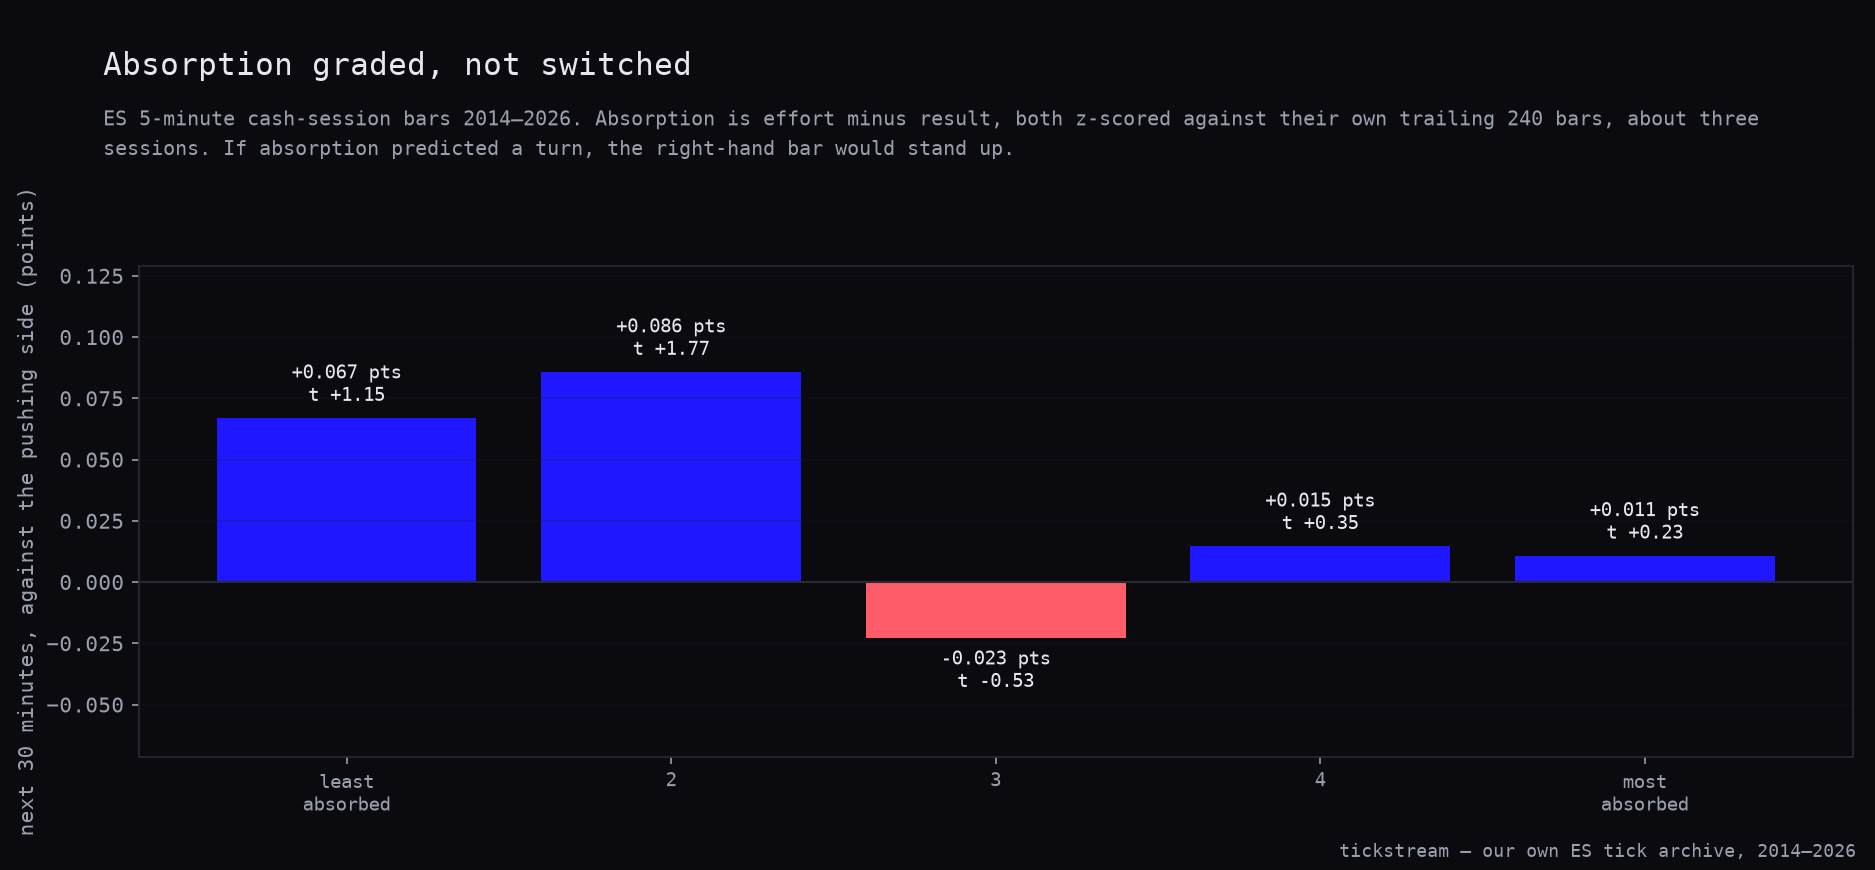
Nearly 50,000 bars per bucket and the largest payoff is under a tenth of a point. There is no monotone step from one end to the other, and the biggest t in the table, +1.77, sits in the second quintile — a bucket with below-average effort and roughly average range. If absorption worked, the top row would carry the effect. It carries +0.0108 points and p = 0.8211.
The chart below is the fifth column drawn as bars. If absorption predicted a turn, the most-absorbed column on the left would stand up. All five sit inside a tenth of a point of zero, and one of them points the wrong way.
The column that gets quoted and the column you can trade
Four correlations, all on the same 247,090 bars, settle the question faster than any equity curve.
| Measurement | r | p |
|---|---|---|
| Effort against the same bar’s range | +0.4226 | 0.0 |
| Delta against the same bar’s return | +0.1807 | 0.0 |
| Delta against the next bar’s return | −0.0007 | 0.7276 |
| Absorption against the next six bars, against the pushing side | −0.0018 | 0.3582 |
The first two are what an order-flow chart shows you. They are large, they are significant to the limit of the arithmetic, and they are descriptions of the bar you are already inside. Heavy aggressive volume comes with a wide range. Buy-side delta comes with an up-close. Neither fact needed measuring.
The second two are the only ones you could trade, and they are zero to four decimal places. Shift the same signal forward by one bar and +0.1807 becomes −0.0007. Extend the horizon to half an hour and absorption’s link to the reversal it is supposed to announce is −0.0018 with p = 0.3582. That gap between the coincident columns and the forward ones is the entire order-flow direction business, and this is the third market-and-signal pair in this series where it opens the same way.
Trading the strongest 5%, both ways
A correlation of −0.0018 is not a strategy, so we built the version a trader would run. We took the top 5% of absorption readings and traded them in both directions, each as its own trade with its own bracket and its own costs.
| Fade the pusher | Follow the pusher | |
|---|---|---|
| Trades | 8,311 | 8,311 |
| Win rate | 35.9% | 35.2% |
| Average per trade | −$19.77 | −$17.11 |
| Median | −$110.75 | −$112.54 |
| Total, one contract | −$164,275.39 | −$142,212.89 |
| Profit factor | 0.867 | 0.884 |
| Max drawdown | $167,469.71 | $170,191.57 |
| Sharpe | −1.38 | −1.18 |
| t | −4.90 | −4.22 |
| Stop / target / timeout | 5,225 / 2,798 / 288 | 5,287 / 2,748 / 276 |
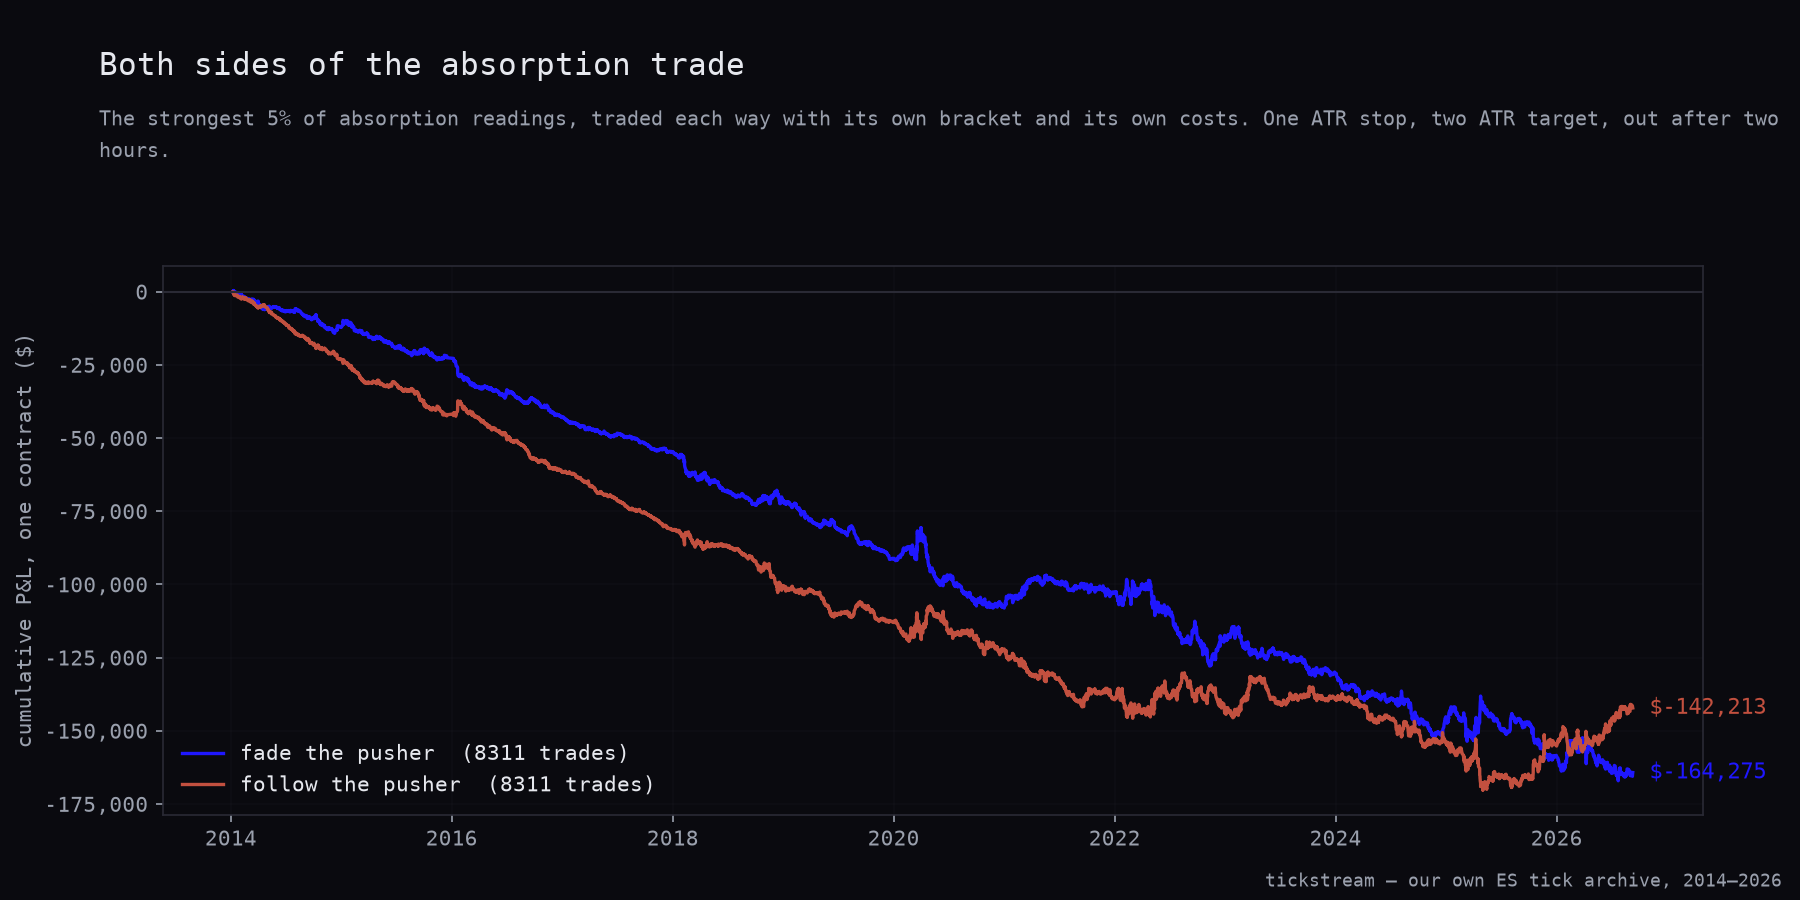
Both directions lose, on the same signal, over the same 8,311 entries. That is the signature of a signal with no information in it paying costs at both ends. The exit splits say the same thing from another angle: the fade stops out 5,225 times and reaches target 2,798 times, the follow 5,287 and 2,748. Those two ratios are close enough to be the same trade wearing opposite signs, which is what a one-ATR stop against a two-ATR target produces when the entry direction is uninformative.
The two arms are simulated separately rather than one being the negation of the other. Negating a P&L series turns the $29.50 round trip into $29.50 of profit per trade, and it silently mirrors the bracket as well — a one-ATR stop with a two-ATR target becomes its opposite. We got that wrong in an earlier test in this series and now simulate every fade as its own trade.
Below, both arms plotted from 2014. Neither has a regime where it works and the other does not; they descend together.
The one thing that survived on NQ
Our Nasdaq work concluded that the only useful residue of this family was location: high-volume prices act as magnets, which is worth something for placing a target and nothing for choosing a side. That is a specific, testable claim, so we ran it on ES.
For each session we take the midpoint of the previous session’s heaviest five-minute bar and ask whether the new session reaches it. The control is an equally distant price on the other side of the open — same distance, mirrored, so distance cannot explain a difference.
| Reached | Sessions | Median distance | |
|---|---|---|---|
| Heaviest-bar midpoint | 52.2% | 2,470 | 11.50 pts |
| Mirrored price | 50.2% | 2,470 | 11.50 pts |
The edge is +2.0 percentage points, with t = 1.42 and p = 0.1547. We are calling that unconfirmed on the S&P rather than a confirmation or a kill. The sign points the same way as the NQ result, which is worth noting. It also does not clear significance on 2,470 sessions, and two percentage points at a median distance of 11.50 points would not change where anyone puts a target.
Why we trust a null here
The delta in every bar above is the exchange’s own aggressor flag, pulled from our tick archive. It is not a quote-rule reconstruction that guesses which side crossed the spread by comparing each print to the prevailing bid and ask.
That distinction is the whole reason to publish this. When a reconstructed-flow study finds nothing, the fair objection is that the data is blurry and the signal was smeared out before the test began. That objection does not apply here. The sides are recorded. A null on recorded sides is an answer about the flow, not about the measurement.
What we changed
Nothing. We already use order flow for execution rather than direction, and this is the second index where the directional version came back empty. The same conclusion arrived from a different angle in our VWAP band confirmation test, where the cumulative-delta filter made the trade worse in all four bands, and in our large-print study, where whale flow correlated with the bar it was in and not the one after.
The archive this ran on is for sale: ES ticks back to 2014 with the exchange’s aggressor side on every print, in the historical data packages.
Methodology: ES five-minute bars built from our own tick archive, 7 January 2014 to 10 September 2026, regular session 09:30–15:55 New York, 247,090 bars. Effort is absolute signed delta, result is the bar’s high-low range, both z-scored against their own trailing 240 bars; absorption is effort minus result, and the pushing side is the sign of the bar’s delta. The forward window runs from the next bar’s open to the close six bars later. The traded test uses the top 5% of absorption readings, entered at the signal bar’s close, with a one-ATR stop against a two-ATR target over a 14-bar ATR and a 24-bar timeout; a bar containing both levels is scored as the stop, and each direction is simulated as its own trade rather than the negation of the other. One contract, $4.50 commission plus two ticks per round trip, $29.50 total.
Frequently asked questions
Does absorption predict a reversal on S&P 500 futures?
Not in our test. The most-absorbed fifth of 247,090 five-minute ES bars pays +0.0108 points against the pushing side over the following 30 minutes, with t = 0.23 and p = 0.8211. The largest t in the whole five-bucket table is +1.77, and it sits in the second quintile, which is not where the theory puts it.
Why grade absorption instead of using a threshold?
Because a threshold nobody agreed on can hide a weak effect or manufacture one. Splitting the bars into five equal groups of 49,418 lets a real effect appear as a gradient. The buckets separate cleanly on their inputs — effort +0.966 and result −0.417 at one end, effort −0.246 and result +1.262 at the other — so the classification works even though the forecast does not.
Is order flow correlated with price at all?
Yes, but only inside the bar you are already in. Signed delta correlates +0.1807 with the same bar's close-minus-open and effort correlates +0.4226 with the same bar's range, both with p rounding to zero. Delta against the next bar's move is −0.0007 with p = 0.7276.
What happened when you traded the strongest absorption readings?
Both directions lost. Fading the pusher produced 8,311 trades at −$19.77 each for −$164,275.39, profit factor 0.867. Following the pusher lost $17.11 a trade for −$142,212.89, profit factor 0.884. Two losing sides on one signal is what no information plus $29.50 of round-trip costs looks like.
Do high-volume prices still act as magnets on ES?
Unconfirmed here. The midpoint of the prior session's heaviest five-minute bar is reached by the next session 52.2% of the time against 50.2% for an equally distant price on the other side of the open, on 2,470 sessions. The 2.0-point edge points the same way as our Nasdaq finding but carries t = 1.42 and p = 0.1547.