Is Volume Really the Most Underrated Indicator? We Tested Volume Breakouts on 7 Years of NQ
‘Volume shows conviction.’ ‘A strong-volume breakout confirms the move.’ It's one of the most popular ideas in trading. We tested it properly on 7 years of NQ 1-minute data — 129,959 breakouts, placebo-controlled, on real trade volume. Volume is genuinely useful for one thing and useless for another, and most people have those two backwards.
A popular post making the rounds calls volume “the most underrated indicator — even ICT should use it.” The argument is the classic one: volume shows conviction, a strong-volume breakout confirms the move, a weak-volume one means wait. It’s intuitive, it’s everywhere, and it’s worth testing properly. So we did — on 7 years of NQ 1-minute data, 119,447 breakouts, placebo-controlled.
The honest result: volume is genuinely useful for one job and useless for another — and most people have the two backwards.
The claim, and the test
The specific, testable version of “volume confirms breakouts”: when price breaks the prior 20-bar high on high volume, it should continue; on low volume, it should fail. So we found every breakout (close above the prior 20-bar high), measured the volume of the breakout bar relative to its recent average — real contracts traded, not quote noise — and looked at what price did over the next 20 minutes, across 7 years.
What the data says
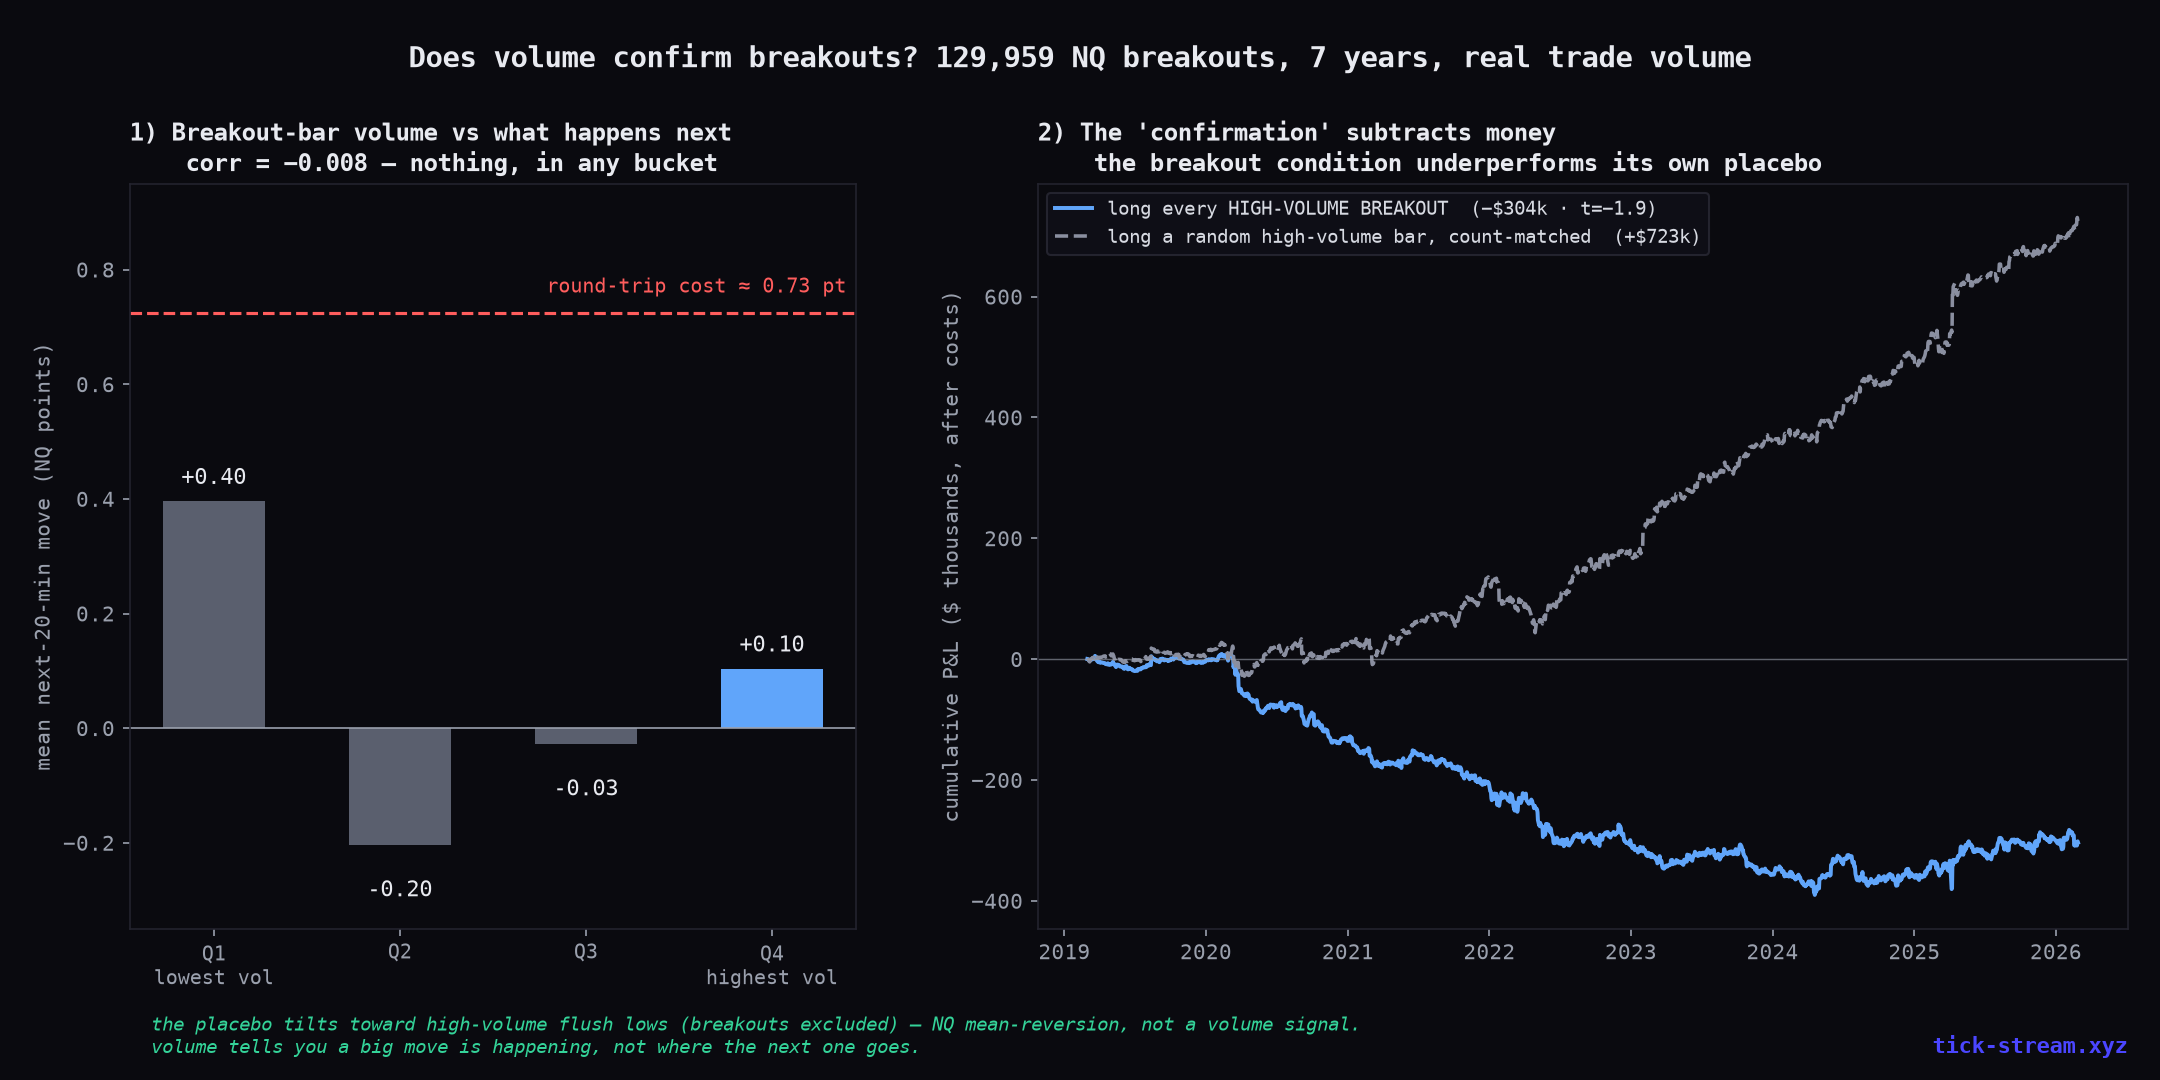
The breakout bar’s volume does not predict the next move. Its correlation with the next 20 minutes of price is −0.008 — statistically zero (left panel). There isn’t even a consistent tilt across buckets: the lowest-volume breakouts drifted up the most (+0.4 points, still under the ~0.7 points you need just to cover costs) and the highest-volume ones managed +0.1. No bucket clears break-even. There is no version of ‘strong volume ⇒ continuation’ in this data.
And the ‘confirmation’ subtracts money. The right panel is the killer. We traded the high-volume breakout long — and compared it to entering long on a random high-volume bar that wasn’t a breakout at all, count-matched, same period. The breakout version lost $304k; the placebo made +$723k. That’s not because ‘any big candle is a buy’ — excluding breakouts tilts the placebo toward high-volume flush lows, and NQ mean-reverts off those (the same short-horizon reversion behind our RSI-2 dip-buying result). The honest reading: volume selects big moves; conditioning on a fresh high on top of it made the trade worse, not better.
Why the gap exists
Volume is coincident, not predictive — exactly like order flow. A big move and big volume print at the same time by construction: volume is literally how the move happened. So “volume shows conviction” is true about the candle that just printed — and says nothing about the next one. On a marked-up chart the big volume bar sits right under the breakout candle and looks like confirmation, but that’s an identity, not a forecast.
This is the same lesson as cumulative volume delta, footprint and order-flow indicators: the information is real and describes the present, but the tradeable edge isn’t in using it to predict the future.
The honest part: where volume actually helps
Here’s where the original post is right, and we want to be fair about it. Volume is valuable — for the job it’s quietly good at:
- Context and acceptance. How much actually traded at a level, whether a move was participated in or thin, where activity clustered. That genuinely helps you read the tape and understand what happened.
- Execution. Knowing where liquidity is, judging whether a level is being absorbed.
What it does not do is confirm a breakout into a tradeable entry or predict the next move. Those are the uses being sold, and those are the ones that failed every test — after costs, against a placebo, over 7 years.
So the post has it half right and half backwards: volume is a great context tool (it really does tell you conviction behind the current move) and a poor confirmation/entry signal (it doesn’t predict the next one). Use it to understand the market, not to time it.
Follow-up: the weak-volume fade (a reader’s counter — and a liquidity mirage)
After we published this, a reader flipped the claim: don’t trade the strong-volume breakout — fade the weak-volume one. If a breakout happens on unusually thin volume, it’s “unsupported” and should revert. The first version of this article reported that this “works spectacularly” overnight (Sharpe ~3.8) and called it a liquidity mirage. The truth turned out to be even less flattering — and it’s a lesson about measuring volume itself.
Our original volume series was built from a mis-read field in our raw tape: it counted bid/ask quote updates, not contracts traded. “Thin volume” therefore flagged minutes of quiet quoting, not quiet trading — and the apparent overnight reversion was bid-ask bounce around those stale-quote minutes. Rebuilt on real trade volume, the whole thing inverts:
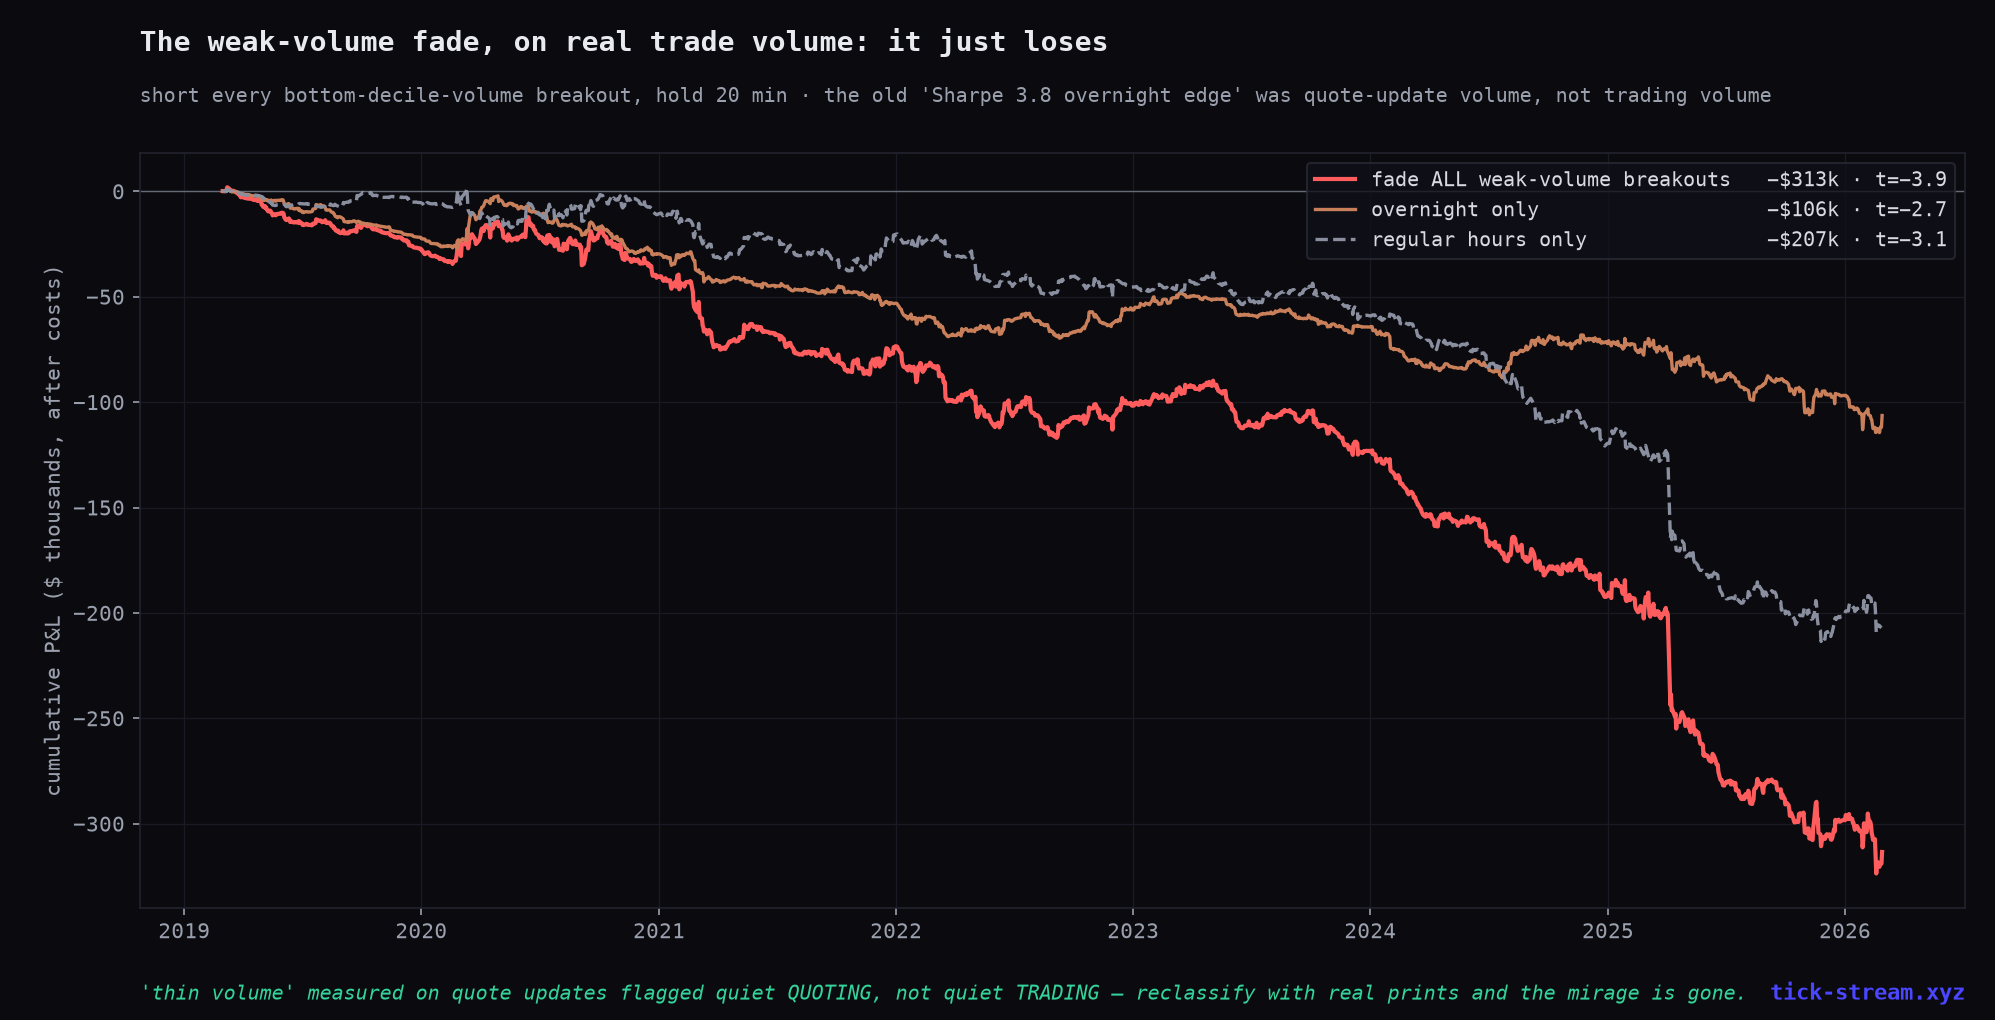
Fading the bottom-decile-volume breakouts loses $313k over 7 years (t = −3.9) — and it loses in both sessions: −$106k overnight, −$207k in regular hours. There is no hidden edge and no mirage to explain anymore; the signal was an artifact of counting the wrong thing. Weak-volume breakouts do not revert more than strong ones once volume means what traders think it means.
The meta-lesson survives, sharpened: before you backtest a volume signal, check what your data vendor’s “volume” field actually counts. Ours silently included quote traffic — and it manufactured a Sharpe 3.8 strategy out of thin air.
The bottom line
On 7 years of NQ: the volume of a breakout bar has a −0.008 correlation with what happens next, never clears costs in any volume bucket, and a high-volume breakout underperforms a random high-volume bar. Volume shows conviction about the move that already happened — that’s real and useful as context. It does not confirm or predict the next move, which is exactly what it’s most often sold as. If someone tells you a strong-volume breakout is your entry signal, ask to see it beat a random high-volume bar, out-of-sample, after costs.
Methodology: NQ continuous front-month, 1-minute bars 2019–2026 built from real trade prints (volume = contracts traded). Breakout = close above the prior 20-bar high (lookahead-free, per session). Breakout-bar volume measured vs the prior 20-bar average. Forward move over 20 bars; continuation correlation and per-volume-quartile means computed across all 129,959 breakouts. Tradeable test: long the breakout, hold 20 minutes, $4.50 commission + 2-tick slippage, daily-aggregated significance, with a count-matched random-high-volume placebo.
Correction note (2026-07-03): the first version of this study measured “volume” from a mis-read field in our raw tape that counted bid/ask quote updates instead of contracts traded. We rebuilt every bar from real trade prints and re-ran everything. The headline conclusion (volume does not confirm breakouts) stands; the numbers on this page are the corrected ones, and the “weak-volume fade overnight mirage” section changed the most — on real volume that fade simply loses everywhere.
Frequently asked questions
Does volume confirm breakouts?
Not in any predictive, tradeable way. We tested 129,959 breakouts on 7 years of NQ 1-minute data with real trade volume: the breakout bar's volume has a correlation of −0.008 with the next 20 minutes of price — essentially zero, with no clean tilt across volume buckets (the best bucket averaged +0.4 points forward, under the ~0.7 points you need just to cover costs). And a high-volume breakout didn't just match a random high-volume bar — it did worse: the breakout version lost money while the count-matched placebo drifted up.
Does volume show conviction?
It shows conviction about the move that just happened — not the next one. Volume is coincident: a big move and big volume print together, by definition, because volume is how the move happened. That makes volume genuinely useful for reading what occurred (acceptance, participation, how much changed hands) but it does not forecast continuation. In our tests, conditioning a breakout entry on high volume did not beat a random high-volume bar.
So is the volume indicator useless?
No — but its useful job and its useless job are the opposite of how it's usually sold. Volume is real, valuable context: it tells you how much actually traded, whether a level was accepted or rejected, where participation clustered. That helps you understand the tape. What it does not do is predict the next move or 'confirm' a breakout into a tradeable edge — that part failed every test we ran, after costs and against a placebo.
Should I trade breakouts on high volume?
On NQ, going long the high-volume breakout and holding lost $304k over 7 years after costs — while a count-matched random high-volume bar made money (high-volume minutes that aren't fresh highs are often flush lows, and NQ mean-reverts off those). The 'confirmation' condition actively subtracted from the placebo. Volume doesn't rescue a breakout entry. If anything the breakout-and-let-it-run edge is thin and lives in trend-following mechanics, not in the volume of the breakout candle.
Why does volume look so predictive on a chart?
Because you read it after the fact. On a marked-up chart, the big green volume bar sits right under the candle that broke out — so it looks like the volume 'caused' or 'confirmed' the move. But that's an identity, not a prediction: the volume is the move. The honest test is whether the volume on the breakout bar tells you what happens next, on data you haven't seen — and it doesn't (correlation −0.008).