Large S&P Prints Follow the Move Instead of Leading It
Signed large-trade volume correlates +0.035 with the move in the bar that contains it and −0.004 with the next bar's move, measured on 510,205 five-minute ES bars. Trading the imbalance lost $967,668.70 on one contract across 32,296 trades, and fading the same signal lost $863,647.71. Whale flow agrees with the direction of a range breakout 55.3% of the time, but where the base closed in its own range agrees 94.3% of the time — and once that is removed, the flow's partial correlation with breakout direction is −0.008.
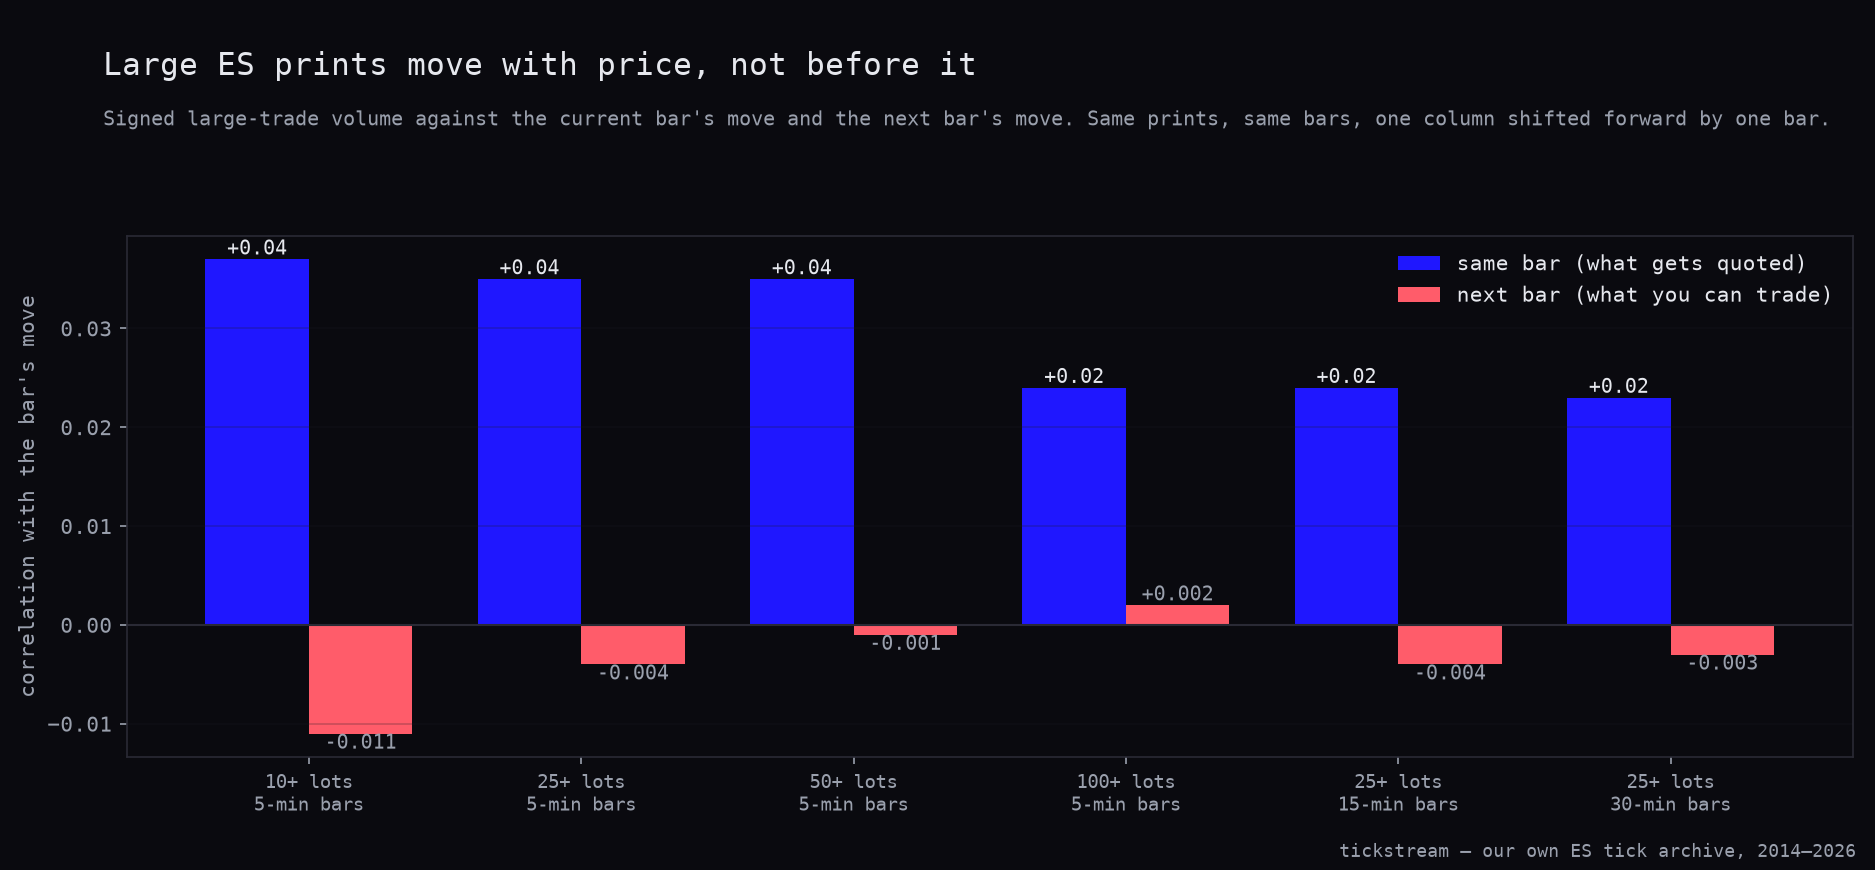
Signed large-trade volume correlates +0.035 with the move inside the bar that contains it, and −0.004 with the move in the bar after. That gap is the entire order-flow direction business, and it is visible on 510,205 five-minute ES bars.
We ran the whale-print premise on twelve and a half years of S&P futures from our own tick archive, where every trade carries the exchange’s aggressor flag instead of a reconstructed one. Following the imbalance lost $967,668.70 on one contract. Fading the same signal lost $863,647.71. Our seven-year Nasdaq version reached the same verdict; the extra five years here do not soften it, and the losing equity curve runs unbroken from 2014.
The rules
Three separate tests, all on ES bars built from the same tick archive.
1. The separation. For each bar, sum the size of every print of N lots or more, signed by the recorded aggressor side, and divide by the large-print volume in that bar. Correlate that imbalance with the bar’s own close-minus-open, and with the next bar’s close-minus-open. N is 10, 25, 50 and 100; bars are 5, 15 and 30 minutes.
2. The trade. Take the 25-lot imbalance on five-minute bars, regular session only. Convert it to a z-score against the trailing 288 bars of the same signal. When the reading exceeds 1.5, 2.0 or 2.5 standard deviations, enter in the direction of the imbalance at the next bar’s open, never on the signal bar. Stop one ATR away, target two ATR, exit at market after twelve bars. ATR is the mean high-low range of the previous 20 bars. A bar containing both stop and target is scored as the stop.
3. The breakout. Mark a 12-bar base as tight when its range is under three times the average bar range of the prior 60 bars. A breakout is the first bar trading above that base’s high or below its low. Ask whether the 25-lot imbalance accumulated over the twelve base bars points the same way the breakout went.
One contract throughout, $4.50 commission plus two ticks per round trip. An ES tick is $12.50, so $29.50 comes out of every trade.
The column that gets quoted and the column you can trade
Every vendor screenshot of institutional flow is a picture of the first column below. Prints line up with the move, the chart looks convincing, and the correlation is genuinely there — it is significant at p = 0 on hundreds of thousands of bars. It is also a description of the bar you are already inside. Shift it forward by exactly one bar and it is gone.
| Print size | Bar | Bars | Same-bar r | Next-bar r | Next-bar p |
|---|---|---|---|---|---|
| 10+ lots | 5 min | 739,375 | +0.037 | −0.011 | 0.0 |
| 10+ lots | 15 min | 277,689 | +0.023 | −0.006 | 0.0031 |
| 10+ lots | 30 min | 144,142 | +0.019 | −0.004 | 0.148 |
| 25+ lots | 5 min | 510,205 | +0.035 | −0.004 | 0.0046 |
| 25+ lots | 15 min | 221,056 | +0.024 | −0.004 | 0.0697 |
| 25+ lots | 30 min | 125,778 | +0.023 | −0.003 | 0.3354 |
| 50+ lots | 5 min | 324,563 | +0.035 | −0.001 | 0.6681 |
| 50+ lots | 15 min | 157,461 | +0.031 | −0.003 | 0.1669 |
| 50+ lots | 30 min | 96,228 | +0.029 | −0.004 | 0.2366 |
| 100+ lots | 5 min | 161,837 | +0.024 | +0.002 | 0.5401 |
| 100+ lots | 15 min | 90,731 | +0.025 | −0.004 | 0.2156 |
| 100+ lots | 30 min | 60,663 | +0.025 | +0.007 | 0.0681 |
Every same-bar correlation carries p = 0.0. Every next-bar correlation sits between −0.011 and +0.007, and two of the twelve flip positive. The sign is not stable across cells that differ only by bar length, which is what an empty measurement looks like when you print it twelve times.
The detail worth pausing on is the bottom of the table. The whole premise is that a 100-lot is a different animal from a 10-lot, and at 100 lots and up the next-bar correlation is +0.002 on five-minute bars, with p = 0.5401. Size buys rarity, not foresight.
Six of those cells are plotted below, same-bar bar against next-bar bar. The blue column is what gets sold. The red one is what you can act on.
Trading it, at three levels of conviction
A correlation of −0.004 is not a strategy, so we built the version a trader would actually run. Normalising the 25-lot imbalance against its own recent history gave us 219,407 usable signal bars, and we took every reading beyond 1.5, 2.0 and 2.5 sigma.
| Follow the prints | 1.5σ | 2.0σ | 2.5σ |
|---|---|---|---|
| Trades | 32,296 | 7,248 | 1,761 |
| Win rate | 34.6% | 33.2% | 31.8% |
| Average per trade | −$29.96 | −$34.12 | −$35.09 |
| Median | −$103.25 | −$84.50 | −$75.75 |
| Total, one contract | −$967,668.70 | −$247,281.00 | −$61,800.75 |
| Profit factor | 0.787 | 0.679 | 0.584 |
| Sharpe | −4.46 | −3.09 | −2.07 |
| t | −15.88 | −11.03 | −7.37 |
| Stop / target / timeout | 19,358 / 8,428 / 4,510 | 4,359 / 1,794 / 1,095 | 1,086 / 426 / 249 |
The per-trade loss gets worse as the signal gets louder: −$29.96, then −$34.12, then −$35.09. Profit factor falls the same way, from 0.787 to 0.584. If the imbalance carried any direction, filtering harder would recover some of it. Here filtering harder concentrates the same nothing into fewer, more expensive trades.
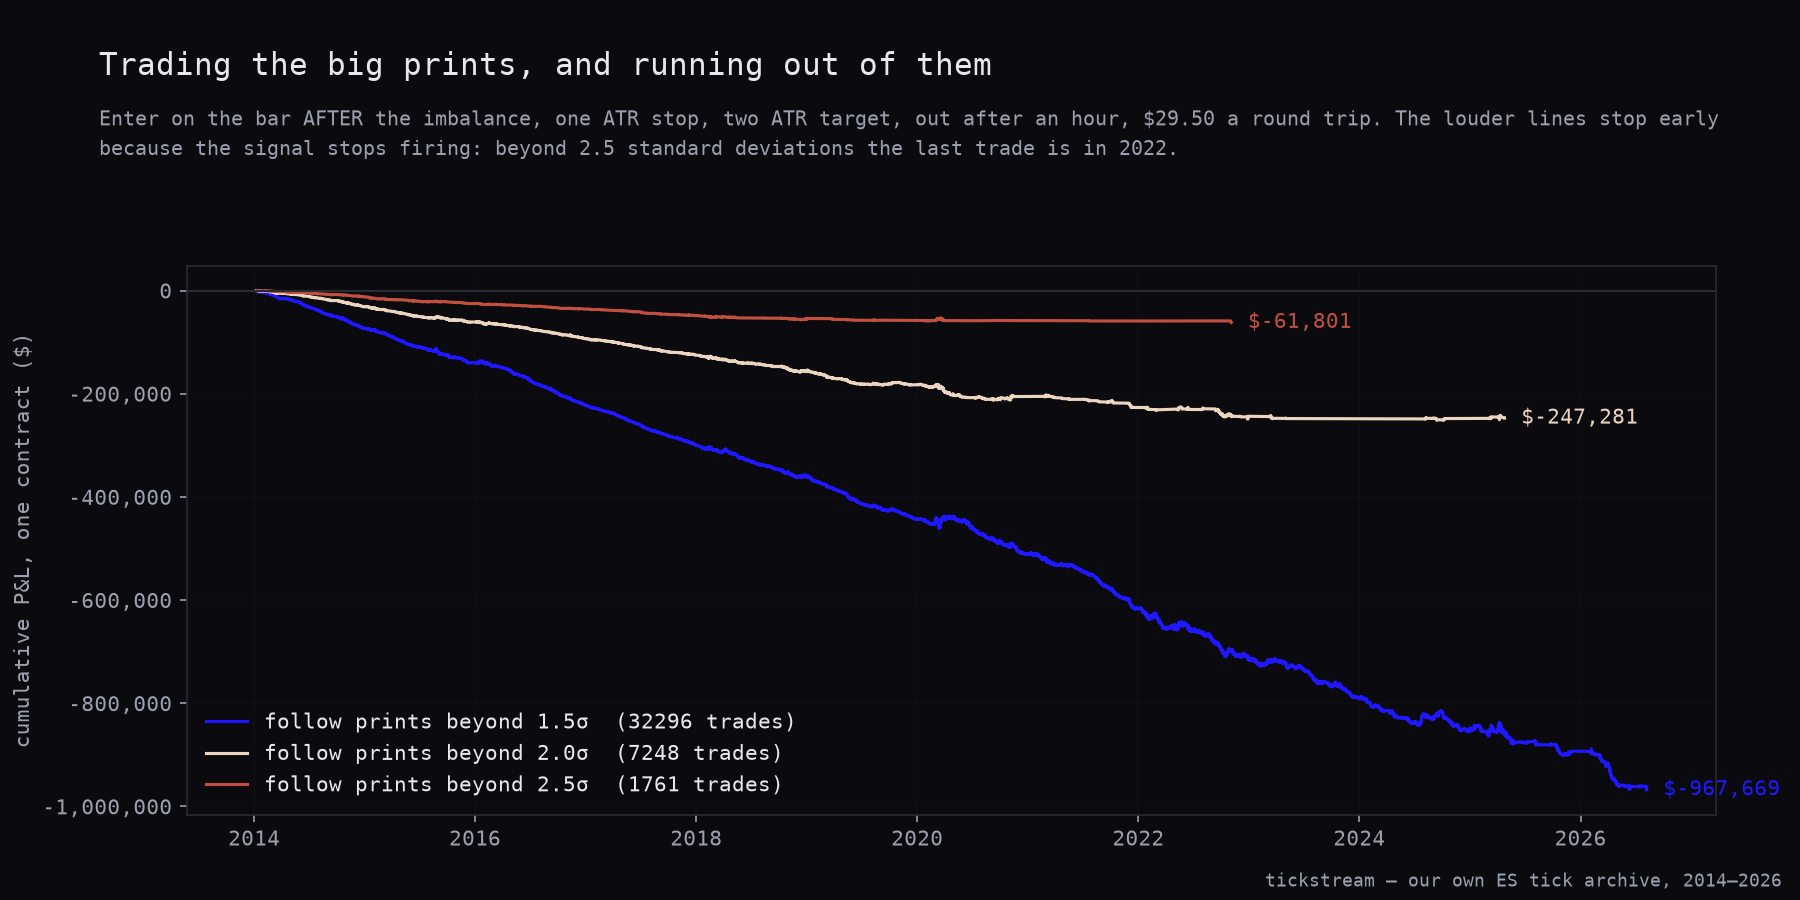
The three curves start losing immediately and keep losing. Two of them also stop early, and that is not a plotting fault. The 2.0σ and 2.5σ lines end where their signal stops firing, which is the subject of the next section. Up to that point neither slope is any kinder than the 1.5σ one.
The loudest signal ran out
The 2.5σ arm has no trades after 3 November 2022. The 2.0σ arm has none after 24 April 2025. Only the 1.5σ threshold still fires, most recently on 7 August 2026. The strategy did not stop being taken because we stopped taking it. The tape stopped producing readings that far into the tail.
| Year | Signals at 1.5σ | at 2.0σ | at 2.5σ |
|---|---|---|---|
| 2014 | 2,307 | 972 | 326 |
| 2015 | 2,216 | 924 | 352 |
| 2016 | 2,470 | 1,000 | 335 |
| 2017 | 2,397 | 1,025 | 384 |
| 2018 | 2,560 | 945 | 212 |
| 2019 | 2,709 | 897 | 59 |
| 2020 | 2,955 | 762 | 72 |
| 2021 | 3,295 | 255 | 6 |
| 2022 | 3,237 | 358 | 15 |
| 2023 | 3,250 | 39 | — |
| 2024 | 2,741 | 37 | — |
| 2025 | 1,489 | 34 | — |
| 2026 | 670 | — | — |
The 2.5σ count falls from 326 in its first year to 6 in 2021 and 15 in 2022, then nothing. The 2.0σ count holds near a thousand a year through 2020 and then drops to double digits from 2023 on. The 1.5σ column is the only one still populated at the end of the archive.
Our reading, and we label it a reading rather than something we measured. The z-score is taken against the signal’s own trailing distribution, so it moves with the tape rather than against a fixed bar. As large prints became routine, the imbalance’s own recent spread widened, and a given lopsided bar stopped scoring as extreme. The far tails emptied out. We did not test that mechanism here, and this article cannot separate it from any other explanation for the same counts.
What the counts do settle is a reading of the equity chart. The louder lines are truncated, not thinner. Their samples are 7,248 and 1,761 trades because the threshold stopped triggering, not because the plot thinned them out.
The fade loses too, and how we nearly got that wrong
If following the whales loses, the obvious next question is whether the crowd is the fade. It is not.
| Fade the prints | 1.5σ | 2.0σ | 2.5σ |
|---|---|---|---|
| Trades | 32,296 | 7,248 | 1,761 |
| Win rate | 35.5% | 34.3% | 35.1% |
| Average per trade | −$26.74 | −$28.06 | −$22.93 |
| Total, one contract | −$863,647.71 | −$203,371.63 | −$40,378.25 |
| Profit factor | 0.807 | 0.729 | 0.707 |
| Sharpe | −3.99 | −2.48 | −1.26 |
| t | −14.23 | −8.83 | −4.48 |
Both directions losing is the signature of a signal with no information in it, paying costs on the way in and out. It is worth saying plainly, because a strategy that loses is often read as an inverted strategy that wins, and that reading requires the losses to come from the direction rather than from the friction.
We had to fix this in our own draft. The first run scored the fade by negating the follow P&L, which is wrong twice over. It turns the $29.50 of round-trip costs into $29.50 of profit per trade, because costs do not change sign when the position does. And it silently swaps the bracket: a one-ATR stop with a two-ATR target becomes a two-ATR stop with a one-ATR target, a completely different risk shape that we never intended to test. Negated, the fade looked like a large winner. Simulated properly, as its own trade with its own bracket and its own costs, it loses like everything else. The table above is the honest version.
The breakout question, and the control that answers it
The most common practical use of large-print flow is calling the direction of a range breakout. So we asked it directly, on 41,296 tight-base breakouts.
| Agrees with breakout | 95% CI | Correlation with direction | |
|---|---|---|---|
| Whale imbalance over the base | 55.3% | 54.9 – 55.8 | 0.094 |
| Where the base closed in its range | 94.3% | 94.1 – 94.5 | 0.89 |
On its own, 55.3% with p rounding to zero on 41,296 observations reads like a finding. Then look at the control. Simply noting where the previous close sat between the base’s high and low agrees with the breakout direction 94.3% of the time.
That 94.3% is close to mechanical, and that is exactly the point. A base that closes near its high breaks upward because the high is closer, not because anything was predicted. It is not a strategy, it is geometry. And any quantity measured over the same twelve bars inherits that drift — the whale imbalance correlates 0.109 with the price position, so part of its 55.3% is the same geometry wearing an order-flow label.
Removing the price position from both sides settles it. The partial correlation between whale imbalance and breakout direction, given where the base closed, is −0.0082 with p = 0.0969. The sign is negative, the magnitude is a hundredth of the control’s 0.89, and it does not reach significance on 41,296 breakouts.
Why we trust a null here
We have killed the order-flow direction family several times now, and the reason the answer keeps coming back clean rather than ambiguous is that the aggressor side is recorded rather than guessed. Most retail delta is reconstructed by comparing each trade to the prevailing quote, because the underlying data has no side column. When we tested that reconstruction against our archive on Nasdaq futures, the replay bins correlated 0.03 with the true aggressor while our store correlated 1.000. A null measured on 0.03-quality sides means the data was blurry. A null measured on the exchange’s own flag means the flow is empty.
What we changed
Nothing in the live book — we have never run a large-print direction sleeve, and this is now the second market where the family fails end to end.
Two things did change. The fade in every bracketed test in this series is simulated as its own trade from now on. Negating a P&L series is banned. It flips costs into profit and mirrors the bracket at the same time. And any agreement statistic on breakout direction ships with the price-position control next to it, because 94.3% of it is available for free.
The archive this ran on is for sale: ES ticks back to 2014 with the exchange’s aggressor side on every print, in the historical data packages.
Methodology: ES bars built from our own tick archive, 2 January 2014 to 10 September 2026. Large prints are single trades of 10, 25, 50 or 100 lots and up, signed by the recorded aggressor flag, aggregated into 5-, 15- and 30-minute bars; the imbalance is signed large-trade volume over total large-trade volume. The traded tests use 25-lot imbalance on five-minute regular-session bars, z-scored over the trailing 288 signal bars. Entry is at the next bar’s open. The bracket is a one-ATR stop against a two-ATR target with a twelve-bar timeout, and the stop resolves before the target when a bar contains both. Breakouts are 12-bar bases narrower than three times the prior 60-bar average range, measured 09:30–15:55 New York. One contract, $4.50 commission plus two ticks per round trip, $29.50 total.
Frequently asked questions
Do large trades predict the next move on S&P futures?
No. Across twelve print-size and bar-size combinations, the correlation between signed large-trade volume and the next bar's move ranges from −0.011 to +0.007. The same-bar correlation for those prints runs +0.019 to +0.037 with p at zero, which is the number order-flow tools put on screen.
Do bigger prints carry more information than smaller ones?
They do not. At 100 lots and up on five-minute bars the next-bar correlation is +0.002 with p = 0.5401, no better than the 10-lot version's −0.011. Size changes how rare the signal is, not how much it knows: the 100-lot 30-minute sample is 60,663 bars against 144,142 for 10 lots.
What happens if you actually trade the whale imbalance?
It loses at every threshold we tested. Following a 1.5-sigma imbalance produced 32,296 trades at −$29.96 each, and raising the bar to 2.5 sigma made each trade worse, at −$35.09 over 1,761 trades. Fading it loses too, −$26.74 a trade at 1.5 sigma, which is what no information plus $29.50 of costs looks like from both sides.
Does order flow tell you which way a range breakout will go?
Not once you control for the obvious. Whale imbalance over the twelve bars before a breakout agrees with the direction 55.3% of the time on 41,296 breakouts, while simply asking where the base closed in its own range agrees 94.3% of the time. Removing the price-position effect from both sides leaves the flow with a partial correlation of −0.008 and p = 0.0969.
Why should this test be more reliable than the usual order-flow study?
Because the aggressor side is recorded, not inferred. Every print in the 2014-2026 ES archive carries the exchange's own flag; when we checked reconstructed data against it on Nasdaq futures, the reconstructed bins correlated 0.03 with the true aggressor while our store correlated 1.000. A null result on guessed sides is ambiguous, a null result on 739,375 bars of recorded sides is an answer.