The Opening-Range Breakout That Survived on the Nasdaq Loses Money on the S&P
ORB30 long-only was the one variant that lived through our Nasdaq audit at Sharpe 1.60 and t = +3.6. On 3,098 regular sessions of S&P futures it loses $28.53 a trade across 1,658 trades, 42.8% wins, −$47,311 on one contract. Seven of the eight variants we ran lose money net of costs, and the eighth — the short side, +$4,912.50 — clears them by $3.45 a trade at p = 0.9159. The train decade loses $20.75 a trade and the 2024–2026 holdout loses $56.00.
The one opening-range variant that survived our Nasdaq audit does not survive on the S&P. ORB30 long-only loses $28.53 a trade on ES, across 1,658 trades and 3,098 regular sessions. The win rate is 42.8% and the run ends at −$47,311 on one contract. We ran eight versions of the family over the same twelve and a half years. Seven of them lose money net of costs. The eighth clears them by $3.45 a trade at p = 0.9159, which is zero with a trade count attached.
When we tested ORB30 on seven years of NQ the long side came out at Sharpe 1.60 with t = +3.6, positive in every calendar year, and it beat both of its control groups. It went into our live book as the paper algo Daybreak. The identical machine pointed at the S&P produces a losing strategy in all eight configurations, and the least-bad one is a coin flip.
The rule
- ES minute bars from our own tick archive, regular session only, 09:30–16:00 New York.
- The opening range is the high and the low of the first 30 minutes after the cash open.
- The first bar to trade through the range high is a long. The stop sits one full range width below the entry. If the stop never trades, the position exits at the 16:00 close.
- One trade per session at most. If the range breaks first in the direction the variant does not trade, that session is skipped.
- The fill is
max(range high, bar open)— never the level itself. - A bar that contains both the stop and the target is scored as a stop.
- $4.50 commission plus two ticks per round trip. An ES tick is $12.50, so $29.50 comes out of every trade below.
The variants change one thing each: the side (long, short, both), the exit (close or a one-range-width target), the direction (follow the break or fade it), and the range length (5, 15, 30, 60 minutes).
Those two fill conventions are not decoration, and we did not always have them. We adopted the max(level, open) rule after our NR-breakout study produced t ≈ 3.9. That number turned out to be a gap-fill artefact. Bars that gapped through the trigger were being filled at the trigger, which is a price nobody could have had. We adopted the stop-before-target rule after a rejection-block strategy went from +$85k to −$65k the moment we stopped resolving both levels optimistically inside a single minute bar. A minute bar carries no path. If both levels are inside it, it is a loss.
Eight variants, seven losers and a coin flip
| Variant | Trades | Win rate | Avg | Total | PF | Sharpe | t |
|---|---|---|---|---|---|---|---|
| ORB30 short only, close exit | 1,425 | 36.0% | $3.45 | $4,912.50 | 1.008 | 0.03 | 0.11 |
| ORB15 long, close exit | 1,562 | 36.3% | −$2.84 | −$4,441.50 | 0.992 | −0.03 | −0.12 |
| ORB5 long, close exit | 1,575 | 25.3% | −$7.44 | −$11,712.50 | 0.974 | −0.10 | −0.35 |
| ORB60 long, close exit | 1,645 | 48.9% | −$9.97 | −$16,402.50 | 0.971 | −0.12 | −0.42 |
| ORB30 both sides, close exit | 3,083 | 39.7% | −$13.75 | −$42,398.50 | 0.965 | −0.20 | −0.70 |
| ORB30 long only, close exit | 1,658 | 42.8% | −$28.53 | −$47,311.00 | 0.922 | −0.34 | −1.20 |
| ORB30 long, 1R target | 1,658 | 49.0% | −$34.18 | −$56,673.50 | 0.898 | −0.46 | −1.64 |
| ORB30 fade the break | 3,083 | 40.4% | −$21.09 | −$65,011.00 | 0.946 | −0.28 | −1.01 |
Read the top row honestly: $4,912.50 over 1,425 trades is $3.45 a trade at p = 0.9159. That is what “nothing here” looks like when it happens to land on the positive side of zero. Nothing in this table is significant in either direction, which is itself the finding — the opening range on ES is not a level that pays to trade with or against.
Two rows are worth pausing on. Fading the break is the worst variant at −$65,011.00, so the ES tape does not reward mean-reversion at the range edge any more than it rewards continuation. And the fixed target has the second-highest win rate in the table, 49.0%, while producing the worst average trade at −$34.18. Capping the winners at one range width while leaving 699 stops at full size is a reliable way to make a bad strategy worse.
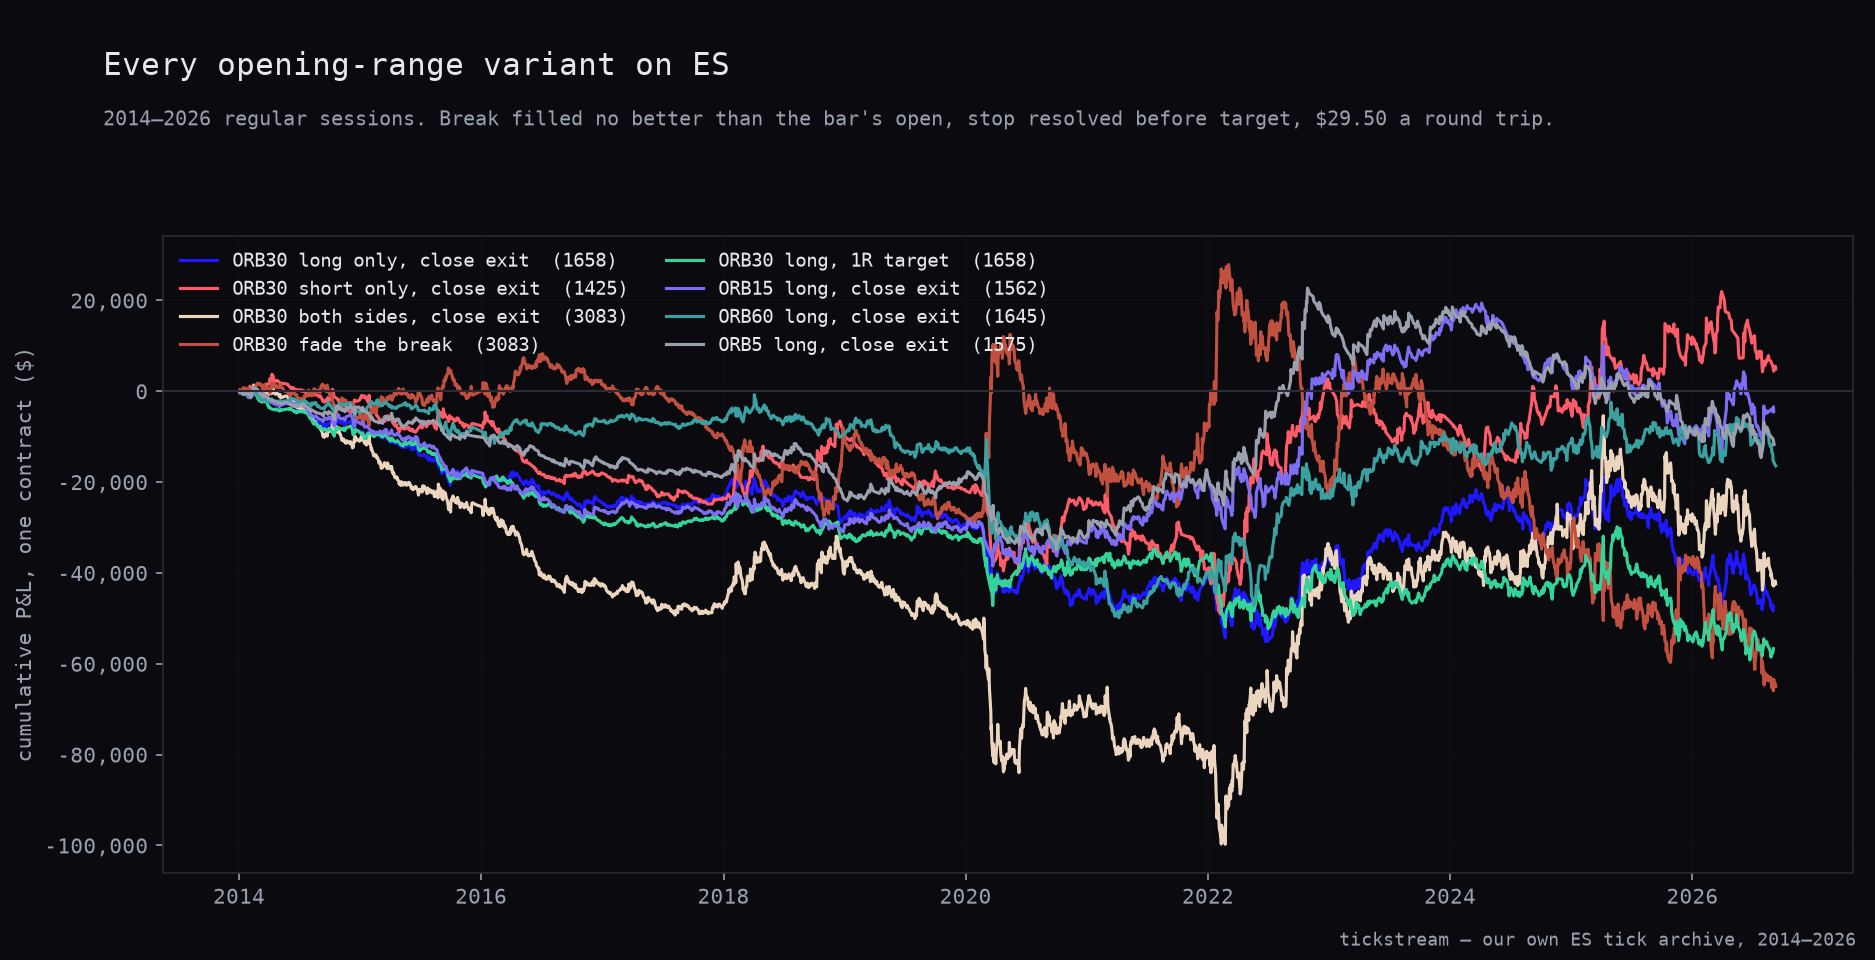
The equity curves show where the losses come from. Only the fade variant spends real time above zero, from roughly mid-2015 to early 2018, and it hands all of it back after that. The other seven sit below the line for most of the 2014–2019 stretch. The separation widens after the 2020 volatility spike. The curves that climb back toward zero afterwards are the short side, ORB15 and ORB5. The both-sides variant is the cream line at the bottom, carrying a maximum drawdown of $101,130.50.
The NQ survivor, year by year on ES
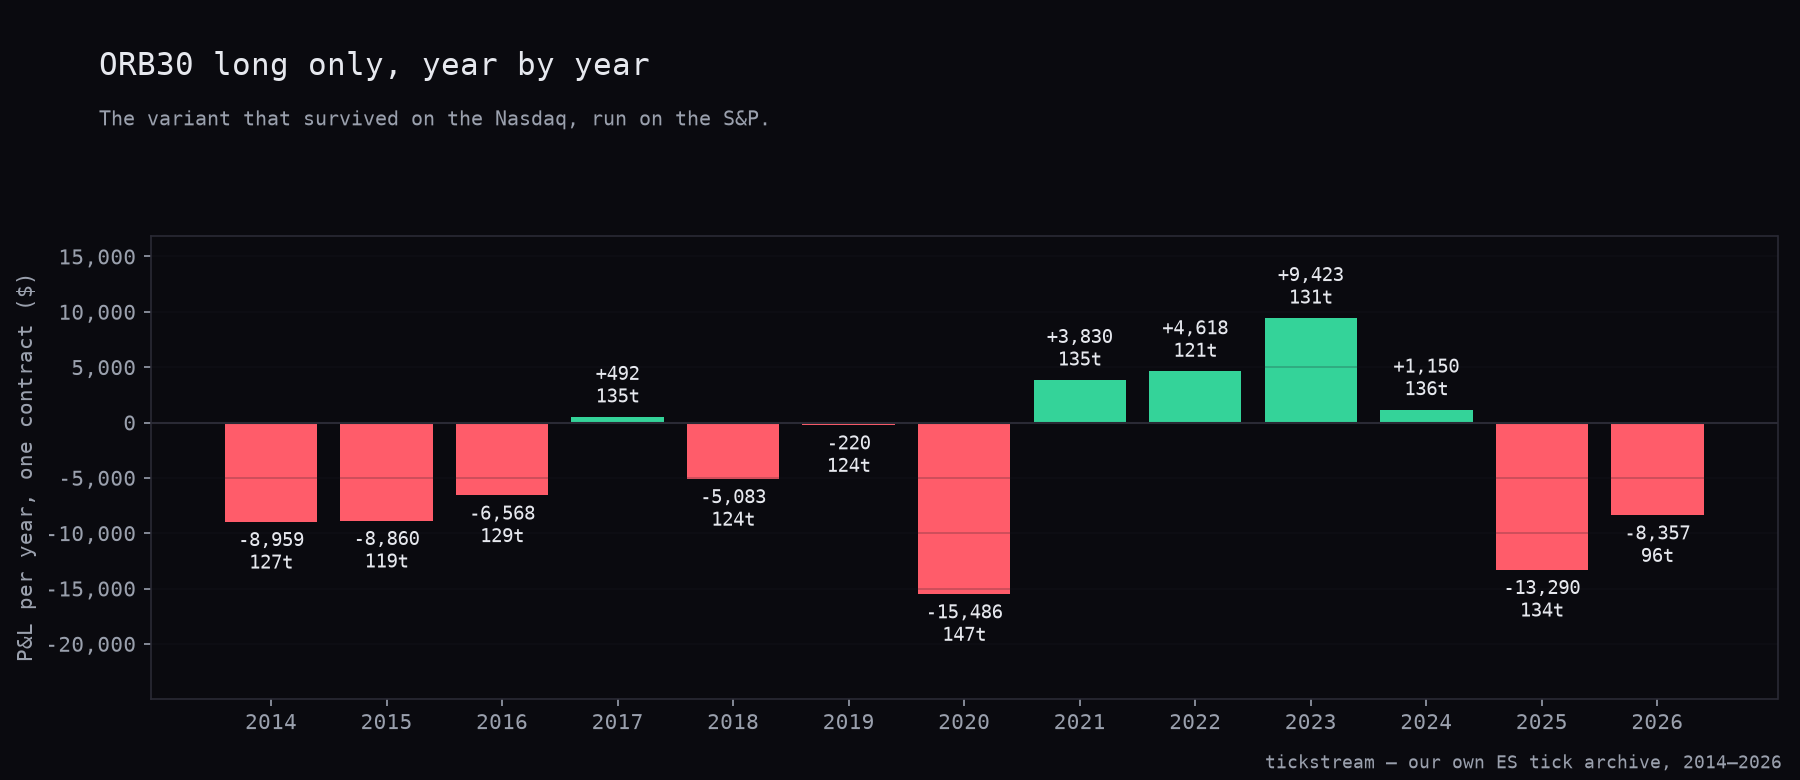
If ORB30 long had worked on ES and then decayed, the year table would show it. It does not. Five of thirteen years are green, four of them running consecutively from 2021 to 2024, with red on both sides of that block.
| Year | Trades | P&L |
|---|---|---|
| 2014 | 127 | −$8,959.00 |
| 2015 | 119 | −$8,860.50 |
| 2016 | 129 | −$6,568.00 |
| 2017 | 135 | $492.50 |
| 2018 | 124 | −$5,083.00 |
| 2019 | 124 | −$220.50 |
| 2020 | 147 | −$15,486.50 |
| 2021 | 135 | $3,830.00 |
| 2022 | 121 | $4,618.00 |
| 2023 | 131 | $9,423.00 |
| 2024 | 136 | $1,150.50 |
| 2025 | 134 | −$13,290.50 |
| 2026 | 96 | −$8,357.00 |
The worst year is 2020 at −$15,486.50 and the best is 2023 at $9,423.00. All five green years together come to $19,514.00, against $66,825.00 across the eight red ones.
The control: train and holdout
There is no placebo table in this article because there is nothing positive to defend against one. The relevant control is the split, and it runs the wrong way for anyone hoping the strategy is merely out of favour.
| Train 2014–2023 | Holdout 2024–2026 | |
|---|---|---|
| Trades | 1,292 | 366 |
| Win rate | 42.9% | 42.6% |
| Average per trade | −$20.75 | −$56.00 |
| Median | −$192.00 | −$417.00 |
| Total, one contract | −$26,814.00 | −$20,497.00 |
| Profit factor | 0.934 | 0.898 |
| Max drawdown | $56,094.00 | $29,428.50 |
| t | −0.87 | −0.83 |
The decade we would have fitted on loses $20.75 a trade. The holdout we kept back loses $56.00. Win rates are within 0.3 points of each other, so the deterioration is in the size of the losers, not their frequency. This is not an edge that crowded out. There was never an edge to crowd.
One number puts the whole thing in proportion. The ORB30 long trade loses $28.53 net and the round trip costs $29.50. Gross of costs the strategy is within a dollar of flat over 1,658 trades — the opening-range break on ES is a fair bet, and the commission and the spread are the entire result.
Why it travels on NQ and not here
We have a hypothesis and we are labelling it as one. Our own earlier work found NQ trends intraday, which is why fading its opening range lost and following it paid. ES does less of that. A long-only breakout is a bet on intraday continuation, so an index that continues less should pay it less. Sharpe 1.60 on NQ against Sharpe −0.34 on ES is a big enough gap to make the mechanism worth suspecting.
This test does not prove it. It measured one family on one index and found nothing. What it does establish is the cheaper, more useful rule: a strategy that survives on one index is not a strategy yet, it is an index-specific effect until somebody runs it on the neighbour.
What we changed
Nothing in the live book. Daybreak trades NQ, its rules are unchanged, and this result is not evidence against it — it is evidence about where it is allowed to point.
Two things did change. The NQ ORB30 article now carries the caveat it should have shipped with: the result is a Nasdaq result, not an opening-range result. And every cross-market port in this series gets run before we describe a finding as being about “index futures” rather than about one contract.
The archive this ran on is for sale: ES ticks back to 2014 with the real aggressor side on every print, in the historical data packages.
Methodology: ES regular-session minute bars (09:30–16:00 New York) built from our own tick archive, 3 January 2014 to 9 September 2026, 3,098 sessions with more than 300 minute bars. One trade per session maximum, entry on the first bar to trade through the opening-range extreme, filled at max(level, bar open) for longs and min(level, bar open) for shorts. Stop one range width from entry; a bar containing both stop and target is scored as a stop; otherwise the position is held to the 16:00 close. One contract, $4.50 commission plus two ticks slippage per round trip, $29.50 total. t-statistics are one-sample against zero on the trade series. Sharpe is annualised on the per-trade series over the twelve-and-a-half-year window.
Frequently asked questions
Does the 30-minute opening-range breakout work on ES?
No. Long-only ORB30 on 3,098 regular ES sessions from January 2014 to September 2026 took 1,658 trades, won 42.8% of them and lost $28.53 per trade after costs — −$47,311 on one contract. The profit factor is 0.922 and the t-statistic is −1.2, so it is a loser that is not even significantly a loser.
Which opening-range variant did best on the S&P?
The short-only version, and it is not an edge. It made $4,912.50 across 1,425 trades, an average of $3.45 with a profit factor of 1.008. The t-statistic is 0.11 and p is 0.9159 — the single positive number in the whole family is indistinguishable from zero.
Did ORB30 on ES work in some earlier regime and then stop?
The opposite of a decayed edge. The 2014–2023 train decade lost $20.75 a trade and the 2024–2026 holdout lost $56.00 a trade, so the recent period is the worse of the two. Only five of thirteen calendar years are green: they add up to $19,514.00 against $66,825.00 lost in the other eight.
Why does the same rule pay on NQ and not on ES?
Our best hypothesis is that NQ continues intraday more often than ES does, which is what a long-only breakout monetises. The NQ version earned Sharpe 1.60 at t = +3.6, while this one sits at Sharpe −0.34. This test does not prove that mechanism — it only shows the result does not carry across, and that the loss on ES is almost exactly the fee. Net of costs the average ES trade is −$28.53 against a $29.50 round trip.
Does a fixed target rescue the ES breakout?
It makes it worse. Adding a one-range-width target lifts the win rate from 42.8% to 49.0% and drops the average trade from −$28.53 to −$34.18, for −$56,673.50 total and the family's worst Sharpe at −0.46. The winners get capped while the 699 stops stay full size.