Pivot and Camarilla Levels Beat the Wrong Control and Lose to the Right One
We tested nine printed levels — floor pivots P, R1, R2, S1, S2 and Camarilla H3, H4, L3, L4 — on 3,642 ES regular sessions. Against a mirrored control they look spectacular: S2 reacts on 76.0% of its touches against 51.8% for its mirror, at t = 8.83. Against a nameless price on the same side of the market, nudged 13% of yesterday's range away, all nine collapse to at most 3.9 percentage points and not one clears p = 0.05. Trading the textbook version lost $81,698.83 over 2,359 trades.
We put the nine levels every retail platform prints — floor pivots P, R1, R2, S1, S2 and Camarilla H3, H4, L3, L4 — through 3,642 regular ES sessions. Against the control most published tests use, the levels look spectacular: S2 reacts on 76.0% of its touches against 51.8% for its mirror, at t = 8.83. Against a control that actually isolates the level, all nine collapse and not one reaches p = 0.05.
This is a methodology article with a strategy article’s title. The interesting number here is not whether pivots work. It is the size of the gap between the two controls, because that gap is what a lot of level research is actually selling.
The rule
- Levels come from the prior regular session’s high, low and close. P = (H + L + C) / 3, R1 = 2P − L, S1 = 2P − H, R2 = P + range, S2 = P − range. Camarilla: H3 = C + 1.1 × range / 4, L3 = C − 1.1 × range / 4, H4 = C + 1.1 × range / 2, L4 = C − 1.1 × range / 2.
- A touch is the first minute of the session whose range contains the level.
- A reaction is price moving 25% of the prior day’s range away from the level, in either direction, within 30 minutes of that first touch. Direction is not scored. The question is only whether something happened there.
- Touches in the last 30 minutes are dropped, because they have no forward window.
- Control 1, the mirror: the same distance from the prior close, on the other side.
- Control 2, the nudge: the same side of the market, the same session, moved 13% of the prior range further from the close. Nobody trades this price. It has no name and no chart line.
Both controls are measured exactly like the level: first touch, same 30-minute window, same 25% threshold.
Against the mirror, the levels are a business
| Level | Touches | Reacted | Mirror | Edge | t | p |
|---|---|---|---|---|---|---|
| P | 1,546 | 55.0% | 53.3% | +1.8pp | 0.97 | 0.3308 |
| R1 | 1,216 | 49.1% | 63.7% | −14.6pp | −7.23 | 0.0 |
| R2 | 618 | 49.7% | 71.1% | −21.4pp | −7.99 | 0.0 |
| S1 | 1,064 | 68.9% | 48.8% | +20.1pp | 9.77 | 0.0 |
| S2 | 588 | 76.0% | 51.8% | +24.2pp | 8.83 | 0.0 |
| H3 | 1,503 | 50.5% | 60.0% | −9.5pp | −5.18 | 0.0 |
| H4 | 1,082 | 48.2% | 66.0% | −17.7pp | −8.39 | 0.0 |
| L3 | 1,415 | 60.0% | 50.5% | +9.5pp | 5.18 | 0.0 |
| L4 | 1,043 | 66.0% | 48.2% | +17.7pp | 8.39 | 0.0 |
Eight of the nine p-values round to zero at four decimals; only P does not. Take the S1 and S2 rows on their own and you have a course. Support levels react on three touches in four, and a fake level at the same distance manages barely half. Every number in that sentence is real. The sentence is still worthless.
Why it is worthless
Look at the sign column. Every support-side level shows a large positive edge. Every resistance-side level shows an equally large negative one. R1 is −14.6 points, R2 is −21.4, H4 is −17.7 — the mirror of a resistance level beats it as badly as a support level beats its own mirror.
A real level effect cannot be signed by which side of yesterday’s close the level sits on. If S2 works because traders watch S2, then R2 has to work too, because the same traders watch R2. Instead the column reads as one continuous quantity that flips sign at the close. That quantity is the S&P’s up/down asymmetry: down-moves are faster, so a level below the close clears the 25% threshold more often than a level above it, whoever drew the line. Mirroring a support level puts the control in resistance territory, and the “edge” is just the difference between the two territories.
The Camarilla rows give it away completely. Mirroring H3 across the prior close returns C − 1.1 × range / 4, which is L3 to the decimal place. So H3’s mirror rate of 60.0% is L3’s reaction rate, H3’s own 50.5% is L3’s mirror rate, and the two t-statistics are +5.18 and −5.18 by construction. For half the table the mirror is not a placebo at all. It is the other Camarilla level, and the “edge” is the answer to a question nobody asked.
Notice also that the mirror edge grows with distance from the close. P, which sits nearest, shows +1.8 points at t = 0.97. R2 and S2, the furthest out, show −21.4 and +24.2. The asymmetry has more room to accumulate the further from the close you look. That is another thing a level story does not predict and a directional-drift story does.
Against the nudge, all nine die
The second control keeps everything the mirror got wrong and fixes the one thing that matters. Same side of the market. Same session. Same distance-from-the-close direction. It sits 13% of yesterday’s range further out, which is enough that no one is watching it and close enough that it lives in the same part of the tape.
| Level | Reacted | Nudged price | Edge | t | p |
|---|---|---|---|---|---|
| P | 55.0% | 57.7% | −2.7pp | −1.46 | 0.1444 |
| R1 | 49.1% | 50.1% | −1.0pp | −0.47 | 0.6356 |
| R2 | 49.7% | 46.9% | +2.8pp | 0.93 | 0.352 |
| S1 | 68.9% | 67.1% | +1.8pp | 0.85 | 0.3968 |
| S2 | 76.0% | 75.6% | +0.4pp | 0.17 | 0.8658 |
| H3 | 50.5% | 50.0% | +0.5pp | 0.28 | 0.776 |
| H4 | 48.2% | 47.5% | +0.7pp | 0.33 | 0.7433 |
| L3 | 60.0% | 62.9% | −2.9pp | −1.52 | 0.1286 |
| L4 | 66.0% | 69.9% | −3.9pp | −1.84 | 0.0664 |
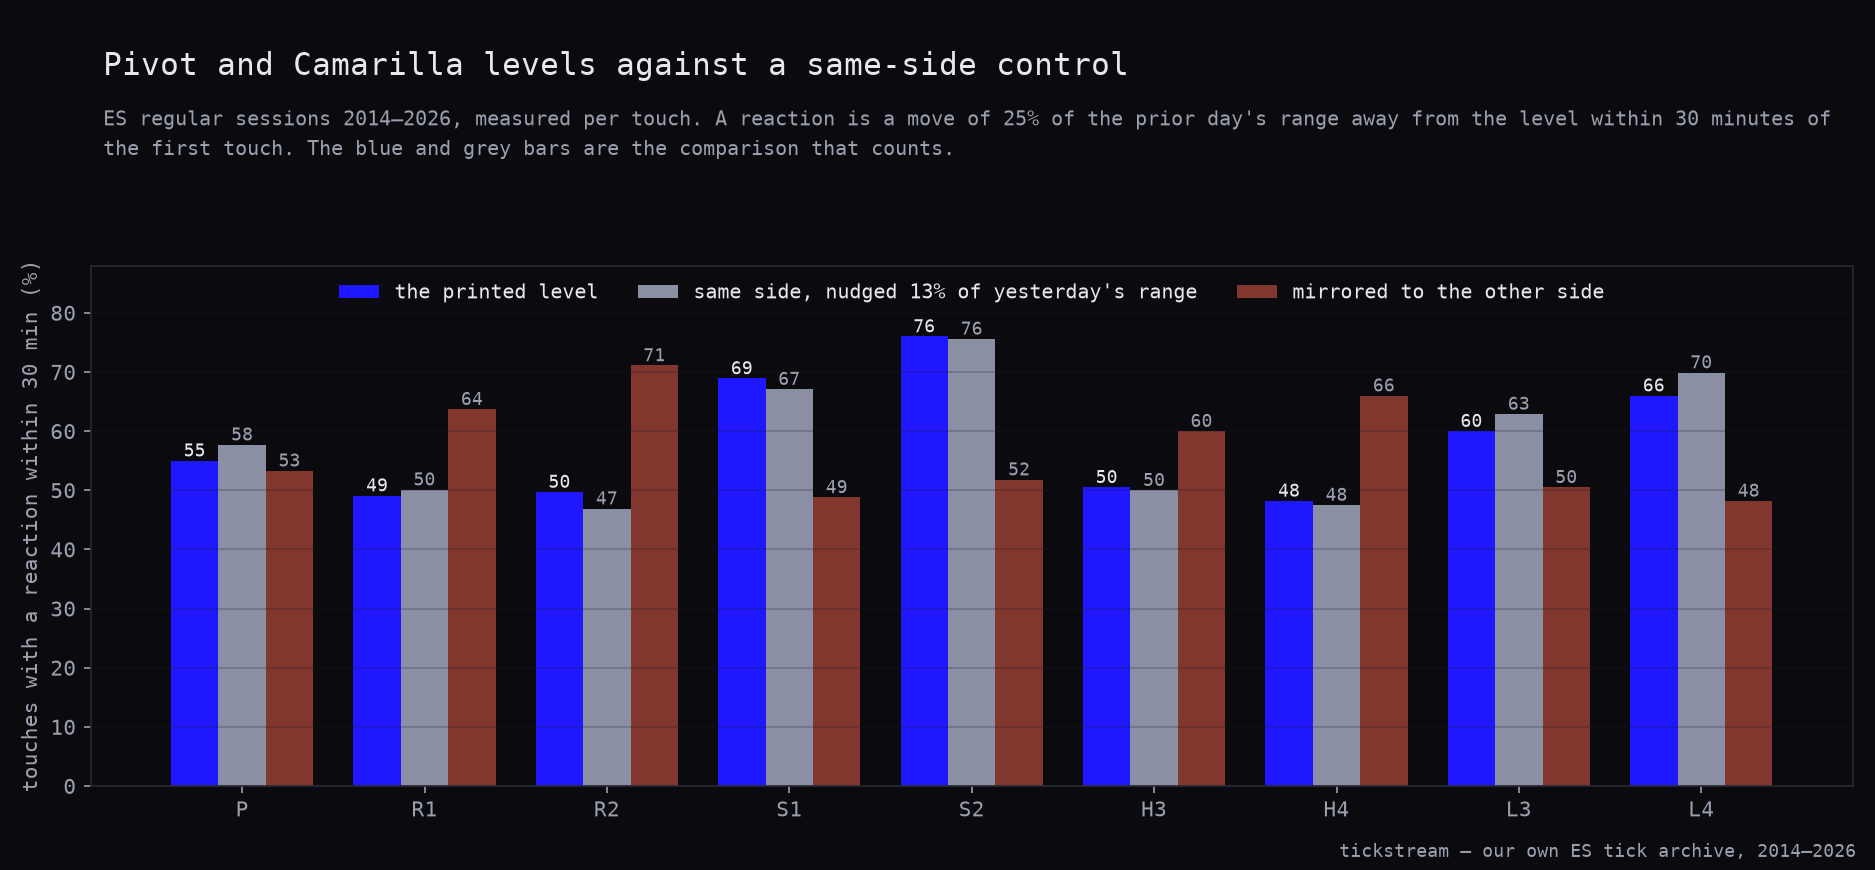
S2 keeps its 76.0%. It just no longer keeps it to itself: a price 13% of the range below it reacts on 75.6% of its own touches. The whole 24.2-point advantage was the control’s fault.
Nothing in this table clears the usual bar. The largest edge in either direction is 3.9 percentage points and the smallest p-value is 0.0664. Both belong to L4, and both point the wrong way — the unnamed price reacts more often than the Camarilla level, 69.9% against 66.0%. L3 does the same thing on a smaller scale, −2.9 points at t = −1.52. If we were hunting we would call that a hint that drawing a line 13% of the range further out is marginally better than drawing it where the book says. We are not hunting, and neither result survives a second look.
Touch counts fall for the nudged price, as they must: S2 was touched 588 times, its nudged twin 479. That is the distance effect, and it is why the reaction rate is conditioned on a touch rather than measured per session.
The chart puts all three bars side by side for all nine levels. Blue is the printed level, grey is the same-side nudge, red is the mirror. The axis counts touches with a reaction inside 30 minutes, not sessions. The comparison that decides the question is blue against grey, and those two bars are the same height nine times out of nine. Red is the one that sells courses.
The tradeable version
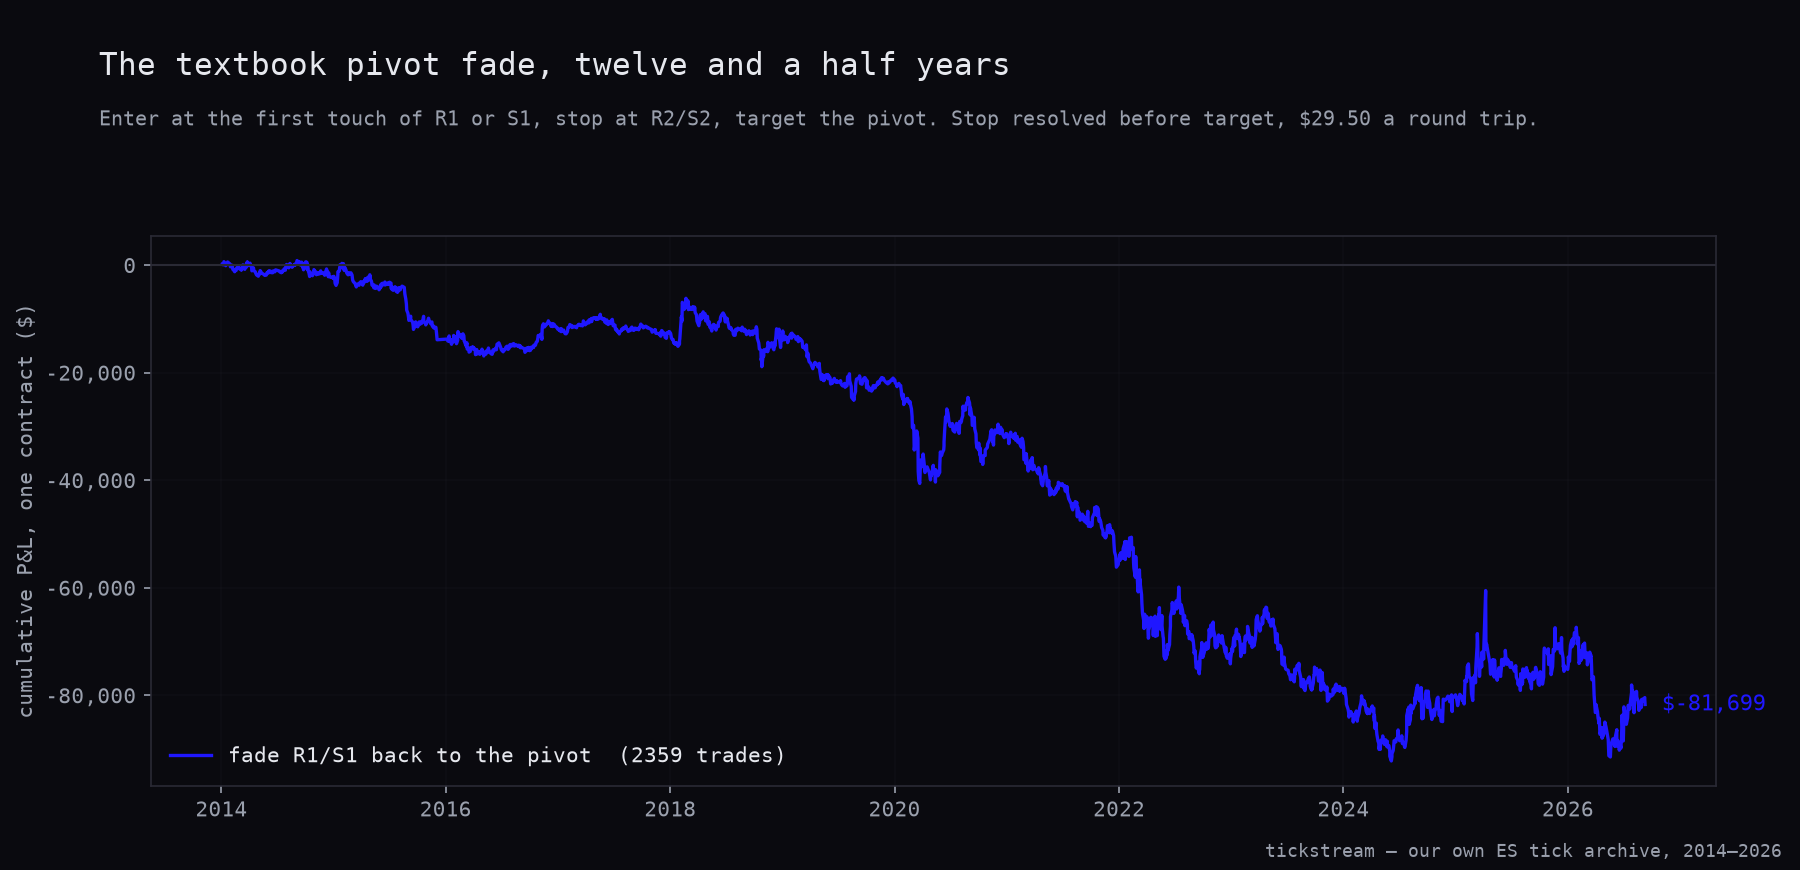
Reaction rates are not P&L, so we ran the textbook rule as well. Enter at the first touch of R1 short or S1 long, stop at R2 or S2, target the pivot. One contract, costs in, stop resolved before target whenever a single bar contains both.
| Fade R1 and S1 | |
|---|---|
| Trades | 2,359 |
| Win rate | 49.1% |
| Average | −$34.63 |
| Total | −$81,698.83 |
| Median | −$29.50 |
| Profit factor | 0.901 |
| Max drawdown | $93,056.83 |
| Sharpe | −0.51 |
| t | −1.81 |
| p | 0.0705 |
| Exits | 850 target, 827 stop, 682 timeout |
The curve is not a collapse. It is a slope across twelve and a half years, which is the shape a rule with no edge makes once you charge it $29.50 a round trip.
Split by side, the two halves lose differently:
| Trades | Win rate | Average | Total | Median | PF | t | p | |
|---|---|---|---|---|---|---|---|---|
| Fade R1 | 1,259 | 46.5% | −$26.64 | −$33,536.33 | −$96.17 | 0.92 | −1.01 | 0.3124 |
| Fade S1 | 1,100 | 52.1% | −$43.78 | −$48,162.50 | +$60.08 | 0.88 | −1.57 | 0.1161 |
The honest detail is in the S1 row. Its median trade makes $60.08, and it is still the worse of the two halves. More than half the trades are winners, the typical trade is a winner, and the average is negative anyway.
That is exit geometry, not signal. The rule hit its target 850 times and its stop 827 times, near enough a coin flip. It still returned a profit factor of 0.901, which only happens when the losers are bigger than the winners. Nothing in the rule makes the stop and the target equidistant: one is set by yesterday’s range and the other by yesterday’s pivot, and they are simply different distances. We have taken this apart before, in the wickless-candle test, where an 88% win rate turned out to be a description of the bracket. Same lesson, opposite sign.
What we changed
Nothing in the book, because there was nothing to add. What we did change, some time ago, is how we test a level at all.
We run the same-side control on everything now. Our GEX-level work died against a mirrored-level placebo four separate times before we accepted the verdict, and the volume-profile battery went the same way. Each time the level looked strong until it was compared with a price that had the same location and no story. The lesson we keep having to relearn is short: a level test without a same-side placebo is not a test. It is a measurement of where the level sits.
The mirror is worse than no control, because it produces a large number with a small p-value and points it in the direction you were hoping for. This article exists mainly to show what that failure looks like when you print both columns next to each other.
One note on the window. This ran on our own ES tick archive, roughly 3,640 cash sessions from 2014 to 2026 — five years longer than the NQ archive most of our earlier level work used. When we mechanized a reader’s Camarilla strategy on MNQ in July, the verdict was the same on a shorter history. The extra five years did not rescue the levels; it made the null tighter.
Data: tickstream ES tick archive, 3,642 regular sessions, 2014-01-03 to 2026-09-10. Session 09:30–16:00 New York, management on one-minute bars. Levels from the prior regular session’s high, low and close. A reaction is a 25%-of-prior-range move away from the level within 30 minutes of the first touch, either direction. Controls: mirrored across the prior close, and shifted 13% of the prior range further from the close on the same side. Costs $29.50 a round trip on one ES contract — $4.50 commission plus two ticks at $12.50. Stops resolve before targets when a single bar contains both. Significance from Welch two-sample t-tests on the reaction rates and a one-sample t-test on trade P&L.
Frequently asked questions
Do pivot points and Camarilla levels actually work on the S&P 500?
Not against a fair control. Across 3,642 ES regular sessions since 2014, the biggest gap between a printed level and an unnamed price on the same side of the market was 3.9 percentage points, and it went the wrong way: Camarilla L4 reacted on 66.0% of its touches while the nudged price reacted on 69.9%. Not one of the nine levels reached p = 0.05 against that control; the lowest p-value in the table is 0.0664.
Why do pivot levels look so strong in most published tests?
Because the usual control is mirrored to the other side of the market, which turns the test into a measurement of the S&P's up/down asymmetry. S2 reacted on 76.0% of its touches against 51.8% for its mirror, an edge of 24.2 percentage points at t = 8.83. The tell is that every resistance-side level shows an equally large negative edge — R2 at −21.4 points, H4 at −17.7 — and a real level effect would not be signed by which side of yesterday's close it sits on.
Is the Camarilla mirror control even a placebo?
For H3, H4, L3 and L4 it is not a control at all, it is the opposite Camarilla level. Mirroring H3 across the prior close produces L3 exactly, which is why H3's mirror rate of 60.0% is L3's own reaction rate to the decimal and the two t-statistics are +5.18 and −5.18. That comparison answers whether the S&P falls harder than it rises, not whether the level does anything.
Does fading R1 and S1 back to the pivot make money?
No. Entering at the first touch of R1 or S1, stopping at R2 or S2 and targeting the pivot produced 2,359 trades over twelve and a half years, a 49.1% win rate and a loss of $81,698.83 on one contract after costs. The profit factor was 0.901, the Sharpe −0.51 and the deepest drawdown $93,056.83.
Why does the pivot fade lose with a win rate near 50%?
Because the bracket is lopsided, not because the entry is unusually bad. The rule hit its target 850 times and its stop 827 times, and still returned a profit factor of 0.901, which means the average loser was larger than the average winner. The S1 side is the clean illustration: a median trade of +$60.08 alongside an average of −$43.78.