A Reader Sent Us Their Camarilla Reversal Strategy. We Backtested It — Exactly As Written.
A community member submitted their full ruleset: Camarilla S3/S4/R3/R4 reversals on MNQ, daily 21-EMA filter, confirmation candles, stop under the candle, fixed 1:3 RRR, 9–11 ET, max 3 trades a day. We mechanized it word for word on 7 years of NQ tick data and ran it against placebo levels. The result is the cleanest zero we've ever measured — and a textbook lesson in why a fixed 1:3 can't create an edge.
This one came from the community. A reader sent us their complete ruleset — genuinely complete, which almost never happens — and asked what the data says. Here is the strategy, condensed but faithful:
MES & MNQ only. Daily candles above the 21 EMA → longs only; below → shorts only. Plot Camarilla pivots, use only S3/S4/R3/R4. Reversals only: for longs, price taps S3 or S4 (or closes slightly past), then a reversal confirmation candle (doji, engulfing, double top/bottom, hammer, shooting star) → enter at the close of that candle. Stop just below the reversal candle. Always 1:3 RRR. Shorts mirror at R3/R4. Trade only 9–11 AM ET. Day is over when there’s no setup, after 3 trades, or the moment a take-profit hits. All or nothing — “even if you are ONE TICK AWAY, DO NOT TOUCH.”
That’s a spec. We test specs. So: 7 years of NQ tick data (MNQ trades the same prices; MES we can’t test — our ES history only starts mid-2026, disclosed), micro economics ($2/pt, $2 round-trip including slippage), management on 1-minute bars, stop-checked-before-target, flat at the close. The submission doesn’t name the confirmation-candle timeframe, so we ran both common readings — 5-minute and 15-minute — and every pattern in the list is implemented (doji, engulfing, hammer, shooting star, double top/bottom). One stat judges everything: t — how far the average day sits from zero relative to its own noise; |t| > 2 is real.
The cleanest zero we’ve ever measured
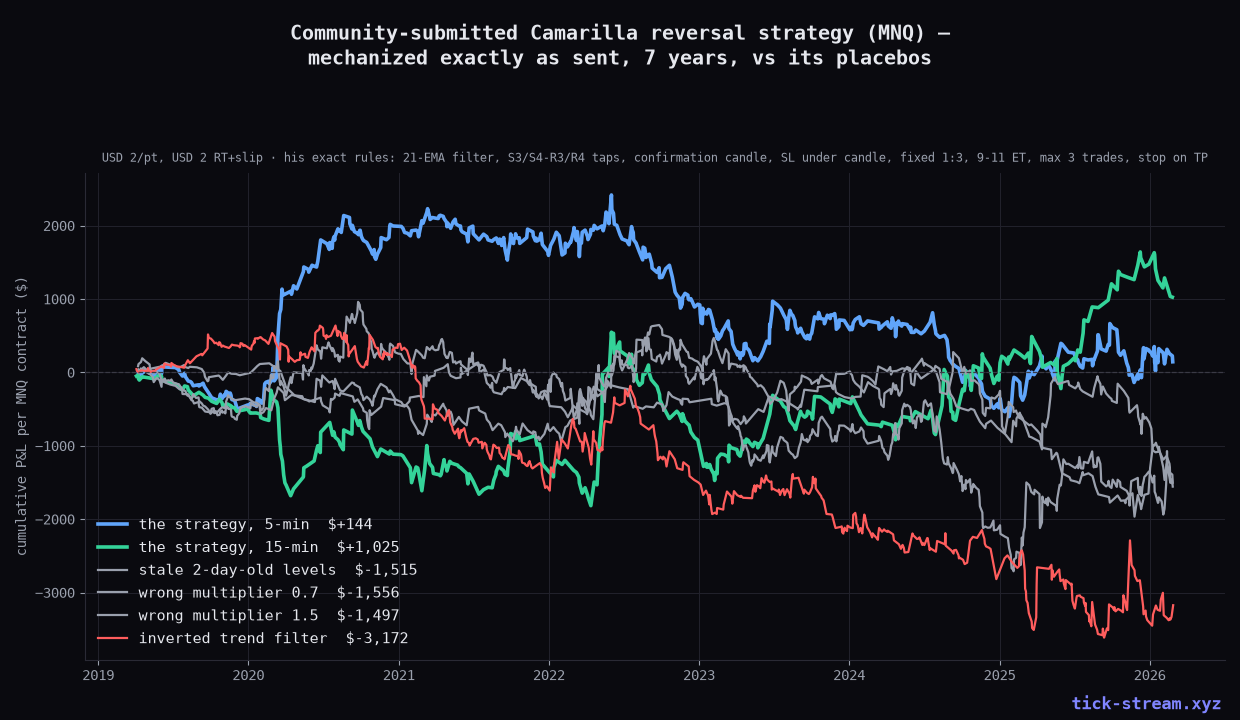
914 trades. 25.7% win rate. Net +$144 over seven years. t = +0.07.
Not a money-printer, not a account-burner: a coin flip with excellent manners. The 15-minute reading is the same story with fewer trades — +$1,025 over 7 years (≈ $146/year per contract, t = 0.4). No year stands out in either direction.
Why it HAS to be zero: the 1:3 arithmetic
Here’s the part worth internalizing, because it applies to every “always take 1:X” rule you’ll ever hear.
At a fixed 1:3 reward-to-risk, the breakeven win rate is exactly 25% (before costs). The strategy wins 25.7% of the time. That is not a coincidence — it’s what entries with no informational content look like when you strap a 1:3 bracket on them. The RRR decides your win rate; it cannot decide your expectancy. If the entry is random, every bracket geometry converges to the same place: zero, minus costs.
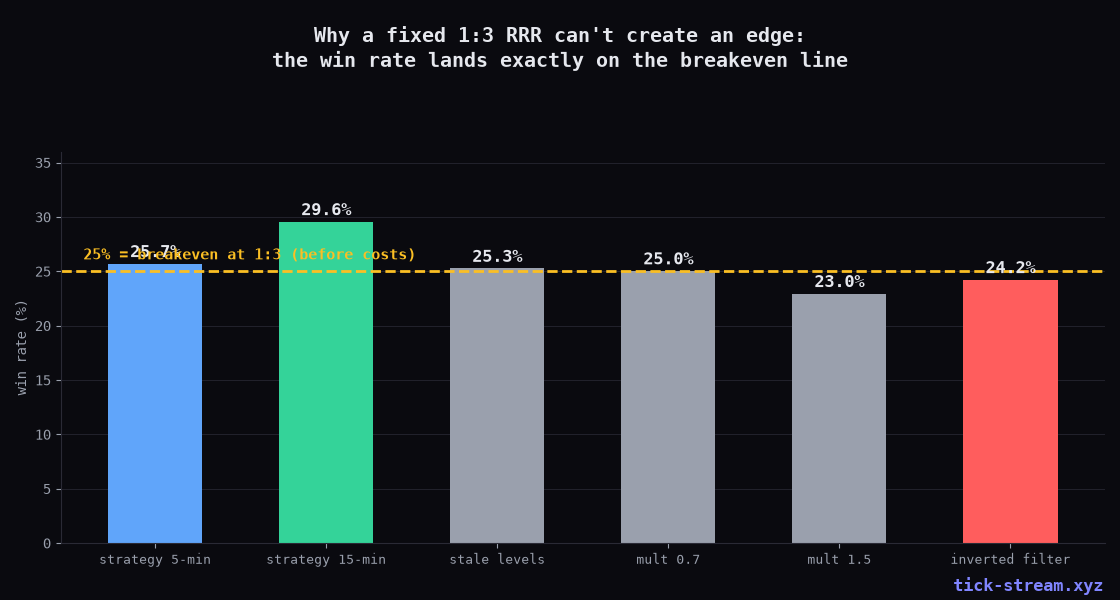
The placebos complete the picture. Same machine, same candles, same management — but Camarilla levels computed with wrong multipliers (0.7 and 1.5 instead of the canonical 1.1), or from two-day-old stale OHLC: all of them sit in the same zero-to-slightly-negative band, win rates 23–25.3%. If the real S3/S4/R3/R4 prices carried information, they’d have to separate from the fakes. They don’t. Even dropping the confirmation candle entirely (enter on any tap) changes nothing (t = 0.4) — and inverting the 21-EMA filter, which should turn a real edge into a reliable loser, produces only noise-grade bleed (t = −1.3).
What the submission gets right
We test a lot of strategies, and most lose money reliably. This one doesn’t — and that’s not luck, it’s the risk discipline doing exactly what risk discipline does:
- Fixed, known risk per trade (stop under the reversal candle) — no blowup tail.
- Three-trade daily cap and “quit after a win” — hard ceiling on daily damage and on overtrading.
- A defined session (9–11 ET) — the two liquid morning hours, where spreads and slippage are smallest.
- No partials, no averaging, no discretion — the reason we could even test it.
That discipline is why the equity curve is flat instead of bleeding. But discipline is a cost cap, not an edge. What’s missing is the part that actually decides expectancy: an entry that knows something about the next hour. The reversal-candle-at-pivot entry, measured against every placebo we could throw at it, doesn’t.
This is the same conclusion our level-family research keeps reaching from the other direction: on NQ, marked levels — volume-derived, pivot-derived, or arithmetic like Camarilla — get absorbed. The mechanical edges we’ve validated live elsewhere: trend-pullback continuation, stretched-move mean reversion, compression breakouts.
Send us yours
This is what we want more of: complete rules, honestly stated, testable. If you have a strategy — yours or your favorite guru’s — send the full, unfiltered ruleset through the strategy submission form. We’ll mechanize it exactly as written, run it on 7 years of real tick data with honest fills, real costs and placebo controls, and publish what comes out — whatever it shows.
Methodology: NQ front-month tick store 2019–2026 (MNQ trades identical prices; MES untestable — our ES recording starts 2026-06). Camarilla from prior full Globex-day OHLC (RTH-range variant tested, same result). Daily 21-EMA on Globex daily closes, evaluated on the prior day’s close (no lookahead). Entries at confirmation-candle close 9:00–11:00 ET; management on 1-minute bars, stop-before-target; flat 16:00 ET. $2/pt, $2.00 RT incl. slippage per MNQ. This is research, not trading advice; our own live, disclosed track records are on /algos.
Frequently asked questions
Does the Camarilla pivot reversal strategy work on MNQ?
Mechanized exactly as submitted (daily 21-EMA direction filter, entries only at S3/S4 or R3/R4 taps with a reversal confirmation candle, stop just beyond the candle, fixed 1:3 reward-to-risk, entries 9–11 AM ET, max three trades a day, done for the day once take-profit hits), it produced 914 trades over 7 years of NQ tick data and netted +$144 per MNQ contract — a t-statistic of 0.07. That is not an edge and not a disaster: it is a statistically perfect zero. On 15-minute candles it makes about $146 a year per contract (t=0.4), which is still indistinguishable from luck.
Why does a 25% win rate with 1:3 RRR come out to zero?
Because that's the arithmetic of the geometry: at 1:3 you need 25% winners to break even before costs, and the strategy wins 25.7%. A fixed reward-to-risk ratio repositions your outcomes — many small losses, few large wins — but it cannot manufacture expectancy. If your entries carry no information about direction, any RRR produces zero minus costs. The win rate landing almost exactly on the breakeven line is the signature of entries that are effectively random.
Do the Camarilla levels themselves add anything?
No. We ran the identical machine on placebo levels: Camarilla computed with wrong multipliers (0.7 and 1.5 instead of 1.1) and Camarilla computed from two-day-old stale OHLC. All variants cluster in the same zero-to-slightly-negative band as the real levels. If the specific S3/S4/R3/R4 prices carried information, the real levels would have to beat the fake ones. They don't.
Is this strategy bad, then?
It's better than most things we test — because it's honest about risk and it doesn't lose. The tight discipline (fixed risk, three-trade cap, quit after a win, no revenge trading) keeps costs and variance under control, which is why the equity curve is flat instead of bleeding. What's missing is an entry with informational content: the reversal-candle-at-pivot entry is interchangeable with a random-level entry. Discipline caps the damage; it doesn't create the edge.
Can I submit my own strategy to be backtested?
Yes — send the full, unfiltered rules (entries, exits, stops, session, timeframe, management) through the strategy form on tick-stream.xyz/request-market?topic=strategy. We mechanize submissions exactly as written, run them on 7 years of real tick data with honest fills, real costs and placebo controls, and publish the results — whatever they show.