Same Signal, Two Trades: Naked Future vs Defined-Risk 0DTE — Priced on Real Ask/Bid Quotes
We took our live contrarian sleeve's signals and priced BOTH expressions over 7.4 years: one NQ future held open-to-close, versus one ATM 0DTE option bought at the ask and sold at the bid. The option is the first options-BUYING strategy that survives real costs in our entire research program — because these specific days are the measured exception to the volatility risk premium. Full numbers, including the year it made nothing.
Every options educator sells the same sentence: risk defined, upside open. Almost nobody prices it honestly, because pricing it honestly requires the one thing sellers of courses don’t have — years of real bid/ask quotes.
We have 7.4 years of them, for every 0DTE contract that ever traded on our signal underlying. So we priced the sentence.
The setup
Our contrarian sleeve fires ~2 signals a week before the open (the composition is proprietary; the record is public). We took every signal day where a same-day expiry existed — 125 days from 2019 to 2026 — and priced both expressions with zero charity:
- Future: one NQ, entry at the open, exit market-on-close. The live sleeve.
- Option: the ATM 0DTE in signal direction, bought at the real ask 09:32–09:35, sold at the real bid before the close. Strike chosen by put-call parity, no hindsight.
What the option version earns
+$92 per contract per trade on ~$197 average premium — +35.6% average return on premium (median +19.8%), 52% win rate, t=2.78 across 125 trades. To our knowledge that makes it the first options-buying strategy in our entire research program to survive real ask-to-bid costs.
It survives for a measured reason, not a story: on these signal days the realized move systematically exceeds what the morning straddle prices in. On ordinary days it doesn’t. Buying premium is a losing trade in general — these days are the exception, and we measured the exception before trading it.
What it costs you
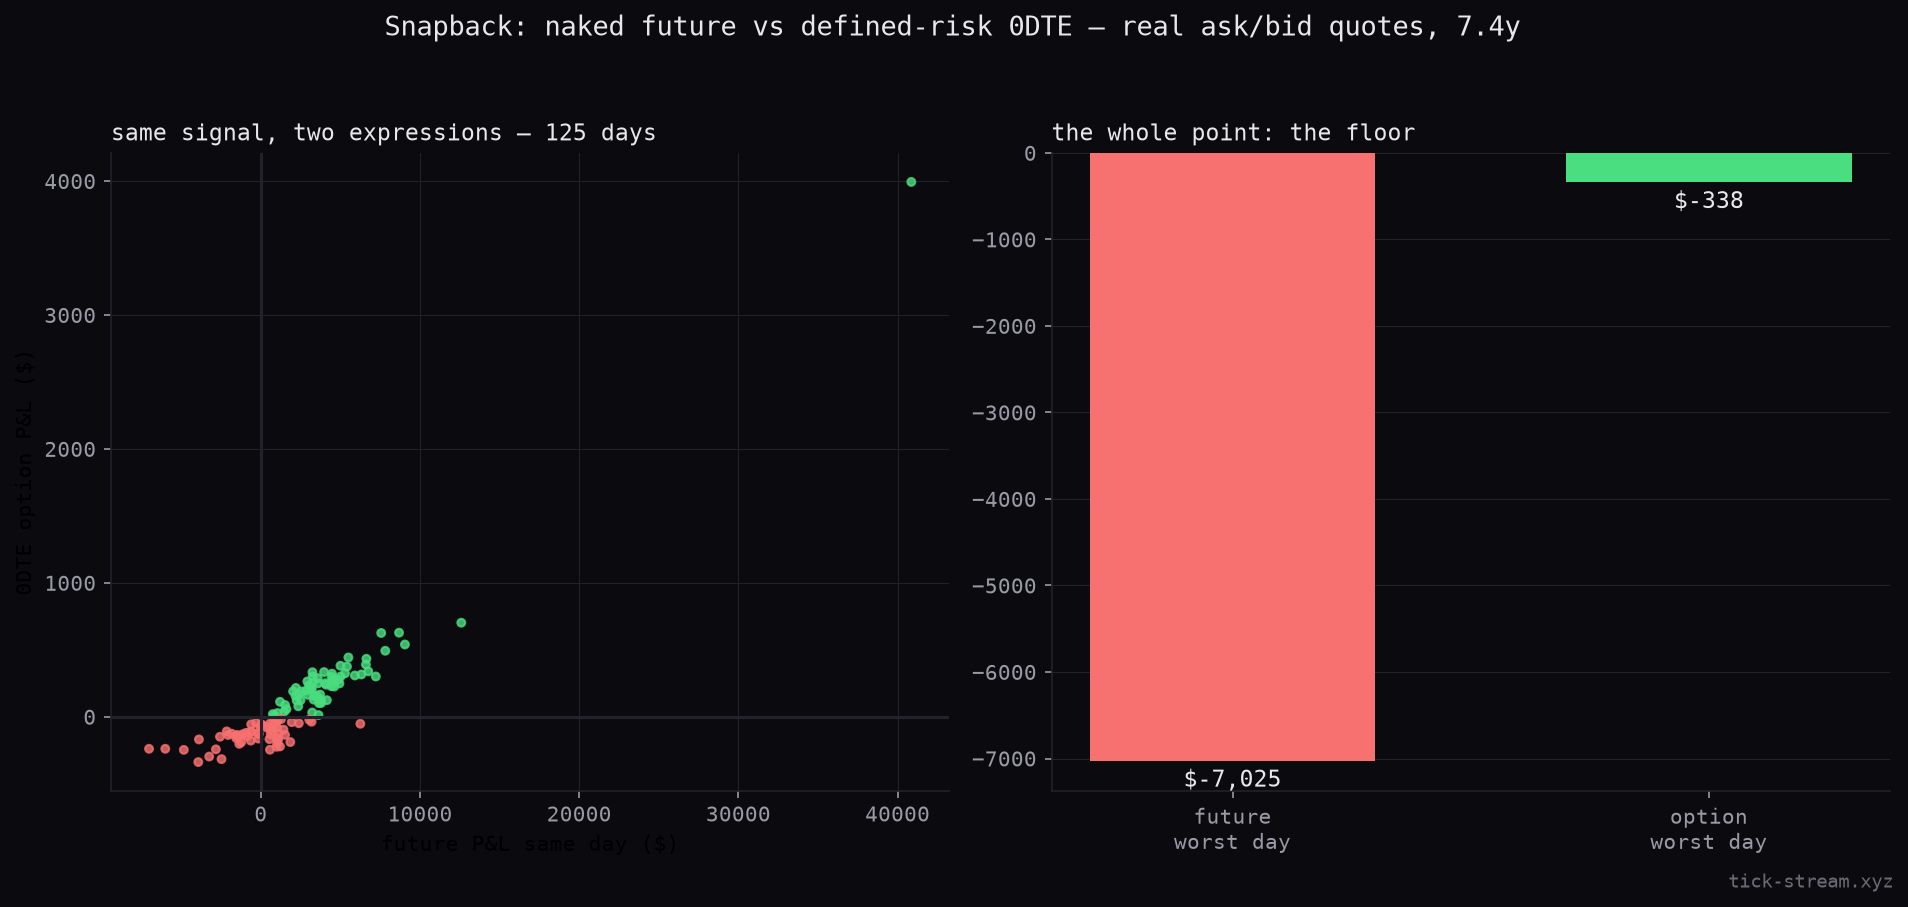
The same 125 days traded as one naked future: $2,268 per trade (t=5.8). The option keeps a fraction of that expectation. What you buy with the difference:
- Worst option day in 7.4 years: −$338. The premium. That’s the entire left tail.
- Worst future day on the same signals: −$9,320. Our live record includes a −$12,870 future day; its option twin lost $250.
- No overnight, no gaps, no margin. Maximum loss known before entry.
And the honest fine print: 2024 returned +0.1% on premium — a whole year of paying for insurance the market never cashed. 52% win rate means you lose the entire premium often; the average is carried by occasional multiples (best day: +729% on premium). Out-of-sample significance is thinner than the future’s. This is a risk-shape, not a better edge. And it is deliberately infrequent: ~17 trades a year on average (about 25 in the modern daily-expiry era) — crowd extremes are rare by definition, and a strategy that only fires on the measured exception cannot also fire every day. Sizing scales through premium budget per signal, not through more signals.
What we didn’t do
We ran a pre-declared optimization grid — strike (ATM, 1–2 OTM) × entry time (open, 11:30, 13:00) — and the naive spec won every cell. OTM strikes pay more spread than their extra convexity earns; later entries buy after part of the move has priced in. There was nothing to tune, which is the best anti-overfitting evidence a grid can produce.
One order-flow-timing refinement looked seductive in-sample. It also carries the exact fragility signature (window-dependent, non-monotonic) that killed five order-flow ideas before it — so it sits in a forward-tracking cage, published only if real trades earn it.
The signal behind this study trades live as Snapback; its records are public and unedited. The quote data is our own OPRA options history.
Frequently asked questions
Does buying 0DTE options ever beat the spread?
Almost never — and that's measured, not opined. Options buyers pay the volatility risk premium plus the bid/ask spread, and every options-buying idea we had previously tested lost after real costs. This is the single exception we've found: on our contrarian sleeve's signal days, the market's realized move systematically exceeds what the morning straddle prices in (measured ratio 1.72 vs 1.64 on ordinary days). That measured gap is what pays for the spread — on those days only.
What are the actual numbers?
125 tradable signal days across 7.4 years, entry at the real ask 09:32-09:35 ET, exit at the real bid before the close: +$92 per contract per trade on roughly $197 average premium — a 35.6% average return on premium (median +19.8%), 52% win rate, t=2.78. The same signals traded as one naked NQ future made $2,268 per trade — far more in expectation. You pay for the floor.
Then why trade the option version at all?
The floor. The worst option day in the whole sample lost $338 — the premium, nothing more. The worst future day on the same signals lost over $9,000, and our live record includes a −$12,870 future day whose option twin lost $250. No overnight risk, no gap risk, no margin call, maximum loss known before entry. It converts the same edge into a shape some traders can actually hold.
What's the catch?
Three, stated plainly. The premium bleeds in years when the snap-back comes small: 2024 was a zero (+0.1% return on premium) while the future version still made money. The win rate is 52% with frequent total premium losses — the average is carried by occasional multiples (+729% was the best). And significance out-of-sample is thinner than the future's (t≈1.6 vs 5.8): this is a risk-profile choice layered on a validated signal, not a better signal.
Did you try to optimize it?
Yes, with a pre-declared grid — and everything lost to the naive version. OTM strikes pay proportionally more spread than the extra convexity earns; entering later (11:30, 13:00) buys after part of the move is priced in. ATM at the open won every cell. The one legitimate amplifier is a regime-depth filter that was measured on the futures side first. A further order-flow-timing variant looked promising but carries the fragility signature that killed five order-flow ideas before it — it lives in a forward-tracking cage until real trades judge it.