Our Best ES Result Was a Bug in Our Own Backtest, and Here Is the Line That Caused It
This article was written to report a trend pullback making $23.02 a trade and $1,385,292 over twelve and a half years at t = 19.57. It was wrong. One line decided which of several resting limits we were filled on, using information that only exists after the fact. Corrected, the same rule takes 74,513 trades and loses $23.88 each, $1,779,525 in total at t = -23.99, with all thirteen calendar years red. The wick filter question the article was built around turns out not to matter: filtered loses $24.46 a trade, unfiltered $23.88.
This article was supposed to report the best result in our S&P 500 series: a trend pullback on ES making $23.02 a trade across 60,189 trades, +$1,385,292 on one contract, t = 19.57, with a daily Sharpe of 4.29. It had survived a random-entry control, a passive-limit control, a train/holdout split and a slippage ladder.
It was wrong. The same rule, with one line corrected, takes 74,513 trades and loses $23.88 each — −$1,779,525 at t = −23.99, with every one of the thirteen calendar years red. The correction is worth $3.16m, and the error was ours.
The line
Every setup in this series that rests a limit order was written the same way:
out, busy = [], -1
for i in range(start, n):
    if i <= busy: continue              # one position at a time
    if not signal(i): continue
    lvl = level_price(i)
    for j in range(i + 1, i + 1 + TTL):  # walk THIS level's future to its fill
        if touched(j, lvl):
            pnl, xi = bracket(j, lvl)
            out.append(pnl); busy = xi   # ← here
            break
The outer loop walks signals in the order they are created. For each one it searches that level’s own future for a fill. busy is only set when a trade is actually taken.
Now consider two levels in the same stretch of tape:
| Level A is marked at bar 10 | it fills at bar 40, exits at bar 45, so busy = 45 |
| Level B is marked at bar 12 | it would have filled at bar 15 |
| What the loop does | skips B, because 12 <= 45 |
Live, B fills at bar 15 — twenty-five bars before A is touched at all. The backtest kept the later fill and deleted the earlier one. Deciding which of your resting orders you get filled on requires knowing which one worked out.
This is not the classic lookahead where a future price leaks into an entry decision. No future price is used. It is selection between competing orders, and it is quieter for it.
Why it was worth $3.16m and not $30,000
The bias points one way. A level that takes a long time to fill is a level the price travelled a long way to reach. Those are the deep pullbacks — the entries far from the signal bar, where the bracket has room and the stop is not immediately in play. The shallow fills, the ones that trigger two bars later and get stopped almost at once, are exactly the ones a slow-filling sibling deletes.
So the scan did not sample the strategy’s trades. It sampled its best trades, and it did so consistently for twelve and a half years.
The trade count is the fingerprint. The broken version found 60,189 trades; the corrected one finds 74,513. The correction does not remove trades, it adds 14,324 that the old code had suppressed — and those 14,324 are the ones that lose.
What the rule actually does
- 5-minute ES bars. Trend from EMA-50 against EMA-200 on the close.
- Any bar closing with the trend is a signal. Its low (longs) or high (shorts) becomes the level, set once and never moved.
- A limit rests there for up to 24 bars.
- On a fill: stop one ATR(14) away, target two ATR, out after 48 bars.
- One position at a time. A fill bar that also sweeps the stop is booked as a stop, not a free entry.
Nothing about the rule changed. Only which fills it is allowed to claim.
The corrected table
All figures are 868,567 five-minute bars, 2 January 2014 to 10 September 2026, one contract, $29.50 a round trip.
| Version | Trades | Win rate | Per trade | Total | t |
|---|---|---|---|---|---|
| No wick filter | 74,513 | 35.9% | −$23.88 | −$1,779,525 | −23.99 |
| Wick filter on | 31,250 | 36.1% | −$24.46 | −$764,296 | −16.17 |
| Random filter, same trade count | 31,421 | 35.8% | −$23.58 | −$740,911 | −15.35 |
| Random entries at market | 43,624 | 34.1% | −$26.27 | −$1,145,981 | −20.39 |
| Random entries, resting limit | 39,638 | 32.8% | −$31.17 | −$1,235,320 | −23.48 |
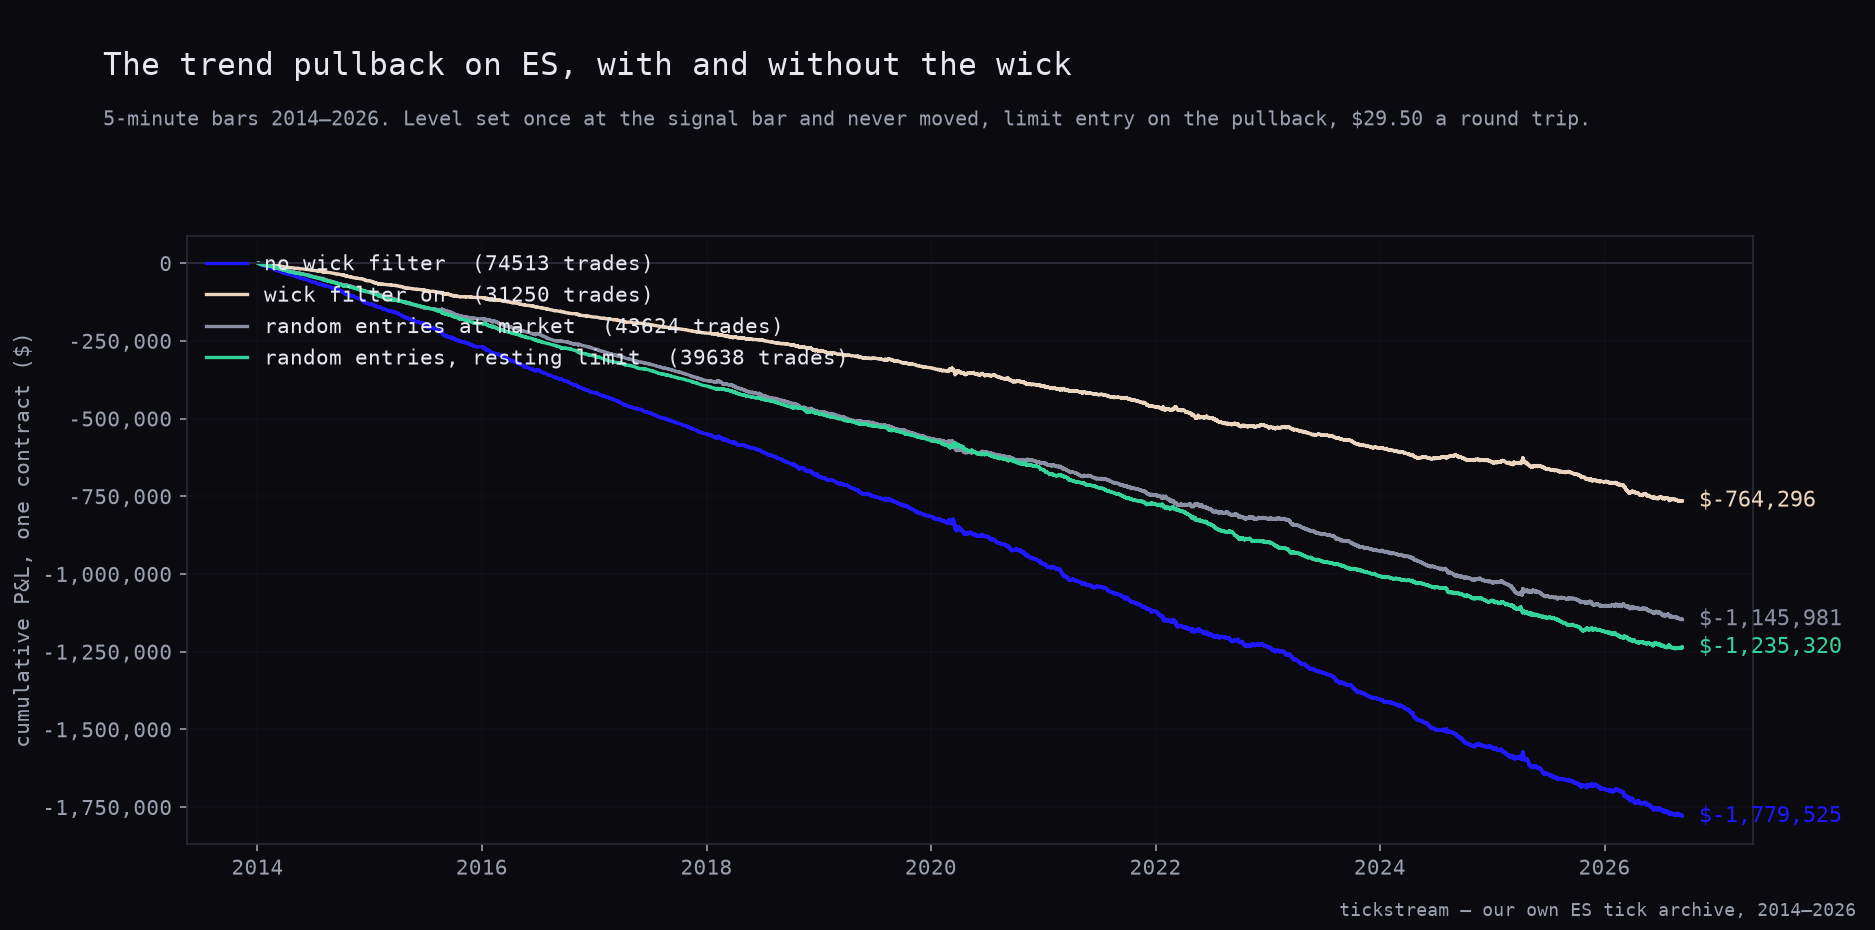
Four lines, four slopes, all down. The gold line ends highest at −$764,296, and it would be easy to read that as the wick filter helping. It is not. The filtered version loses $24.46 a trade and the unfiltered $23.88 — 58 cents apart. The gold line is higher because it takes 31,250 trades instead of 74,513, not because its trades are better.
That is the whole of what this article was originally about, and it dissolves. There is no filter question when the thing being filtered does not pay.
The random filter is the check that settles it: keep the same number of trades as the wick filter but pick them at random, and you get −$23.58, which is better than the wick’s −$24.46. Whatever the wick selects, it is not selecting trades that lose less.
Thirteen years, no exceptions
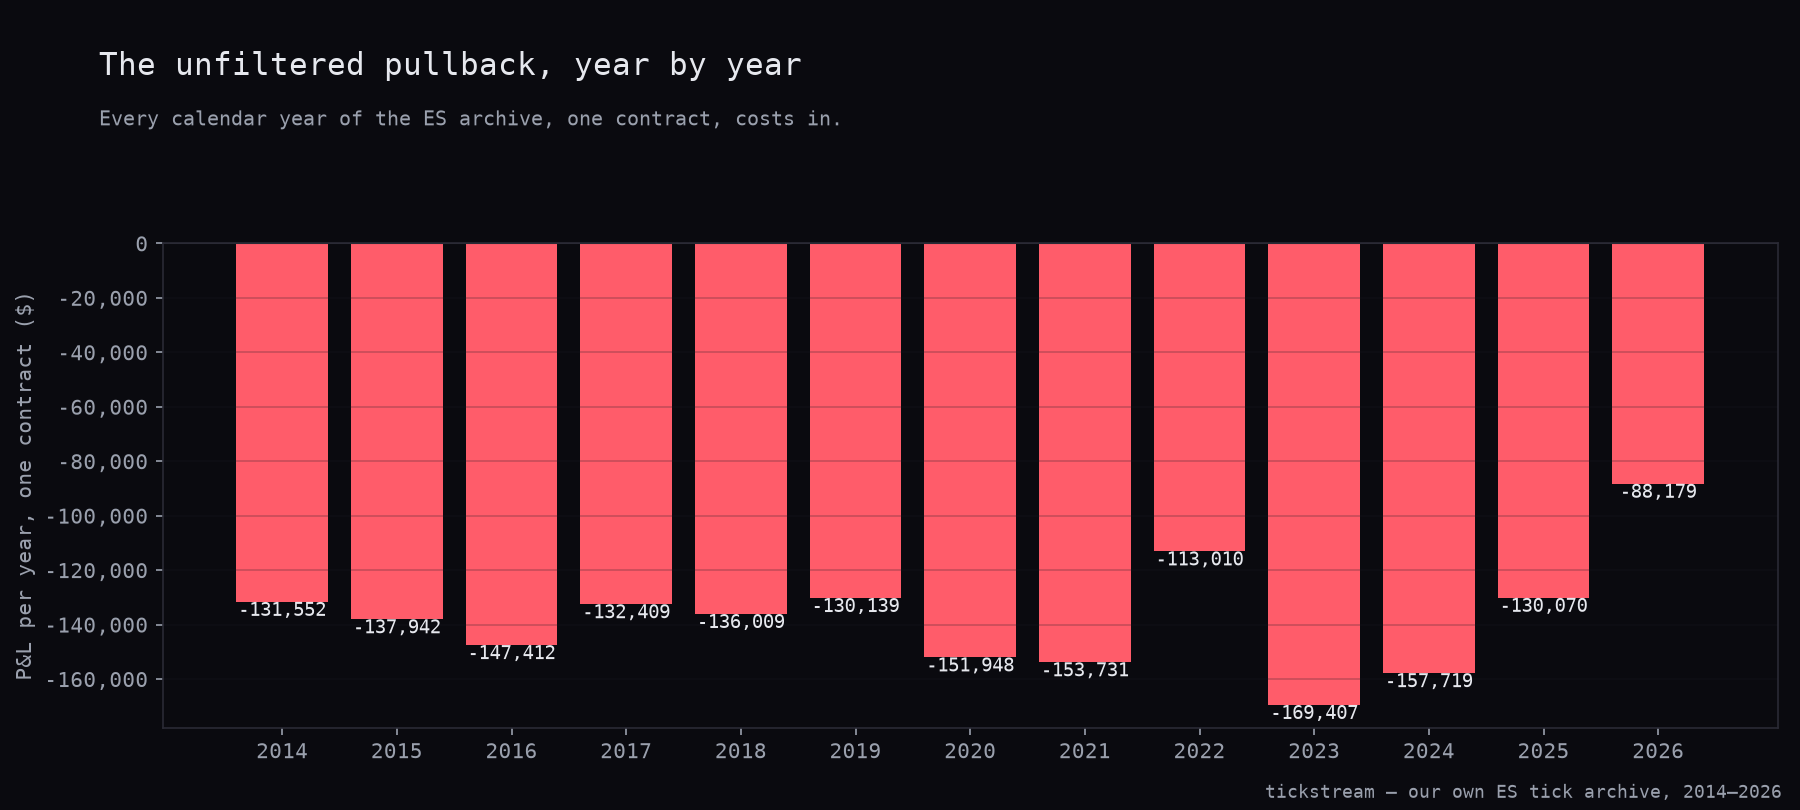
Every bar is below the line. The best year is 2026 at −$88,179 across 4,426 trades and the worst is 2023 at −$169,407. The broken version had four losing years at the start and nine green ones after, which is the shape of a regime story; the corrected version has no shape at all, just a constant drain of roughly $24 a trade.
The split says the same thing. Train 2014–2021 loses $24.51 a trade at t = −25.89; holdout 2022–2026 loses $22.88 at t = −10.93. Both halves, same number.
Per session day: −$461.02 across 3,860 trading days, daily Sharpe −5.98. The broken version’s daily Sharpe of 4.29 was the figure we were proudest of.
The variants, for completeness
None of the obvious rescues work, and we tried them before we found the bug, which is why we have them.
| Variant | Trades | Win rate | Per trade |
|---|---|---|---|
| Wick fraction 0.3 | 48,086 | 36.2% | −$23.00 |
| Wick fraction 0.7 | 6,422 | 34.1% | −$35.01 |
| Long only | 18,103 | 37.5% | −$20.43 |
| Short only | 13,625 | 34.3% | −$28.94 |
| Target 1 ATR | 35,798 | 48.6% | −$26.84 |
| Target 3 ATR | 28,164 | 27.8% | −$24.69 |
The target-1-ATR row is the one worth keeping. It wins 48.6% of the time, the best win rate in the table, and it loses more per trade than the 2-ATR version. Tightening a target buys win rate at the price of expectancy, every time, and a strategy sold on its win rate is usually a strategy sold on its exit geometry.
And the slippage ladder no longer has a rung to argue about: −$23.88 at zero ticks, −$36.38 at one, −$48.88 at two, −$61.38 at three.
Why our controls did not save us
This is the part we find least comfortable. The rule had a random-entry placebo, a passive-limit placebo, a train/holdout split and a cost ladder. It passed all of them.
It passed because the controls ran through the same fill engine. The passive-limit placebo rests a limit a quarter ATR into the dip and then scans forward for its fill in exactly the same way. It got the same favourable selection the real rule did. Comparing two numbers that share a defect tells you nothing about the defect.
A control tests the signal. It does not test the machinery that both the signal and the control run on. We did not have a check for that, and now we do.
How it was actually caught
Not by a placebo. By trying to write the live agent.
A related setup in this series — a fair value gap on the same archive — showed +$68.75 a trade. Before writing the sleeve we asked what a live state machine would do when a new level appears while an older one is still waiting. We built nineteen realisable answers: keep the waiting level or replace it, level lifetimes from one bar to a full session, all levels resting with first-touch-wins, and three minimum-distance filters.
All nineteen lost money, from −$8.49 to −$46.04 a trade.
That gap is the detector. A backtest number that no single-pass state machine can reach is not an execution problem to be solved later. It is a bug, and it is in the backtest.
What we changed
The fix is not a patch on this rule. It is one shared engine, and every test in the series that rests a limit now goes through it:
out, book, busy = [], [], -1
for i in range(start, n):
    if i <= busy: continue
    book = [L for L in book if i - L["born"] <= ttl]    # expire
    ready = [L for L in book if touched(i, L)]
    if ready:
        L = min(ready, key=lambda L: abs(L["px"] - open[i]))   # least favourable
        pnl, xi = bracket(i, L)
        out.append(pnl); busy, book = xi, []
        continue
    book.extend(propose(i))          # does THIS bar create a level?
Time only moves forward. Levels compete, and the first one touched takes the book. When one bar touches several, we fill the one nearest that bar’s open, because we cannot see the path inside a bar and should not assume a helpful one.
Two other results in this series were built on the old engine and both are now corrected and republished as kills. One live sleeve on our Nasdaq book uses this same rule shape and was already flagged for a related defect; it stays paper and is not being sized.
The rule we thought we had does not exist. What we have instead is a check we did not have before, and it cost about as much to learn as it was worth.
Methodology: ES continuous front-month, 868,567 five-minute bars resampled from our own trade prints, 2 January 2014 to 10 September 2026, all sessions. Trend from EMA-50 vs EMA-200 on the bar close. Level set once at the signal bar’s low (longs) or high (shorts), limit resting up to 24 bars, stop 1× ATR(14), target 2× ATR(14), 48-bar timeout. One position at a time; a fill bar that also reaches the stop is booked as a stop. Fills resolved chronologically across all resting levels, first touch takes the book, ties broken toward the level nearest the bar’s open. One contract, $4.50 commission plus two ticks of slippage per round trip, $29.50 on ES. Controls: random entries at market, and random entries with a resting limit a quarter ATR into the pullback, both through the same corrected engine. Split at 1 January 2022. The superseded figures quoted in this article come from the same script before the fill engine was replaced.
The fair value gap in our ICT battery was the second result this bug produced, and the RSI-2 rule is the one it could not touch, because that one enters at the close and never rests a limit at all.
Frequently asked questions
What was the bug?
For each signal we scanned forward to find when its limit filled, then blocked new signals until that trade's exit. A level found at one bar and filled forty bars later blocked a sibling level that would have filled two bars later, so the run kept the later fill and deleted the earlier one. Choosing between two resting limits that way needs the future.
How much did it change the result?
The pullback went from +$23.02 a trade and +$1,385,292 to −$23.88 a trade and −$1,779,525. The t-statistic went from +19.57 to −23.99. All thirteen calendar years are now negative, where the broken version had nine green.
Does the wick filter help or hurt?
Neither, once the fills are honest. The filtered version loses $24.46 a trade and the unfiltered $23.88, a difference of 58 cents. The filter's smaller total loss is only because it takes 31,250 trades instead of 74,513.
Why did the controls not catch it?
Because the controls had the same bug. Random entries with a resting limit were run through the same fill engine, so they got the same favourable selection. The error was in how every version resolved a fill, not in the signal being compared.
How was it eventually found?
By trying to write the live agent. Nineteen realisable state machines all lost money against a backtest claiming +$68.75 a trade on a related setup. A backtest number no single-pass state machine can reach is broken, not merely optimistic.