The One ES Strategy That Survived Our Own Series, Written Out in Full
Forty-six claims went through this series and most died. RSI-2 dip buying on ES is the one we could not break: 202 trades, +$250,678 on one contract, 20 of 20 parameter cells green in both halves of the window, and zero of 500 shuffled archives beating it. This article gives away the whole rule, the parameter grid, the controls, the micro-contract economics at $3.74 all-in, and the test that shows it cannot be compressed into a day session.
Most of what we tested in this series died. Of the two setups that looked strongest, both turned out to be the same bug in our own backtest, and we published that. This is the one we could not break: RSI-2 dip buying on the S&P 500 E-mini makes +$250,678 on one contract across 202 trades, and it survived every control we could build against it.
So we are giving it away. The whole rule, the parameter grid, the controls that could have killed it, the micro-contract economics, and the test that shows it does not work intraday. There is nothing held back for a paid tier, because the interesting part was never the rule — two-period RSI has been in print since Connors and Alvarez in 2008. The interesting part is what it takes to believe a backtest, and we now have an expensive example of what happens when you skip that.
The rule
- Compute a 2-period Wilder RSI on ES daily closes.
- When RSI-2 closes below 20, buy at that close. One contract.
- Exit at the close three sessions later. No stop, no target, no trailing.
- One position at a time. A signal arriving while a trade is open is skipped.
- Long only. The short side is tested below and it loses.
That is the entire strategy. It holds for three sessions, so it carries three overnights, and over a weekend that is five calendar days. It fires 26 times a year, roughly one trade every two weeks, and sits in the market 30.8% of the time.
What it did
Eight of eight years are green, on 202 trades, at a median move of 60.4 points.
| Year | Trades | P&L |
|---|---|---|
| 2019 | 20 | +$17,410 |
| 2020 | 20 | +$12,098 |
| 2021 | 21 | +$22,093 |
| 2022 | 40 | +$27,708 |
| 2023 | 27 | +$26,166 |
| 2024 | 27 | +$38,579 |
| 2025 | 27 | +$55,966 |
| 2026 | 20 | +$50,660 |
The chart below is the cumulative curve against buy and hold. What to look at is not the endpoint, where the two nearly meet, but 2022 and 2025: the dashed line is the index, and it gives back far more in both drawdowns than the strategy does. The strategy reaches almost the same place with less than a third of the exposure.

The gold line is the stricter version — RSI-2 below 10, held a single session — which is the rule our earlier Nasdaq study used. It makes +$166,840 on 191 trades at 9.7% exposure. It is the same animal, smaller.
The number that decides whether it is real
Twenty parameter cells, five thresholds by four hold periods, in both halves of the window. The split is 1 January 2023: 1,021 sessions before, 947 after.
Twenty of twenty are green in both halves. Over the full window the weakest of the twenty still makes $88,008.
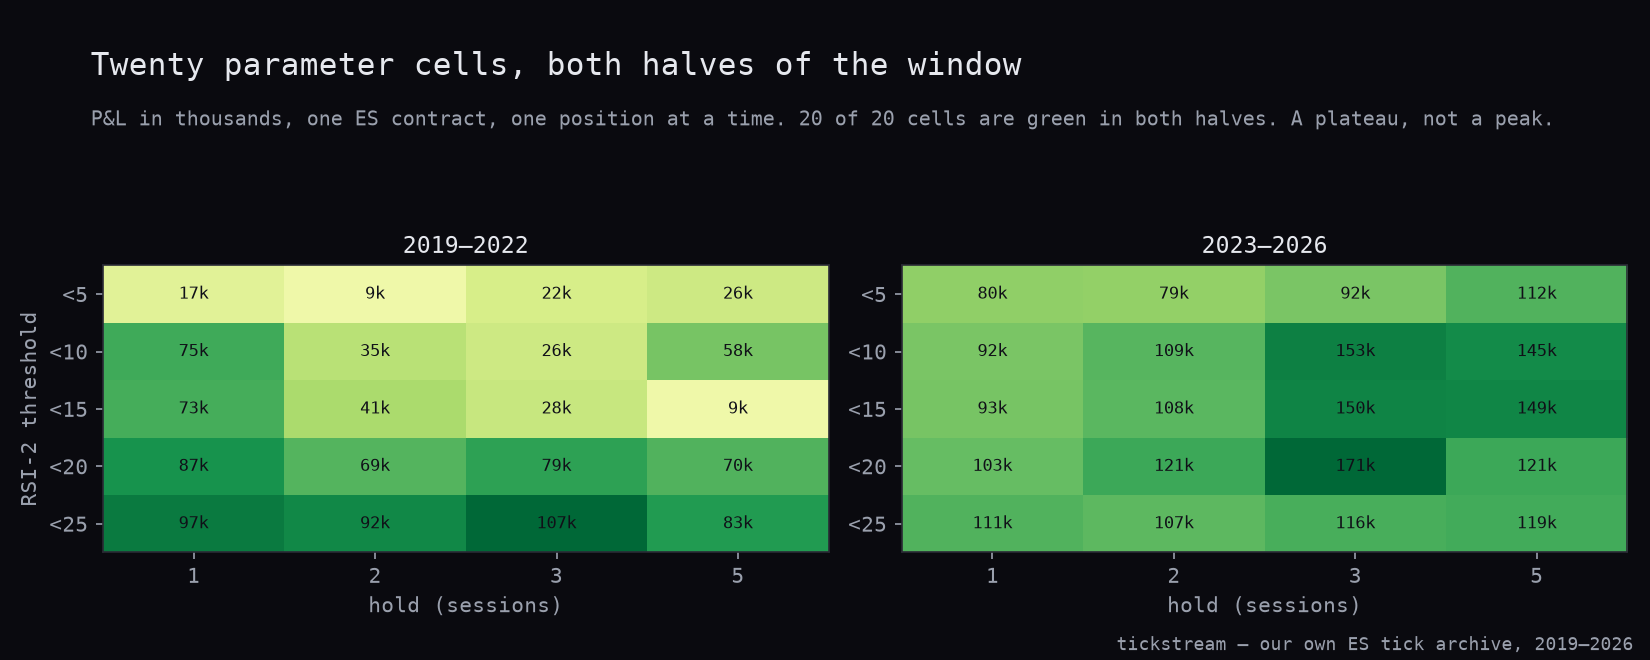
This is the difference between a plateau and a peak, and it is the check most published backtests skip. A fitted parameter set is a single bright cell surrounded by losses; move one step in any direction and it collapses. Here every direction still pays. Loosening the threshold adds trades and lowers the per-trade edge; extending the hold does the reverse. The surface tilts, but nowhere does it fall through zero.
Look closely and the two panels disagree about which cell is best. The training half likes RSI-2 below 25 held three sessions; the holdout likes below 20 held three. That disagreement is the honest cost of choosing, and we price it below.
The controls
Two ways to be wrong here. The rule might be capturing nothing but the index’s tendency to go up, or the result might be an accident of one particular price path.
Shuffled archives. We took the daily log returns, permuted them 500 times, and rebuilt a price path from each. Every shuffled archive has the same distribution of daily moves and the same drift as the real one. The only thing destroyed is the order. Then we ran the identical rule on each.
Exposure-matched random entries. We took the same number of entries and the same hold period, placed on random days, 500 times. This one holds exposure to drift exactly constant: same days in the market, same contract, no signal.
| RSI-2 < 10, hold 1 | RSI-2 < 20, hold 3 | |
|---|---|---|
| The real archive | +$166,840 | +$250,678 |
| Shuffled, median | +$24,758 | +$78,233 |
| Shuffled, 95th percentile | +$90,165 | +$175,724 |
| Shuffled paths that beat us | 0 of 500 | 0 of 500 |
| Random entries, median | +$16,359 | +$64,406 |
| Random entries, 95th percentile | +$63,674 | +$135,423 |
| Random entries that beat us | 0 of 500 | 0 of 500 |
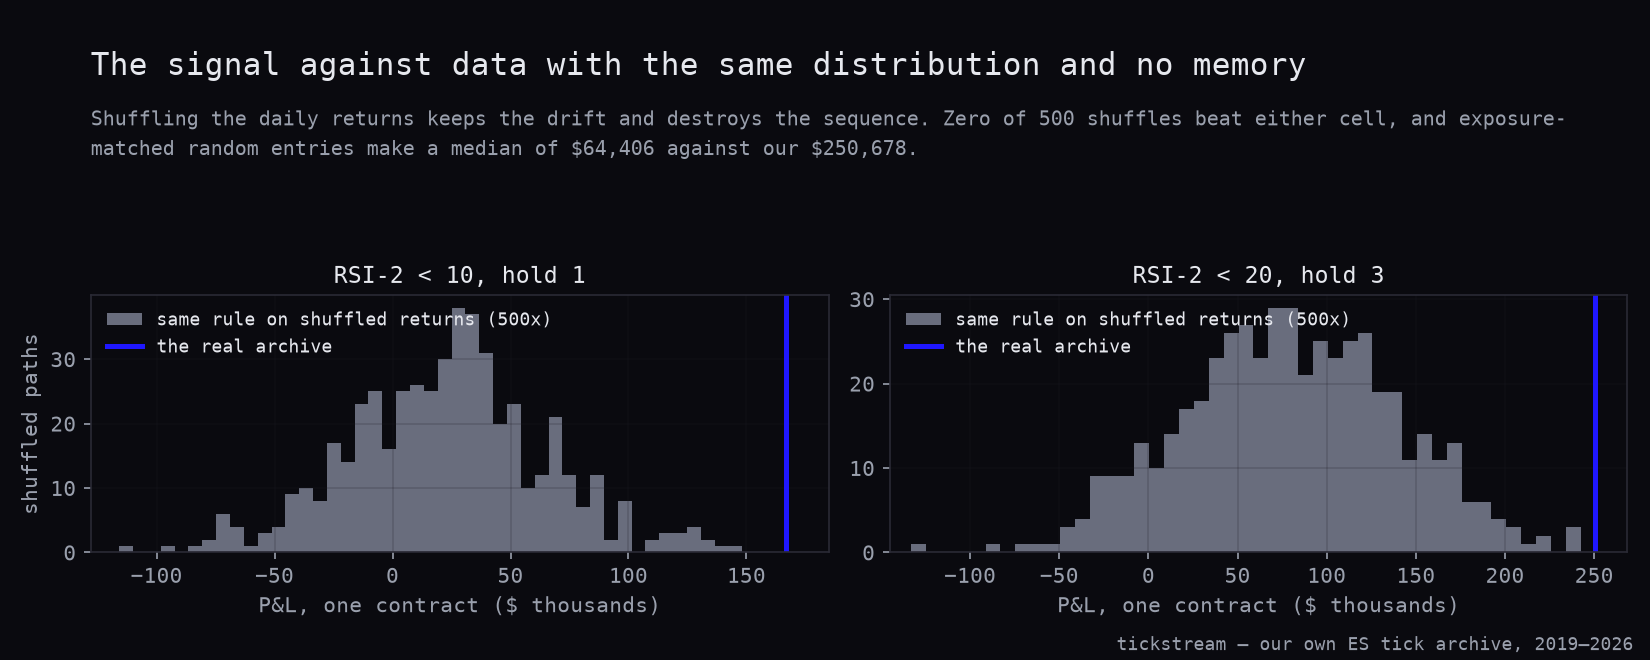
The blue line sits outside the entire shuffled distribution in both panels. Against random entries with identical exposure the real rule makes almost four times the median. Whatever this is, it is not the drift.
What we paid for searching
We looked at twenty cells and reported the best one. That deserves a penalty, and here is its size. We ran the entire twenty-cell search on 300 shuffled archives and kept the best cell each time — because a best cell always exists, even in noise.
| Best real cell | +$250,678 |
| Best cell on shuffled data, median | +$148,755 |
| Best cell on shuffled data, 95th percentile | +$241,900 |
| Best cell on shuffled data, 99th percentile | +$284,483 |
| Shuffled searches that beat us | 4.0% |
Read that carefully, because it is the most useful number in this article. Searching twenty cells on data with no edge at all produces $148,755 at the median and $284,483 at the 99th percentile. If someone shows you a $300,000 backtest over seven years on the S&P and they tried twenty parameter combinations to find it, they have shown you nothing.
Our best cell clears that bar at p = 0.04, which is real but thin. The single-cell tests above are much stronger, and the plateau is stronger still. But the honest way to state the headline is not $250,678.
A walk-forward would have picked a different cell. Choosing only on 2019–2022, you would have taken RSI-2 below 25 held three sessions, which made $106,597 in training and then $116,345 in the holdout. Combined, that is $222,942 — not $250,678. The $27,737 difference is hindsight, and we would plan on the lower number.
The micro contract
One MES is exactly one tenth of one ES in point value, $5 against $50. The costs do not scale down with it, so we ran the commission across a range rather than assuming one.
| Commission, round turn | All-in with 2 ticks | P&L | Max drawdown | P&L / DD | Per year |
|---|---|---|---|---|---|
| $0.50 | $3.00 | $25,058 | $2,643 | 9.48 | $3,254 |
| $1.00 | $3.50 | $24,957 | $2,644 | 9.44 | $3,241 |
| $1.24 | $3.74 | $24,908 | $2,645 | 9.42 | $3,235 |
| $2.00 | $4.50 | $24,755 | $2,647 | 9.35 | $3,215 |
| $3.00 | $5.50 | $24,553 | $2,650 | 9.26 | $3,189 |
Six times the commission costs $505 across all 202 trades. That is the useful finding. The median trade moves 60.4 points, which is $302 on a micro, so two extra dollars of fees is under one percent of it. Almost everything else we tested this year died at two ticks of slippage. This does not notice them.
The ratio also survives the shrink almost untouched: P&L over drawdown is 9.42 on MES against 9.49 on ES. The micro is a genuine proportional version, not a compromised one.
What you have to sit through
The exit is the calendar, not the risk. There is no stop in this rule, which means the worst trade is simply whatever the market did in three sessions.
| ES, one contract | MES at $3.74 | |
|---|---|---|
| Win rate | 63.4% | 63.4% |
| Median trade | +$1,552 | +$154 |
| Best trade | +$18,621 | +$1,861 |
| Worst trade | −$20,967 | −$2,097 |
| Max drawdown | $26,426 | $2,645 |
| Losses over $5,000 / $500 | 14 | 14 |
| Losses over $10,000 / $1,000 | 4 | 4 |
The $250,678 assumes you hold a $20,967 loser to its scheduled exit without intervening. That single trade is larger than the whole of 2020. On the micro it is $2,097, which is why the position size question is answered by the worst trade and not by the margin.
One more concentration check, because 202 trades is not many. Removing the single best trade leaves $232,058. Removing the best three leaves $198,067. The top five trades are 31.3% of the result. The strategy is not standing on a handful of outliers, which is more than we could say for several things we killed this year.
It does not work intraday
The obvious next question is whether the same logic can be compressed into a day session, and the answer is a clean no. We ran RSI-2 on 5, 15, 30 and 60-minute bars, RTH only, flat at the cash close, one position at a time. Twenty-five cells per timeframe, 100 in total.
| Timeframe | Positive cells | Best cell | Gross points per trade |
|---|---|---|---|
| 5 min | 0 of 25 | −$165,221 | −0.19 |
| 15 min | 0 of 25 | −$37,420 | 0.39 |
| 30 min | 0 of 25 | −$3,904 | 0.51 |
| 60 min | 6 of 25 | +$27,295 | 1.29 |
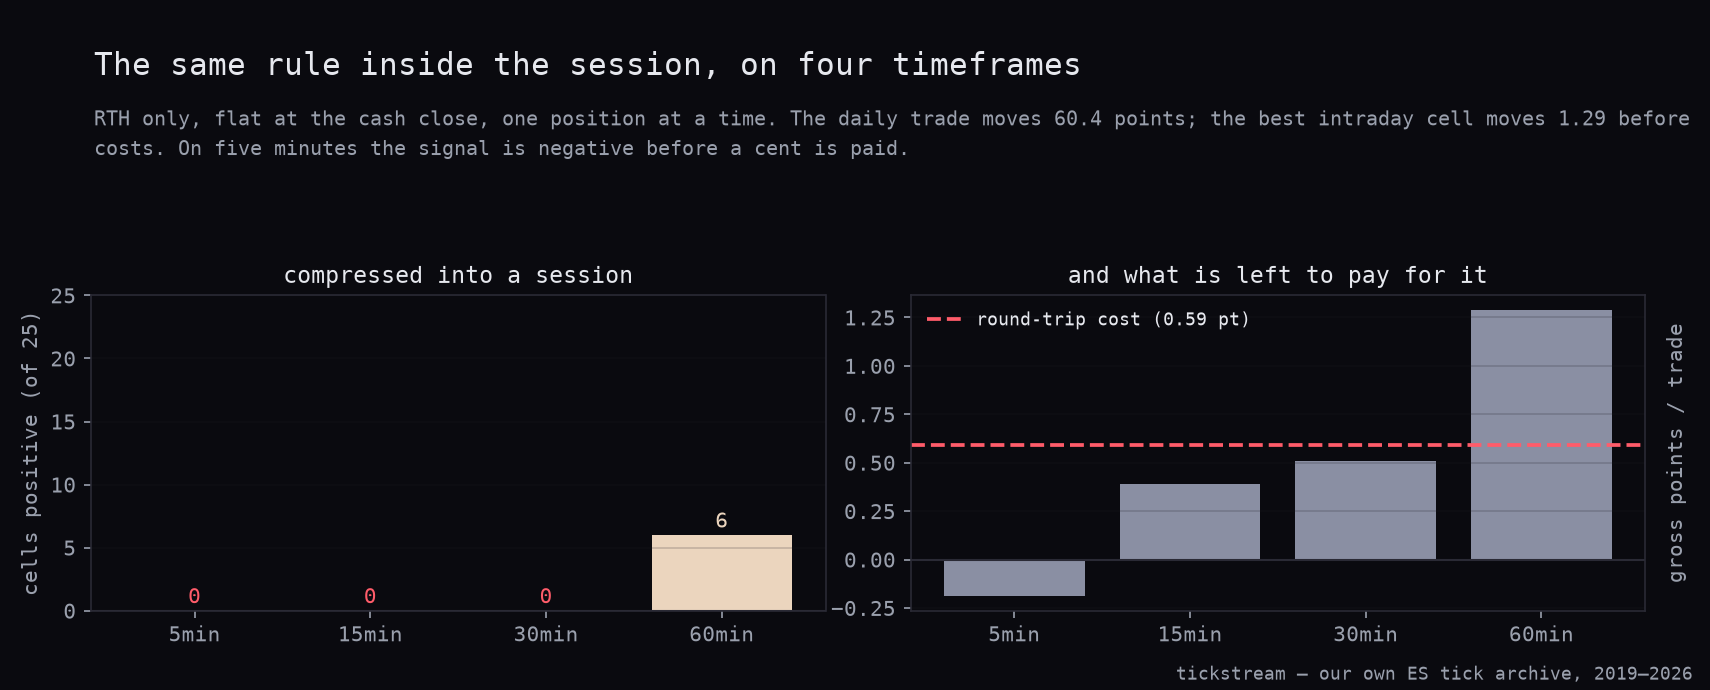
On five-minute bars the signal is negative before a single cent of cost. That is not a thin-margin setup, it is an absence of one. The gradient runs the right way for the explanation: the shorter the timeframe, the deader it gets, and the only thing showing life is the hour bar, which is the timeframe closest to a daily hold.
That last one fails both tests anyway. All six of its positive cells lose money in the first half of the window and only pay from 2023, so none is green in both halves. And against the search control, 87.5% of shuffled archives beat the best of the hundred cells — the median shuffled search finds $83,167 where our real data gives $27,295. We are below the noise.
The daily trade needs 60.4 points to work with and keeps about 25 after costs. The best intraday cell has 1.29 points gross against 0.59 points of cost. The multi-day hold is not a detail of the rule, it is the edge.
What we changed in our own book
Nothing yet, and that is deliberate. RSI-2 already runs as a Nasdaq sleeve, so extending it to ES means the same signal on two correlated indices, which is more contracts rather than more diversification. The table below is the case against doing it.
| Trades | P&L | Max drawdown | P&L / DD | |
|---|---|---|---|---|
| ES alone | 202 | $250,678 | $26,426 | 9.49 |
| NQ alone | 191 | $249,876 | $43,622 | 5.73 |
| Both | 393 | $500,554 | $59,304 | 8.44 |
The combination doubles the money and more than doubles the drawdown. Daily P&L correlation between the two sleeves is 0.51, and 65.4% of the smaller book’s entry days are shared with the larger one. It is largely the same bet twice. We would rather size one market properly than run two and call it diversification. (Our Nasdaq daily store ends 27 February 2026, so the NQ column covers about six months less than the ES one.)
The short side does not exist. On this same window, RSI-2 above 90 held one session makes −$78,271 across 374 trades, and above 95 makes −$28,815. Mean reversion on the S&P pays on the downside only.
The 200-day moving-average filter that improved the Nasdaq version does not earn its keep here either. Applied to this cell it makes $147,537 on 128 trades, against $250,678 unfiltered on 202. It removes 74 trades and $103,142 with them. That filter is Nasdaq-specific trimming, not a principle.
If you want to trade this, the honest expectation is around $222,942 over 7.7 years on one ES contract, or about $3,235 a year on one MES, with a drawdown you will eventually see and a single trade that can cost more than a good year. That is what the archive says. We have not hidden the parts that make it less attractive, because those are the parts that make the rest believable.
Methodology: ES continuous front-month daily closes from our own tick archive, 1,968 sessions from 2 January 2019 to 10 September 2026. RSI is 2-period Wilder smoothing on closes. Entry at the signal close, exit at the close N sessions later, no stop, one position at a time, a signal during an open position is skipped. One contract, $4.50 commission plus two ticks of slippage per round trip, which is $29.50 on ES and $3.74 on MES at $1.24 commission. Controls: 500 shuffled return paths, and 500 exposure-matched random entry sets with the same trade count and hold. The search control re-runs the full twenty-cell grid on 300 shuffled paths and keeps the best cell from each. The split is 1 January 2023. Intraday runs use RTH bars only, flat at the cash close, 25 cells per timeframe across four timeframes. Every figure here is generated by the same script that writes our results file.
The original Nasdaq run of this rule is where the 200-day filter earns its place, and our first ES pass over twelve and a half years covers the five extra years this article’s window leaves out.
Frequently asked questions
What exactly is the RSI-2 rule on ES?
Compute a 2-period Wilder RSI on daily closes. When it closes below 20, buy the close. Exit at the close three sessions later, no stop and no target. On our archive that is 202 trades between 2019 and 2026, 63.4% of them winners, +$250,678 on one contract.
Is this result just a fitted parameter set?
We ran 20 threshold and hold combinations and all 20 are positive in both halves of the window, split at 1 January 2023. The worst cell still makes $88,008. A fitted result is a peak surrounded by losses; this is a plateau.
How do you know it is not simply capturing the index drift?
We ran 500 random entry sets with the same trade count and the same hold, so the exposure to drift is identical. Their median is $64,406 against our $250,678, and not one of the 500 beat us. Buy and hold over the same window makes $254,712 at 100% exposure against our 30.8%.
Does it work on the micro contract?
Yes, and almost proportionally: $24,908 on one MES at $3.74 all-in per round turn, against $250,678 on ES. P&L over drawdown is 9.42 on MES versus 9.49 on ES. Raising the commission six times over only costs $505 across all 202 trades.
Can the rule be traded intraday?
No. We tested it on 5, 15, 30 and 60-minute bars, 100 cells in total, and only six were positive. Every one of those six loses money in the first half of the window, and 87.5% of shuffled archives beat the best of them.