Historical options data
Twelve years of options chains, probed rather than promised
Every number on this page came from querying the archive on 2026-08-28, not from a product sheet. Where a probe returned nothing, it says so.
How far back it actually goes
Catalogues tend to quote a start year. We went looking for the first day that answers. Probing SPY chains backwards: 2013-01, 2013-06, 2014-01 and 2014-03 return 404. 2014-09-02 returns 206 contracts in a single expiry series, and every year after it answers. So the honest boundary is September 2014 — twelve consecutive years to today.
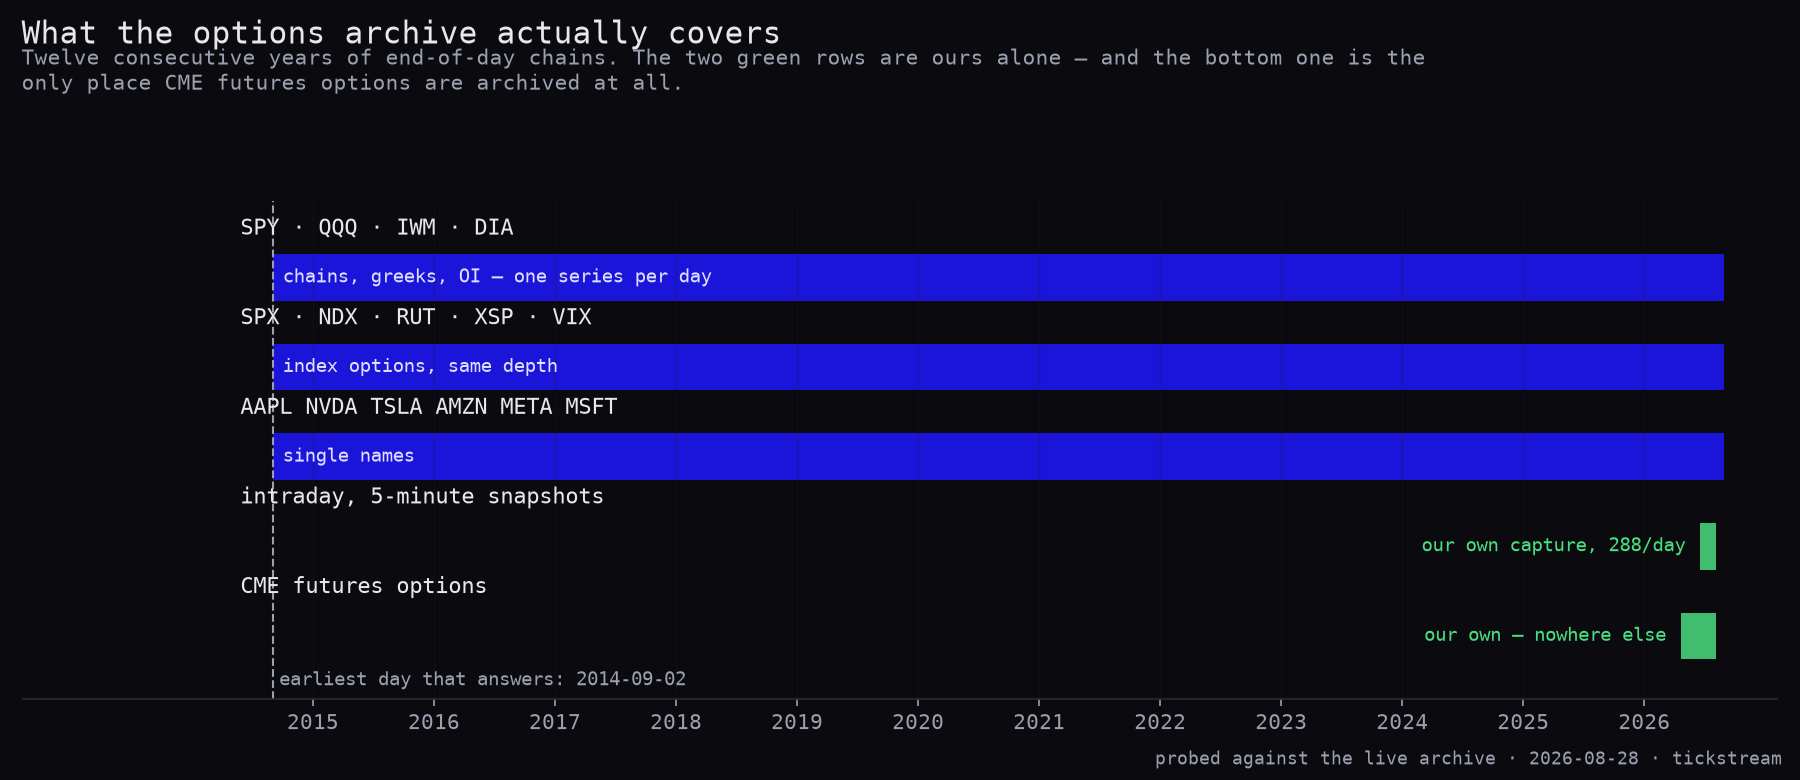
The blue rows are the twelve-year archive: US index and equity options — the big ETFs (SPY, QQQ, IWM, DIA), the cash indices (SPX, NDX, RUT, XSP, VIX) and the large single names. The two green rows are ours alone, and much shorter: five-minute intraday snapshots we capture ourselves, and CME futures options, which are not in any third-party options archive at any tier.
How deep one expiry goes
Depth matters more than start date. An archive that reaches 2014 but carries forty strikes is a different product from one that carries four hundred. One June expiry of SPY, one strike ladder, queried once per year:
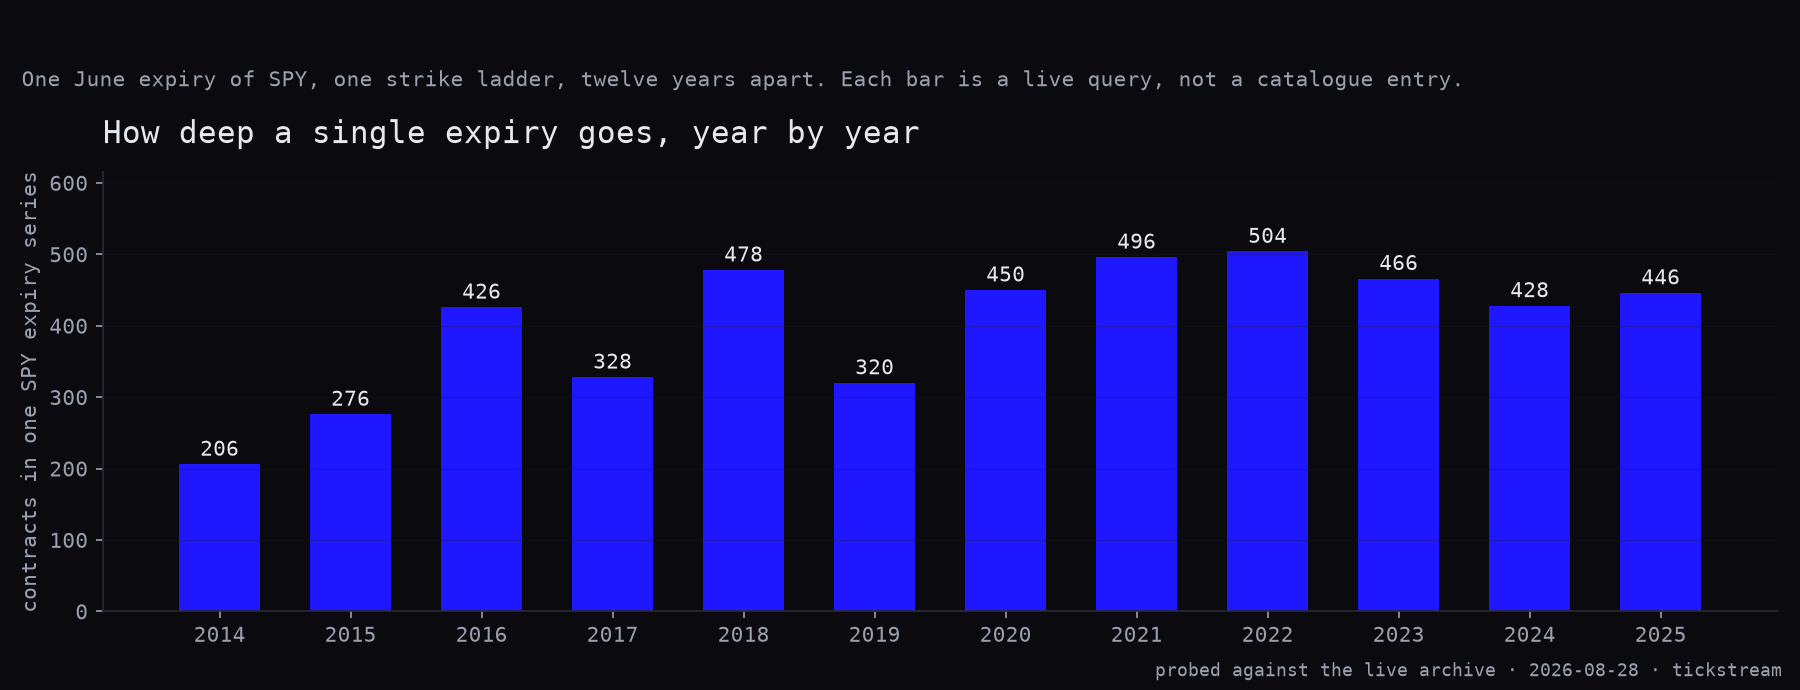
Between 206 and 504 contracts in a single expiry series, rising as the strike grids widened over the decade. The variation between years is real — it follows how many strikes were listed around spot at that moment, not a gap in the data.
What each row carries
Per contract, per day, the archive returns the full quote rather than a single price:
bid·ask— andbid_size·ask_size, so you can weight by resting size instead of assuming the midbid_exchange·ask_exchange— which venue posted itbid_condition·ask_condition— the quote condition codes, which is how you exclude a quote that was not firmopen·high·low·close·volume·countoi— open interest, andiv,delta,gamma,theta,vegalast_tradeandcreated— two separate timestamps
That last line is the one worth pausing on, because it is the difference between a clean backtest and a subtly broken one. The moment a row was written and the moment it last traded are not the same moment, and on an illiquid contract they can be hours apart. A dataset that gives you one timestamp is not simpler — it is hiding which of the two you are holding. If you are pairing greeks against a price, you need to know whether that price is from this minute or from Tuesday.
How to tell a usable options archive from a free one
Five checks, in the order that catches the most problems soonest:
- Probe the claimed start date. Not the catalogue — the API. Ours answers from 2014-09-02 and 404s before it, and now you know because we ran it.
- Count contracts in one expiry. A thin ladder is the most common quiet defect: the archive technically covers the date, and the strikes you need are missing.
- Look for size next to price. A bid with no
bid_sizecannot be distinguished from a bid nobody would fill. - Ask how many timestamps there are. One is a warning. It means quote age is unknowable.
- Check whether open interest is aligned to the right session. OI is published the next morning for the previous close. An archive that files it under the wrong day shifts every opening-versus-closing inference by one session.
What it cannot do
These limits are not ours specifically — they are properties of the consolidated tape, and any vendor claiming otherwise is selling an inference as a field.
There is no participant identity. OPRA carries no field naming a firm, a desk or a customer type. Every "institutions were buying" headline is a classification built on condition codes and size, ours included — we publish the measured error of our own version next to it rather than presenting it as observation.
There is no order book. Options quotes are top of book. Resting depth and queue position do not exist in this data at any price. If you need that on futures, market-by-order is a different product.
Open interest lags by a session. It is published the following morning. Opening versus closing is therefore an inference from an OI change, and it is a good one — but it is arithmetic, not a reported field.
And one finding of our own, since it decides whether this data is worth buying at all: across roughly two hundred strategy tests we have published, options data has repeatedly carried a real edge where order flow carried none — the put/call contrarian signal survives costs and out-of-sample testing, while twelve order-flow indicators did not. We would rather tell you which half of our own catalogue tested well.
Access
The archive is sold in three tiers — end-of-day chains, tick-level trades and quotes, and the pre-joined variants — priced on the options data page. The same key reads the REST endpoints documented there, and the free GEX levels page runs on this data if you want to see it working before paying for anything.
FAQ
How far back does the historical options data go?
The earliest day that returns a chain is 2014-09-02, verified by query on 2026-08-28: probes at 2013-01, 2013-06, 2014-01 and 2014-03 answer 404, and 2014-09 onward answer with data. That is twelve consecutive years of end-of-day chains with greeks and open interest for US index and equity options.
What resolution is the historical options data?
End-of-day chains for the full twelve years — every listed strike and expiry with bid, ask, sizes, exchange and condition codes, open interest, volume, implied vol and the greeks. Tick-level trades and quotes are available on the higher packages. Five-minute intraday snapshots exist for the recent period from our own capture.
Can I compute historical implied volatility surfaces from it?
Yes — that is the most common use. Each contract carries its own implied vol and greeks per day, so a surface is a group-by rather than a solve. If you would rather solve it yourself, the raw bid, ask and their sizes are all present.
What can historical options data NOT tell you?
Three things, and every vendor's data shares these limits. It carries no participant identity, so 'institutions bought' is a label, not a field. It carries no order book, so you cannot see resting depth or queue position. And open interest is published the following morning, so opening-versus-closing is inferred from an OI change, not read off the print.