CME Market-by-Order (Level 3) Explained — With a Real Book, Rebuilt
Level 3 market data is every individual order, not the level total. We rebuilt one real NQ book from our own MBO recording: 21,514,312 order events in a day against 501,736 trades, 320 MB against 2.2 MB for L1, and the reconstruction bug that crosses your book if you trust the deletes.
Level 2 tells you there are seven contracts resting at 29,565.25.
Level 3 tells you those seven are seven separate orders — #19048, #19049, #19312, #19314, #19323, #19342, #19345 — each one contract, in the order they arrived. The total is the same number. Everything interesting is in the difference.
This article is about that difference: what market-by-order actually contains, what a day of it costs, how to rebuild a book from it, and the specific way that rebuild goes wrong. Every number below is measured on our own recording of NQ on 2026-08-27, not quoted from a vendor sheet.
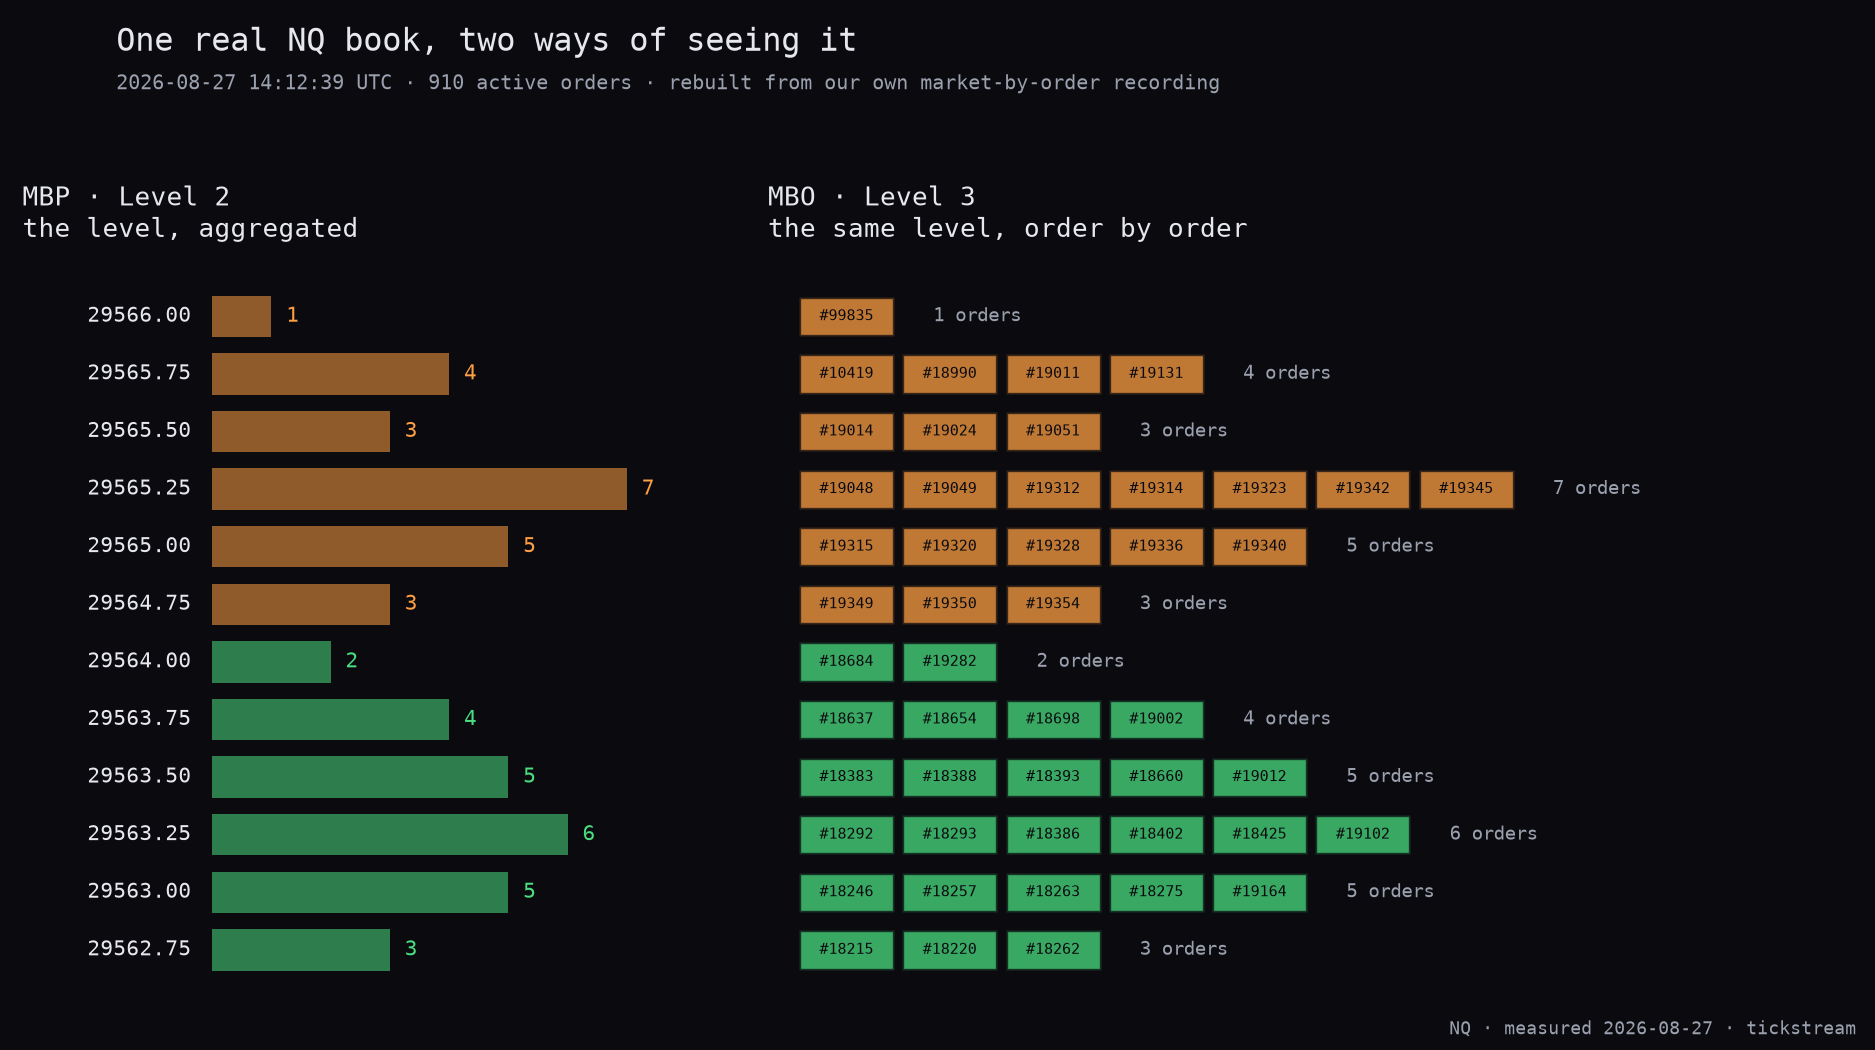
MBO against MBP, on one real book
The book above is real. It was reconstructed from our own market-by-order recording at 14:12:39 UTC, when 910 orders were resting.
Read the two halves against each other:
- Left (MBP, Level 2). Six price levels each side, each a single number. 29,565.25 has 7. That is the entire content.
- Right (MBO, Level 3). The same 7, decomposed into seven order ids in queue sequence. Join the queue now and you are eighth.
One detail jumps out of the right-hand side and it is not decoration: almost every order is one contract. The 7 at 29,565.25 is not one trader with seven lots, it is seven traders — or seven algorithms — with one each. Level 2 cannot tell those two situations apart, and they behave completely differently when price arrives.
Best bid was 29,564.00 against a best ask of 29,564.75. Three ticks.
A day, order by order
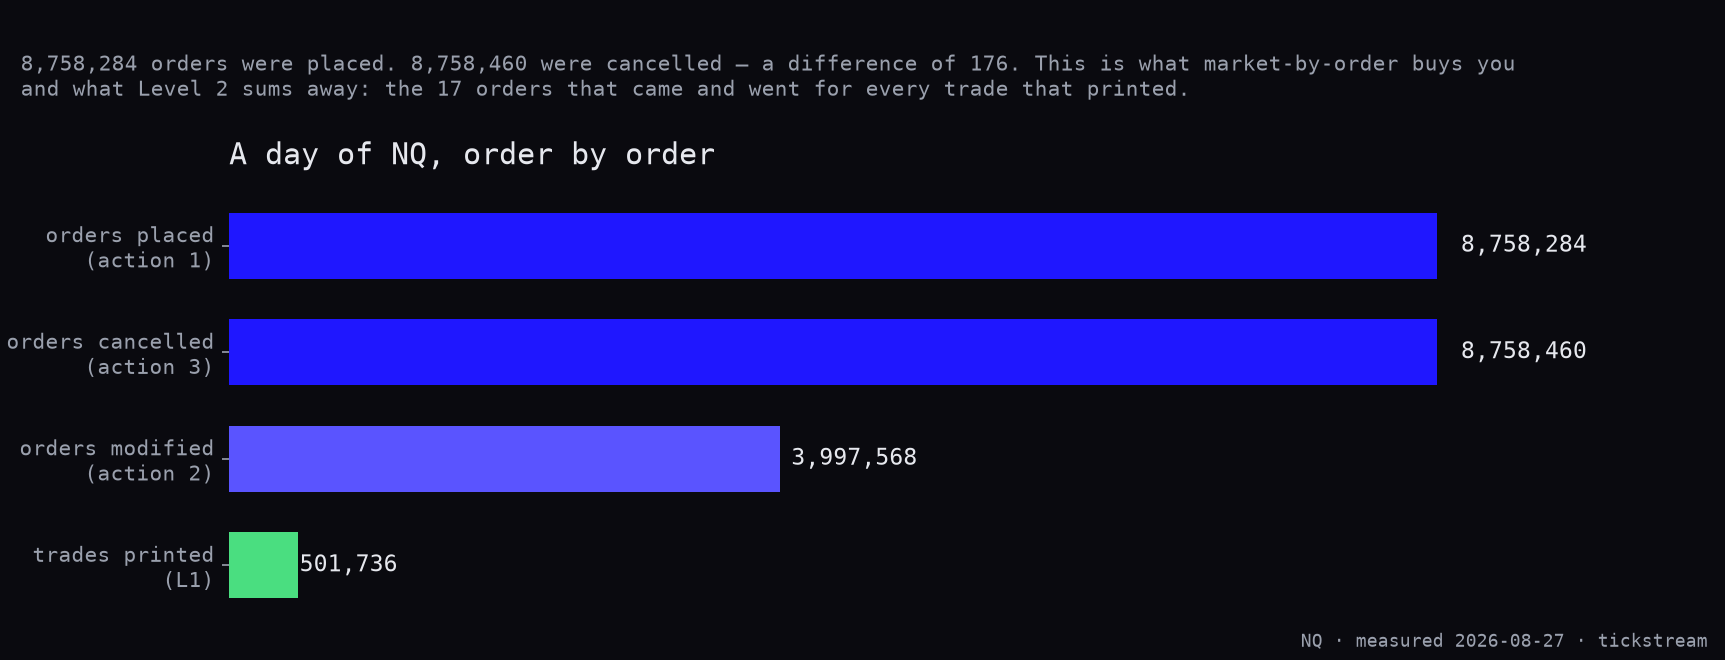
NQ on 2026-08-27, from the same recording:
orders placed (action 1) ....  8,758,284
orders cancelled (action 3) .  8,758,460
orders modified (action 2) ..  3,997,568
                              ───────────
order events, total .........  21,514,312

trades printed (L1) .........    501,736
Two things are worth sitting with.
Adds and cancels differ by 176. Out of 8.76 million. Essentially every order placed on NQ that day was also pulled. That is not a market failing — it is what a modern order book is, and it is invisible at Level 2, where all of it nets into a level total that ticks up and down.
There were 43 order events for every trade. 21.5 million events produced half a million prints. The other 98% is the part of the market that changed its mind. Across 8,761,030 distinct order ids, each order generated 2.46 events on average: arrive, perhaps adjust, leave.
What it costs
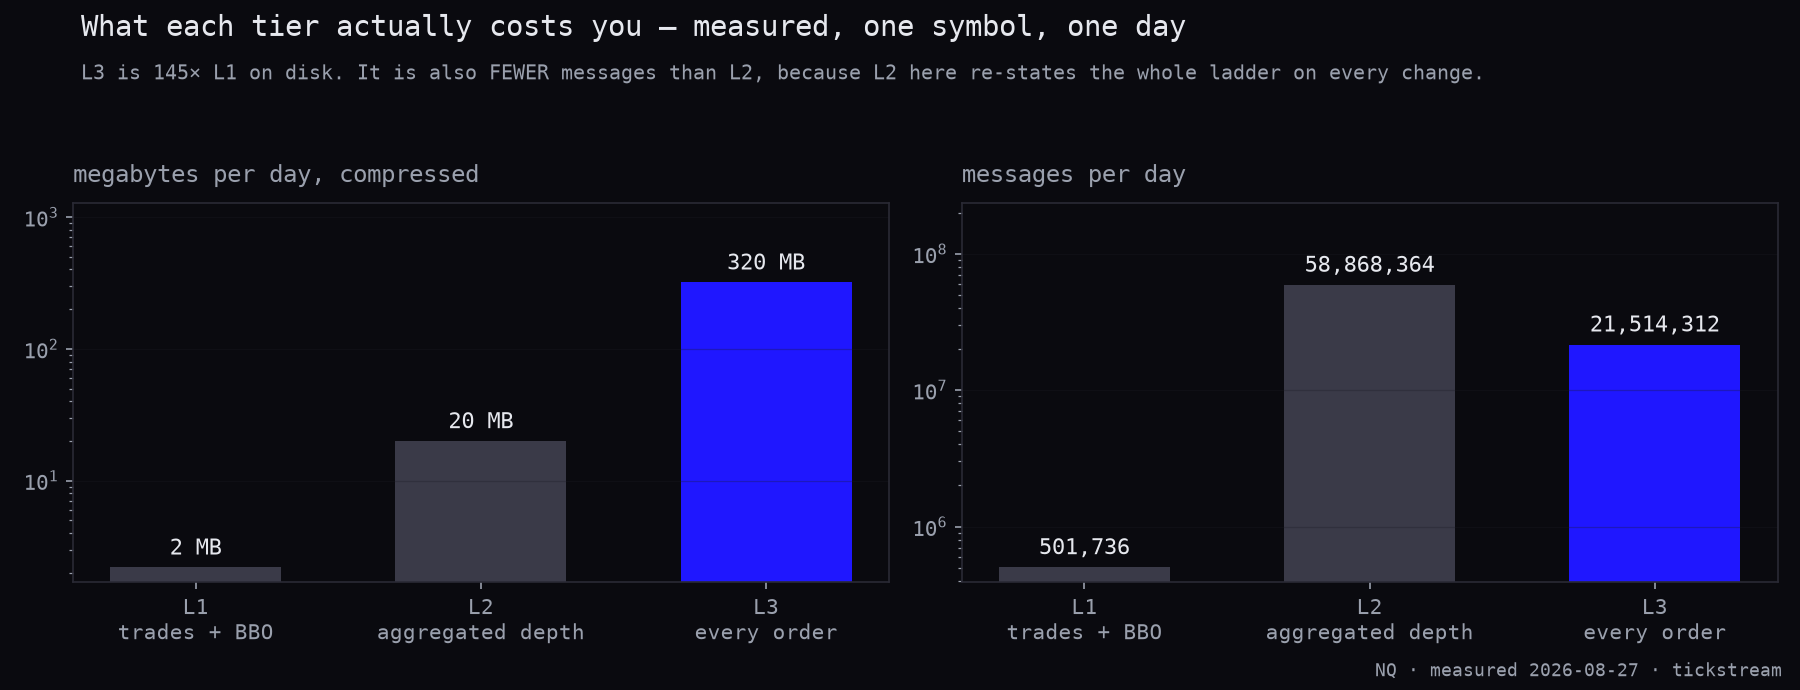
One symbol, one trading day, compressed parquet, measured across five full sessions in August 2026:
| Tier | What it is | Per day | Messages |
|---|---|---|---|
| L1 | trades + best bid/offer | 2.2 MB | 501,736 |
| L2 | aggregated depth | 20 MB | 58,868,364 |
| L3 | every order | 320 MB | 21,514,312 |
L3 is 145× L1 on disk. Seven years of it, for one symbol, is roughly 570 GB before you have touched a second contract.
The row that surprises people is the middle one: L2 carries more messages than L3 while occupying 16× less space. That is a property of how depth is stored, not of the exchange — our L2 store re-states the whole visible ladder whenever anything in it changes, so one order arriving writes many rows of a few narrow columns. MBO writes one row per event, but each row carries an order id, a sequence number and a queue priority. Different shapes, different bills.
Rebuilding the book — and the bug that crosses it
The reconstruction is simple enough to describe in three lines: on New, insert the order; on Change, update it; on Delete, remove it. Ours is thirty lines of Rust and it is not the hard part.
Here is the hard part, and we hit it building this article.
Replaying the full day naively and stopping at midday gives a book with 3,576 resting orders — and a best bid of 29,601.75 against a best ask of 29,495.50. The book is crossed by more than a hundred points, which is impossible.
The reason is that not every order that leaves the book is announced with a delete. Cancels are — that is the 8,758,460 above. Fills are not. So every order that traded stays in a naive replay forever, and the corpses pile up on both sides until the top of book is nonsense.
The measurement makes it obvious once you look:
| Restriction | Resting orders | Best bid | Best ask | |
|---|---|---|---|---|
| everything | 3,576 | 29,601.75 | 29,495.50 | crossed |
| younger than 60 min | 2,489 | 29,564.00 | 29,439.00 | crossed |
| younger than 10 min | 1,893 | 29,564.00 | 29,514.75 | crossed |
| younger than 2 min | 910 | 29,564.00 | 29,564.75 | clean |
Median resting time on that book is 8.5 minutes, and 30.4% of the naive reconstruction was older than an hour. Those are the corpses.
A production feed handler solves this by also consuming the trade messages and reconciling against the exchange’s periodic snapshot. If you are building one: the symptom is a slowly crossing book that looks fine for the first minutes and degrades over hours, which is exactly the failure that survives a short test and dies in production.
Sequence numbers are not a loss detector
The obvious integrity check is to watch the sequence number and treat a gap as a dropped message. On CME data that check needs care, and here is why, measured on the same day:
| Events | Sequence span | Density | |
|---|---|---|---|
| ES | 9,387,797 | 9,509,335 | 98.7% |
| NQ | 21,514,312 | 99,577,542 | 21.6% |
The two instruments share no sequence numbers at all — the space is per instrument, not per feed. But ES arrives essentially dense while NQ uses about a fifth of its range.
That sparseness is not loss. If we were dropping four messages in five, adds and cancels could not possibly agree to 176 in 8.76 million; random loss would destroy that balance immediately. The numbering is simply not dense on every instrument.
The practical consequence: a naive “gap ⇒ dropped message” alarm is silent on ES and screams continuously on NQ, and both readings are wrong. Detect loss from the exchange’s own gap-fill mechanism, not from arithmetic on the sequence.
Price precision
cme price precision is a search term because it is where implementations quietly break. CME transmits prices as scaled integers, not decimals. NQ trades in quarter points; the wire carries an integer and a decimal exponent, and the conversion belongs in exactly one place.
The failure mode is not a crash. It is a book where 29,564.75 and 29,564.7500001 are two different price levels, each holding part of the real size, and every aggregate you compute from it is quietly wrong. We key levels on an integer derived from the raw price and convert once at the edge — never mid-book, never in a comparison.
When you should not buy this
We sell Level 3. We would still rather you did not buy it by mistake.
MBO’s unique information is queue position. Everything else it carries — price, size, imbalance, where liquidity rests — is already in Level 2 for a sixteenth of the storage. Queue position pays for exactly one business: quoting the spread, where your position in line is your inventory. That business needs co-location, exchange memberships, microwave links and a full-time engineering team.
Without that latency, queue position is accurate and unusable. By the time a retail stack has parsed the message and decided, the queue it describes is gone.
Our own research says the same from another direction. Across roughly two hundred strategy tests we have published, order-flow information has never predicted direction — and where it does carry a real short-horizon signal, that signal lives inside the spread, which makes it the market maker’s, not the taker’s. MBO is the highest-resolution version of exactly that information.
Buy L3 if: you are building or researching a market-making or queue-aware execution model, you are reconstructing books for microstructure research, or you need order-level provenance for compliance.
Do not buy L3 if: you are looking for a better entry signal. Level 2 will not help either, and daily bars are enough for most of what actually works.
Access
L3 / market-by-order is our top tier at $199/month, covering the CME futures we carry, delivered over the same WebSocket and REST surface as everything else. The recording behind every number in this article is the same feed a subscriber gets — /v1/l3 for the stream, the historical archive for the days already recorded.
If you want to check our arithmetic before paying for anything, the free GEX levels page runs on the same infrastructure and costs nothing.
Frequently asked questions
What is the difference between market-by-order and market-by-price?
Market-by-price (MBP, Level 2) tells you there are 7 contracts resting at 29,565.25. Market-by-order (MBO, Level 3) tells you those 7 are seven separate one-lot orders, each with its own id, in the sequence they arrived. The total is identical; the queue is only visible in MBO. On NQ that distinction is unusually stark — in the book we rebuilt, essentially every resting order is a single contract.
How much data is CME Level 3?
Measured on our own recording of NQ, 2026-08-27: 320 MB compressed for one symbol for one day, against 20 MB for aggregated depth and 2.2 MB for trades plus best bid/offer. That is 145× L1. It is also fewer messages than our L2 store, because L2 re-states the whole ladder on every change while MBO sends one message per order event.
Do I need Level 3 data as a retail trader?
Almost certainly not. MBO's unique information is queue position, and queue position only pays if you can act on it in microseconds — which needs co-location, exchange memberships and a full-time engineering team. Without that latency the data is accurate and unusable. We sell L3 and we still say this.
Why does my reconstructed order book end up crossed?
Because not every order that leaves the book is announced. Cancels are: across 2026-08-27 we recorded 8,758,284 adds against 8,758,460 deletes. Fills are not, so a naive replay keeps filled orders forever. In our raw reconstruction 30.4% of resting orders were older than an hour on a book whose median resting time is 8.5 minutes, and the top of book crossed. Bounded to recently-active orders the same data gives a clean three-tick spread.