Counterflow: We Searched 990 Million Option Prints for an Edge. One Survived. It's Live Today.
We tested seven signals from 7.4 years of OPRA options tape against NQ. Six died in public — direction flow, sweeps, blocks, flow at gamma walls, intraday regime reads. The survivor is a two-sided positioning contrarian that was profitable every single year including 2022, with a working short side. It trades live as our 14th sleeve, paper record public from day one.
Last week we finished pulling something we’d wanted for a year: the complete OPRA options tape for the two index ETFs that matter for NQ — every trade, every NBBO quote it printed against, 7.4 years, 990 million rows.
Then we did what we always do: fed it into the meat grinder.
Six funerals, one survivor
We tested seven signal families against next-day NQ, all with the same honest battery — rolling normalization, Newey-West t-stats, train/holdout split, always-long control, costs:
| Signal family | Verdict |
|---|---|
| Aggressor-signed direction flow | Dead — coincident (IC +0.64 with today), knows nothing about tomorrow (−0.01) |
| Sweep direction (intermarket, condition 95) | Dead |
| Block direction (50+ contract prints) | Dead |
| Last-hour flow → overnight | Dead |
| Opening-30-min flow → rest of day | Dead |
| Flow at gamma walls | Dead — full funeral here |
| Positioning extreme (contrarian) | Survived everything we threw at it |
The survivor is now called Counterflow, and it trades live as our 14th sleeve.
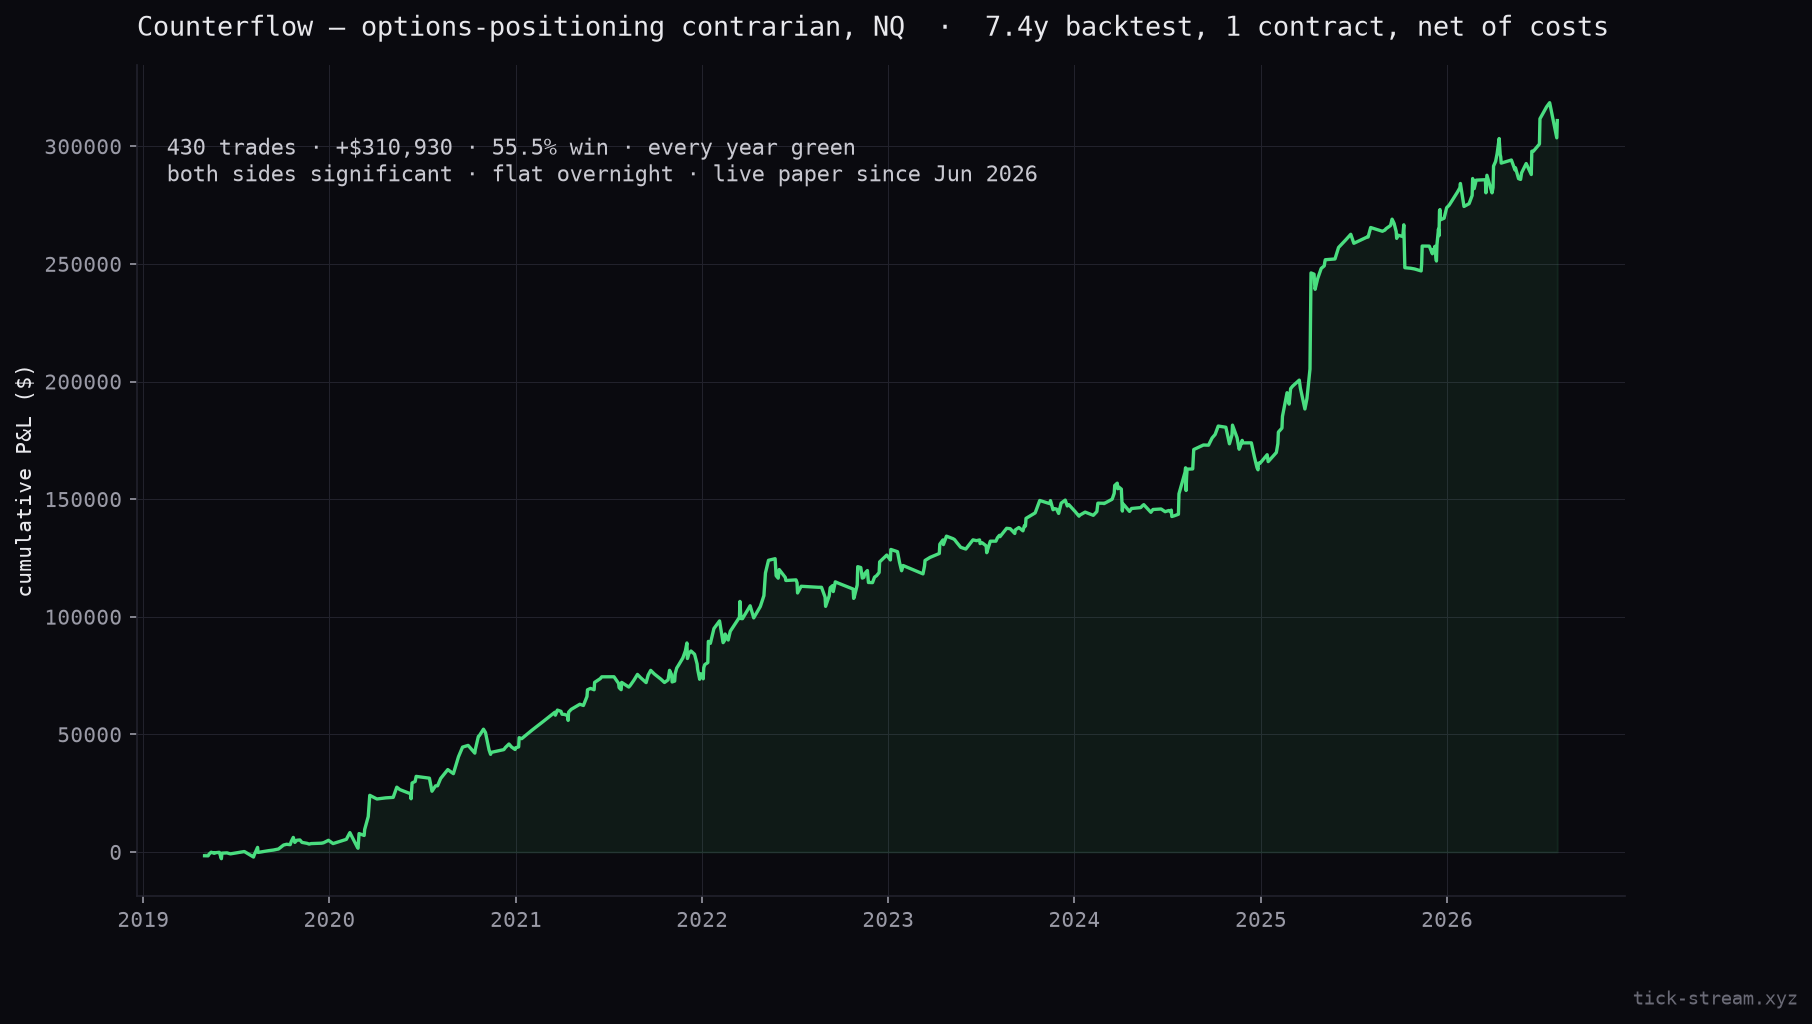
What it is — and what we won’t tell you
Counterflow reads a daily positioning extreme from the index-ETF options market: the days the crowd’s fear or euphoria has just peaked. On those days it trades the next session against the crowd — entry at the open, exit market-on-close, always flat overnight.
The exact composition of the read is the one thing that stays proprietary. Everything else is public: the trade expression, the costs, the full backtest trade list, and a live paper record growing daily.
What we can show without giving away the recipe:
- 430 trades over 7.4 years, +$310,930 net on one NQ contract, 55.5% win, max DD $34,700
- Every calendar year green — including 2019’s thin-options era and the 2022 bear
- Both sides work independently. The short side (fading euphoria) is significant on its own — almost nothing in our research program has a working short
- Orthogonal to dip-buying. PnL correlation to an RSI2-style sleeve: −0.04. It’s new risk, not a relabel
- Quintile-monotone response, replicates on each underlying separately, and survived a threshold-free robustness pass
The property that made us build it
Every edge we’ve ever published decays toward the edges of its sample. Counterflow is the first one we’ve measured that runs the other way: price-normalized, the oldest year is the weakest and recent years are 2–5× stronger.
There’s a boring structural reason. The market it reads grew ~2.7× over the sample, and its activity concentrated massively into short-dated contracts — the 0DTE era. More volume means the sentiment read rests on a bigger sample (less noise), and the mechanism that transmits positioning extremes into next-day price got stronger. The driver is external, documented, and ongoing.
That’s not a promise. Regimes change; if 0DTE volume migrates away, this weakens, and the live record will show it before we do. But “the edge grew with its driver” is a sentence we can’t write about anything else on the board.
Live from day one, warts guaranteed
The paper record runs from June 1, 2026, published unedited — the first ten trades include a −$5,190 long and a −$4,670 short, because that’s what a 55% win rate looks like up close. Backtest and live curve sit side by side on the sleeve page, same as every other algo we run.
→ Counterflow live record & signal access — $100/month, or included in the all-sleeves plan.
Data: our own OPRA options history (stage 1: full chains + open interest 2019→today; stage 2: 990M-row trade+NBBO tape). The same dataset is available as an API.
Frequently asked questions
What exactly is Counterflow's signal?
A proprietary daily positioning read built from the index-ETF options market — the exact composition is the one thing we don't publish. What we do publish: it is a crowd-extreme detector (fear and euphoria both), it is computed each morning before the open from data every institution can buy but almost nobody processes, and every parameter was fixed before the holdout was opened. Everything else about the sleeve — entry, exit, costs, the full trade list — is public.
Why should anyone believe a backtest from a vendor?
You shouldn't — you should believe the live record. The paper sleeve runs from June 1, 2026 with unedited entries and exits published as they happen, next to the backtest. We are also the site that publishes its failures: the same dataset that produced Counterflow killed six other ideas the same week, and those funerals are on this blog with full methodology. A shop that only ever finds edges is selling you something. We mostly find corpses.
What are the headline numbers?
7.4 years, 430 trades, +$310,930 net of costs on a single NQ contract, 55.5% win rate, Sharpe 1.22, max drawdown $34,700. Profitable every calendar year including the 2022 bear. Long side and short side are independently significant — a working short is rare; most mean-reversion edges are long-only. The signal is uncorrelated to classic dip-buying (PnL correlation with an RSI2 sleeve: −0.04).
Is the edge decaying like most published edges?
The opposite, and that's the most unusual property. Price-normalized, the weakest year in the sample is the oldest (2019, ~5bp per trade) and recent years run 2–5× stronger. The structural driver is external and documented: options volume in the instruments we read grew ~2.7× over the sample and concentrated massively into short-dated expiries. The mechanism the signal reads got bigger, not smaller. No guarantee it continues — but 'grew with its driver' beats 'decayed since publication', which is what most public edges show.
How does it trade?
At most one trade a day. Signal is known before the open; on signal days the sleeve enters at the 09:30 ET open, long or short, no stop, and exits market-on-close at 16:00. It is always flat overnight — no gap risk, prop-desk compatible. About 23% of days carry a signal, so it sits flat most of the time and lets the extreme come to it.