CVD Divergence: What the Delta-vs-Price Marker Tells You, and What It Doesn't
The divergence marker flags a higher swing high that cumulative volume delta does not confirm, or a lower low it does not follow. We ran the terminal's exact rule over seven years of NQ with real aggressor-tagged trades: after a divergence, price reversed less than after a confirmed swing, not more. Here is what the marker is still good for.
The divergence marker puts a small triangle wherever price and cumulative volume delta point different ways: price prints a new high while the running total of aggressive buying minus aggressive selling does not, or price makes a new low that the selling does not confirm. It is one of the most taught ideas in order-flow trading, usually with the same promise: the move is running on empty, fade it.
We built the marker because it is a fast, honest way to see disagreement between the tape and the chart. We did not build it to trade for you, and this page shows why.
How the marker works
Every CME trade reaches the terminal with its aggressor side: a trade at the ask was a buyer lifting the offer, a trade at the bid was a seller hitting the bid. The terminal adds those up per bar (delta) and across the session (cumulative delta, the violet line in the net-delta panel).
The marker works on swings. A swing high is a bar whose high is the highest of the three bars on either side of it; a swing low is the mirror. A bearish divergence is a swing high above the previous one while cumulative delta at it is lower than at the previous one: price made a higher high that the aggressive buying did not. A bullish divergence is a lower swing low with higher cumulative delta. The terminal draws the segment between the two pivots on the delta line and marks the candle, the ▼ or ▲ in the chart legend. It runs on whatever timeframe you are looking at, over the lookback you set.
What our data says: less reversal, not more
To test the marker as it is built, we ran the terminal’s exact rule over seven years of NQ: 5-minute bars, New York session, swing pivots three bars either side. A pivot is only known three bars after it prints, so every move is measured from the close of the bar that confirms it; anything else would be using the future. That gave 7,355 higher highs and lower lows, of which 1,820 were divergences. The other 5,535 were the same kind of swing with delta agreeing: the control.
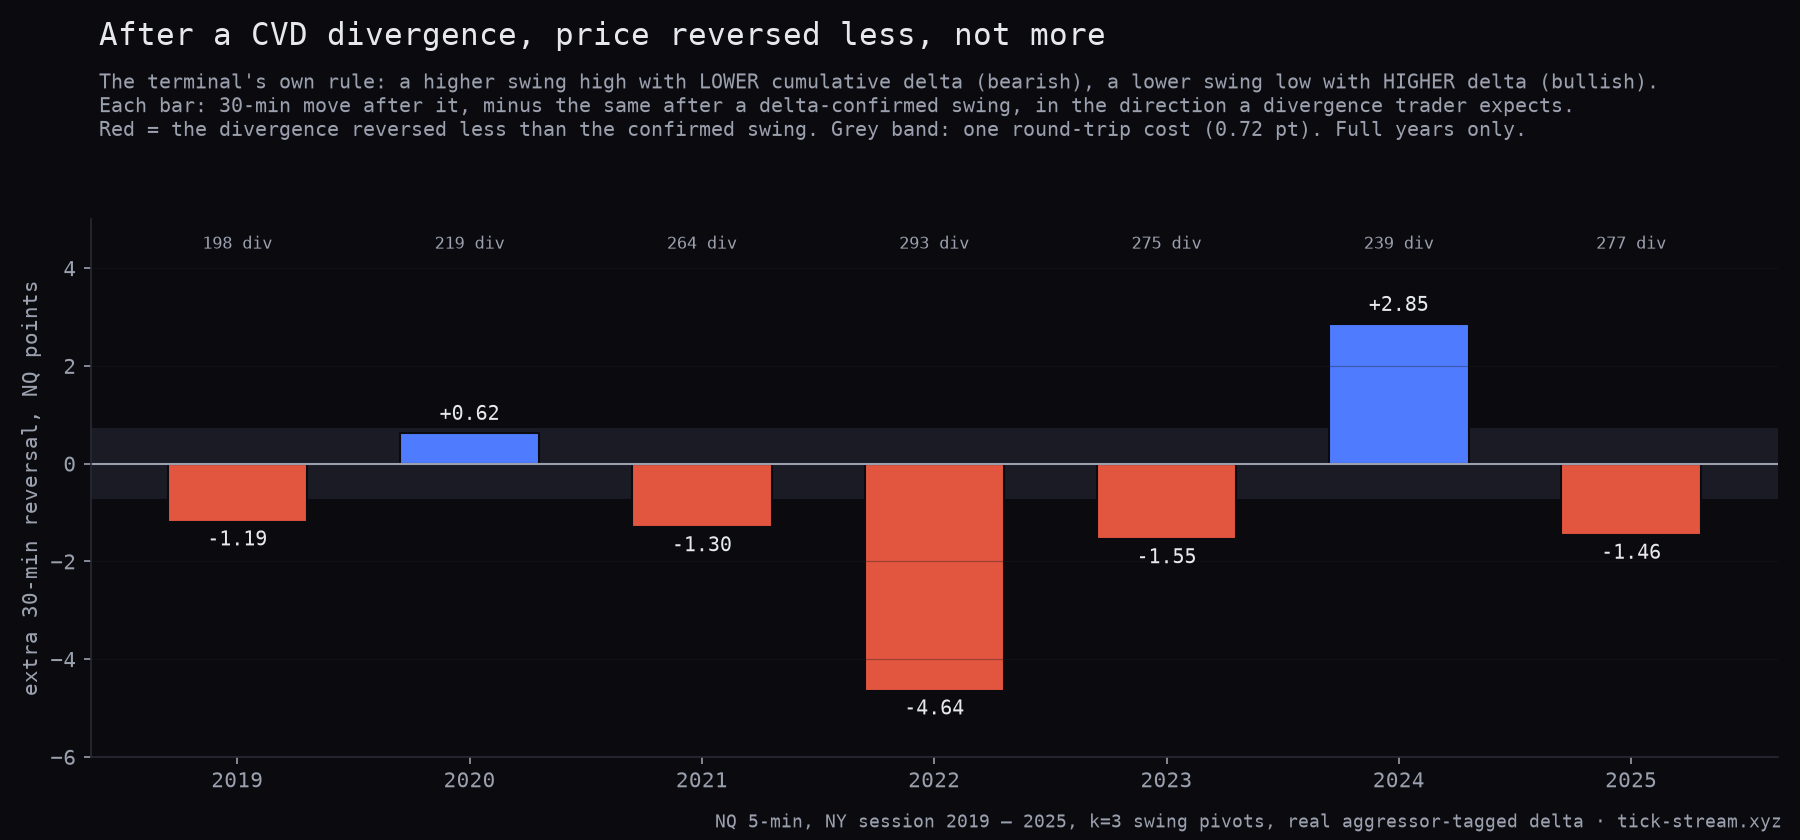
If divergence carries information, price should reverse more after a divergent swing than after a confirmed one. It reversed less.
| After the swing is confirmed | 15 min | 30 min | 60 min |
|---|---|---|---|
| Divergence minus confirmed swing, NQ points | −0.8 | −1.7 | −1.3 |
| 2019–2023 only | −1.2 | −1.7 | −1.9 |
| 2024–Feb 2026 only | −0.2 | −1.6 | 0.0 |
- The sign is wrong, and it is wrong in both halves. Negative means the divergence reversed less than the swing delta confirmed. That held at 15 and 30 minutes in the 2019–2023 years and in the recent ones (at 60 minutes the recent half is flat), and in 5 of 7 full years.
- It is not a strong effect either way. The day-weighted t-statistics sit between −0.3 and −2.4, so the fair summary is not “fade the fade” but “the marker adds no reversal edge, and if anything the opposite”.
- The numbers are small against costs. A round trip in NQ costs about 0.7 points ($14.50). A signal worth a point or two in the wrong direction is not something to build a strategy on, in either direction.
As a filter it does damage
Almost nobody trades bare divergence. The common use is as a gate: take my setup only when the tape agrees. We tested exactly that in our order-flow backtest. Five NQ strategies that are profitable on their own, five order-flow gates, 25 combinations: 22 got worse, by 0.39 Sharpe on average and 0.34 on the 2024 to 2026 holdout. The gates also removed about half the trades.
The gate built from divergence, skip the days where price and flow disagree, was the one partial exception: it improved three strategies, but those three are effectively the same long-biased position counted three times, and on the RSI(2) strategy it helped the training years and then reversed out-of-sample.
The reason is the same as above. Order flow is coincident, not predictive: cumulative delta correlates +0.27 with the move that is happening and about zero with the next one. “Delta agrees with my trade” mostly means “the last stretch already moved my way”.
What the marker is good for
- A reason to look, not to act. A divergence says the latest push was not carried by aggressive volume in the same direction. That is worth two seconds on the footprint, the liquidity heatmap and the largest prints before you commit to a breakout.
- Honest context in a fast market. It is easy to believe a new high is broad participation. The marker shows you when it is not, without claiming that means anything for the next bar.
- A test harness for your own rule. If you trade divergence, the comparison on this page is the one to run on your own setup: divergent extremes against the same extremes without divergence, after costs, split in time.
That is why the terminal marks the disagreement and leaves the conclusion to you.
Methodology: NQ continuous front month, 5-minute bars built from our own minute store with real aggressor-tagged volume (quote rule against the prevailing bid and ask), New York session 09:30 to 16:00 ET, March 2019 to February 2026. Rule identical to the terminal’s: swing high = high of the three bars either side, bearish divergence = a higher swing high with lower cumulative delta than the previous swing high, bullish mirrored; control = higher highs and lower lows that delta confirmed. Moves measured over 3, 6 and 12 bars from the close of the confirmation bar (pivot + 3), in the direction of the expected reversal. Significance day-clustered. Cost reference: $14.50 round trip = 0.725 NQ points. Filter results from the separate order-flow overlay study (five daily strategies × five gates, 2019 to 2023 train, 2024 to 2026 holdout).
Frequently asked questions
What is a CVD divergence?
Cumulative volume delta (CVD) adds up, trade by trade, the volume that hit the ask minus the volume that hit the bid. A divergence is a moment where price and CVD disagree: price makes a new high but CVD does not (bearish divergence), or price makes a new low while CVD holds above its low (bullish divergence). The idea is that the move is running on thin participation and should reverse.
Does CVD divergence predict reversals in NQ?
Not in our data. We applied the terminal's own divergence rule to NQ 5-minute bars in the New York session from 2019 to 2026. After 1,820 divergences price reversed less than after 5,535 swings that delta confirmed: by about 0.8, 1.7 and 1.3 points over 15, 30 and 60 minutes. The gap had the wrong sign for the divergence trade in 5 of 7 full years.
Should I use CVD divergence as a confirmation filter?
Test it on your own system first. When we used order-flow conditions as gates on five independently profitable NQ strategies, 22 of the 25 combinations got worse, by 0.39 Sharpe on average and 0.34 out-of-sample. The one loose 'skip days where price and flow diverge' gate helped three similar long-biased strategies but reversed out-of-sample on the RSI(2) strategy.
How does the terminal calculate delta?
From every CME trade print with its aggressor side: a trade at the ask is a buy, a trade at the bid is a sell. The terminal accumulates that per bar and runs it as cumulative delta over the candles you are looking at. The divergence marker compares two consecutive swing highs (or lows), each a bar that is the extreme of the three bars on either side: a higher high with lower cumulative delta is bearish, a lower low with higher cumulative delta is bullish.
What is the divergence marker useful for, then?
As a prompt to look closer rather than as an order. A divergence tells you the latest push was not carried by aggressive volume in the same direction, which is worth a glance at the footprint, the liquidity heatmap and the largest prints before you commit. It is information about the move that is happening, not about the next one.