L1 vs L2 vs L3 Market Data: What Retail Algo Traders Actually Need (and Why L3 Is Wasted on You)
Level 1, Level 2, Level 3 — every data vendor sells the ladder, few explain who actually needs which rung. We run a market-data business AND publish tick-level research, so here's the self-inflicted honest version: exact definitions, real storage numbers from our own 7-year NQ store, the measured size of the only edge that's unique to the order book — and why order-by-order data is a storage bill, not an edge, for anyone trading through a broker API.
Every data vendor sells the ladder: Level 1, Level 2, Level 3 — each tier more expensive, each implied to be closer to “what the professionals see.” We’re a data vendor too, so consider this article self-inflicted honesty: we sell L1 and L2, we publish research built on them, and we’ll tell you exactly where each stops being useful — including why the most expensive tier is a waste of money for every retail algo trader, ours included.
The difference to the usual explainer: the numbers below aren’t hypothetical. The storage figures are from our own 7-year NQ archive, and the edge measurements are from studies we’ve published with full methodology.
Related: CME market data pricing and fees, explained with numbers · CME data feed providers compared.
The ladder, precisely defined
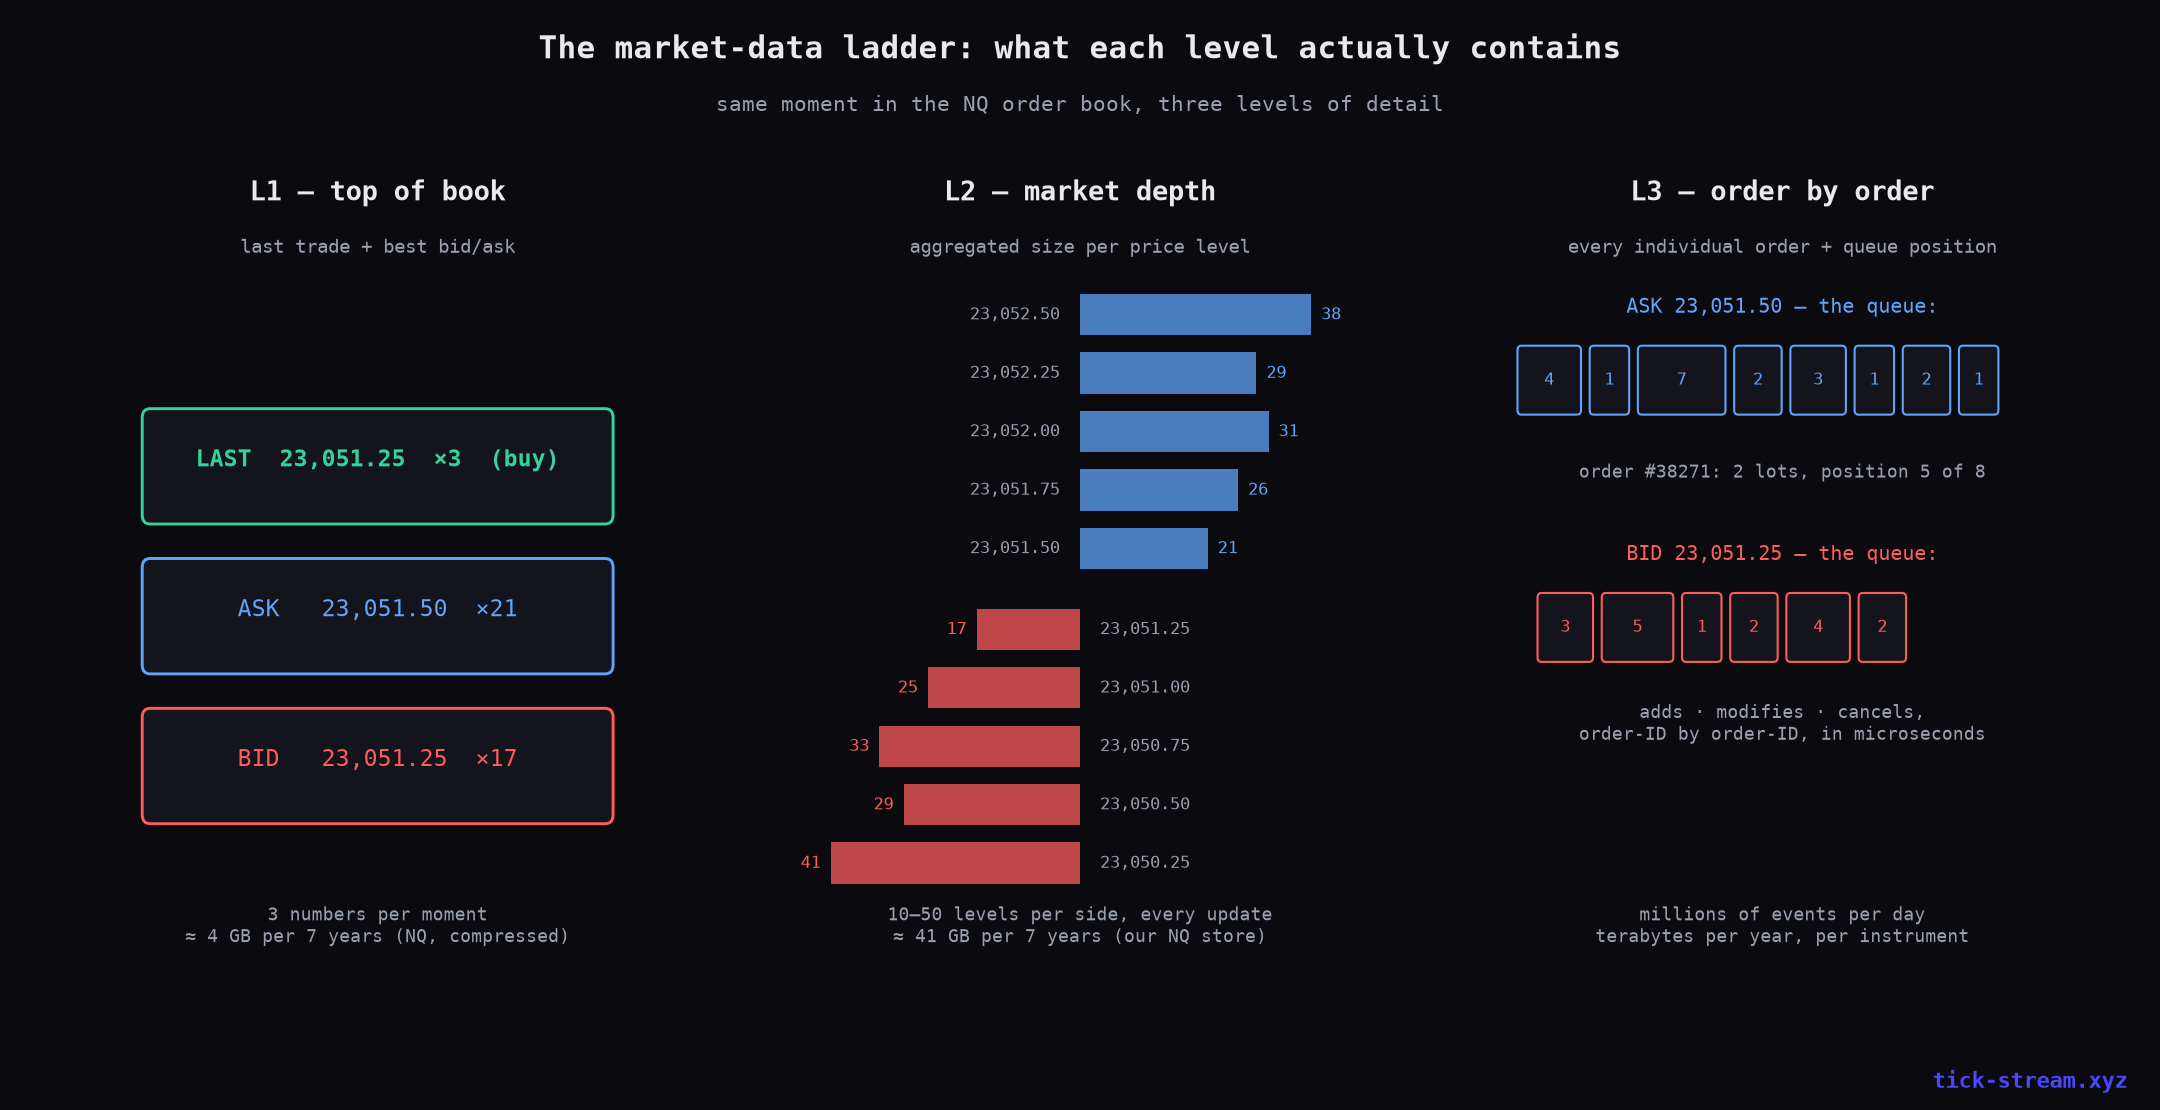
Level 1 (top of book) is the market’s headline: the last trade (price, size, aggressor side) and the current best bid and ask with their sizes. Three numbers per moment. Everything you see on a normal chart is built from this.
Level 2 (market depth / DOM) adds the resting limit orders away from the touch: aggregated size at each price level, typically 10–50 levels per side. This is the “ladder” in trading DOMs and the input to order-book imbalance measures.
Level 3 (market-by-order, MBO) explodes each L2 level into its individual orders: every add, modify and cancel, tagged with an order ID, in microsecond sequence. Its unique information is queue position — where your order stands at a price level, and how the queue in front of you is behaving.
Three quick anchors from our own NQ store:
| What it contains | 7 years of NQ | Unique information | |
|---|---|---|---|
| L1 | trades + best bid/ask | ~4 GB compressed | price, spread, aggressor flow |
| L2 | 10–50 depth levels/side | ~41 GB | resting liquidity, imbalance |
| L3 | every order, by ID | terabytes | queue position, order-level flow |
What retail algo traders actually need: a 4-item list
1. For daily/swing strategies: daily bars. Boring and sufficient. Most of the live strategies on our public board — trend, breakout, mean-reversion, calendar sleeves — run on daily closes. Cost: free to trivial.
2. For intraday strategies: L1 ticks with aggressor side. One-minute bars built from real trade prints power every backtest we publish — ORB30, the gap study, the wickless-candle test, the full order-flow battery. The aggressor tag (was the trade a market buy or sell?) is the one refinement worth insisting on, because it’s what CVD/delta/footprint research needs — and because vendors get it wrong. Ours is served with documented provenance.
3. For execution research: add L2. Not for signals — for costs. Real spread by time of day, depth where your stop sits, how many levels a 10-lot order walks. Backtests die on execution assumptions more often than on signals; L2 is how you make those assumptions honest.
4. For nothing you can execute: L3. Read on.
The case against L3 for retail, in three measured facts
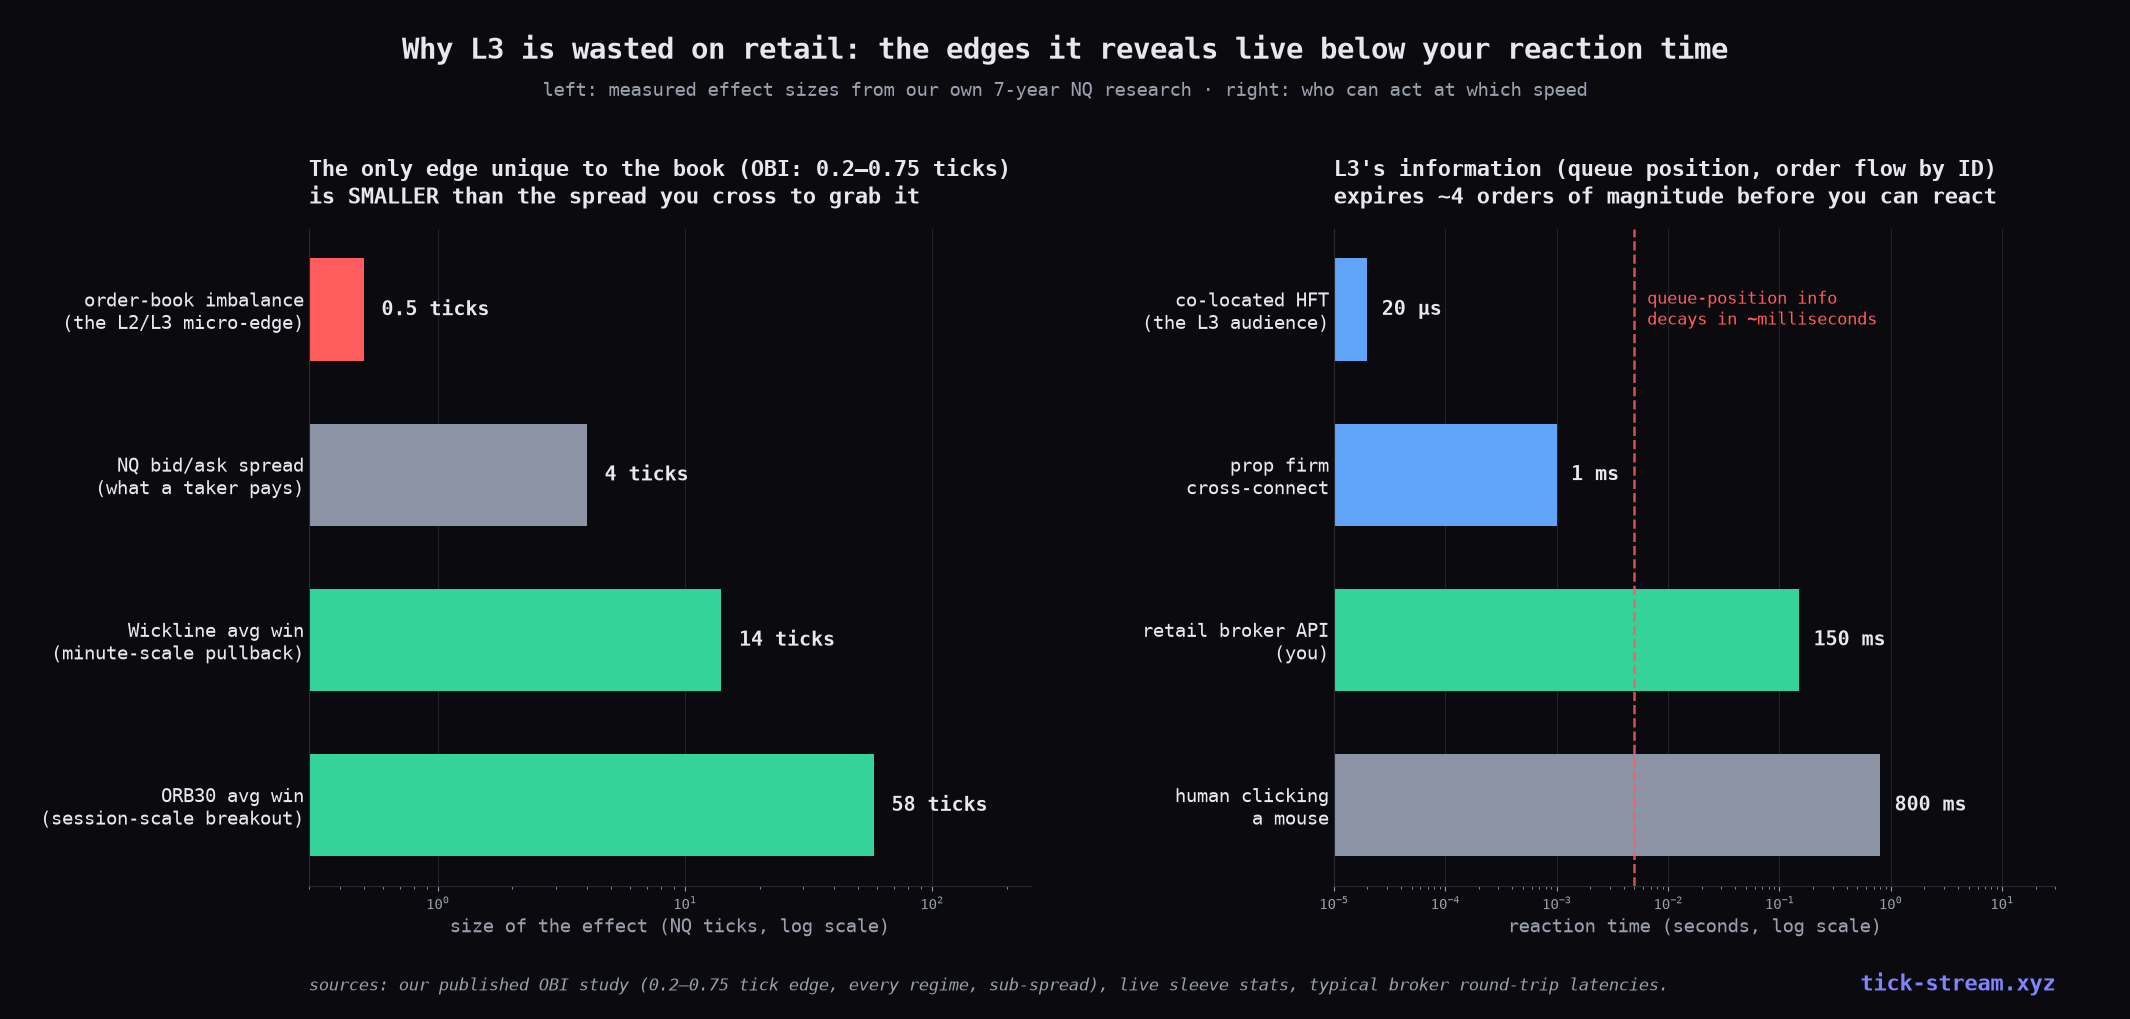
Fact 1: The only edge unique to the book is smaller than the cost of taking it. We measured order-book imbalance on years of tick-level NQ data: it genuinely predicts the next price drift — in every regime, robustly. The size of that edge: 0.2–0.75 ticks, against a ~4-tick round-trip cost for anyone crossing the spread. It’s real and it’s reserved for market makers who are already resting in the queue. Deeper data doesn’t make the edge bigger; it just lets you measure your exclusion from it more precisely.
Fact 2: L3’s information expires before your order arrives. Queue position and order-by-order flow decay in milliseconds. A co-located HFT reacts in ~20 microseconds; a retail broker API round trip is ~100–300 milliseconds — four orders of magnitude slower. Whatever an L3 feed tells you, the book has changed thousands of times before your order reaches the exchange. Paying for information you structurally cannot act on isn’t an edge; it’s a subscription to frustration.
Fact 3: The strategies retail actually runs don’t change under L3. We’ve now tested the entire retail order-flow canon — CVD, delta, divergences, footprints, absorption, plus all 8,191 combinations and an ML model — on real aggressor-tagged trades: order flow is coincident, not predictive. That verdict is about the information itself, not its resolution. Order-by-order granularity cannot rescue a signal that doesn’t lead price at trade granularity. Meanwhile the effects that do survive our testing live at minute-to-session scale — 14 to 58 ticks per trade — where L1 is complete information.
”But professionals use L3” — yes, and that’s the point
Market makers and HFTs use MBO because their business is the queue: they earn the spread, so queue position is their inventory. That business requires co-location (~$10k+/month), exchange memberships, microwave links, and a full-time engineering team — the complement of a retail setup. Copying their data tier without their latency is like buying a Formula 1 telemetry feed for your commute. The telemetry is excellent. You’re still in traffic.
The decision in one picture
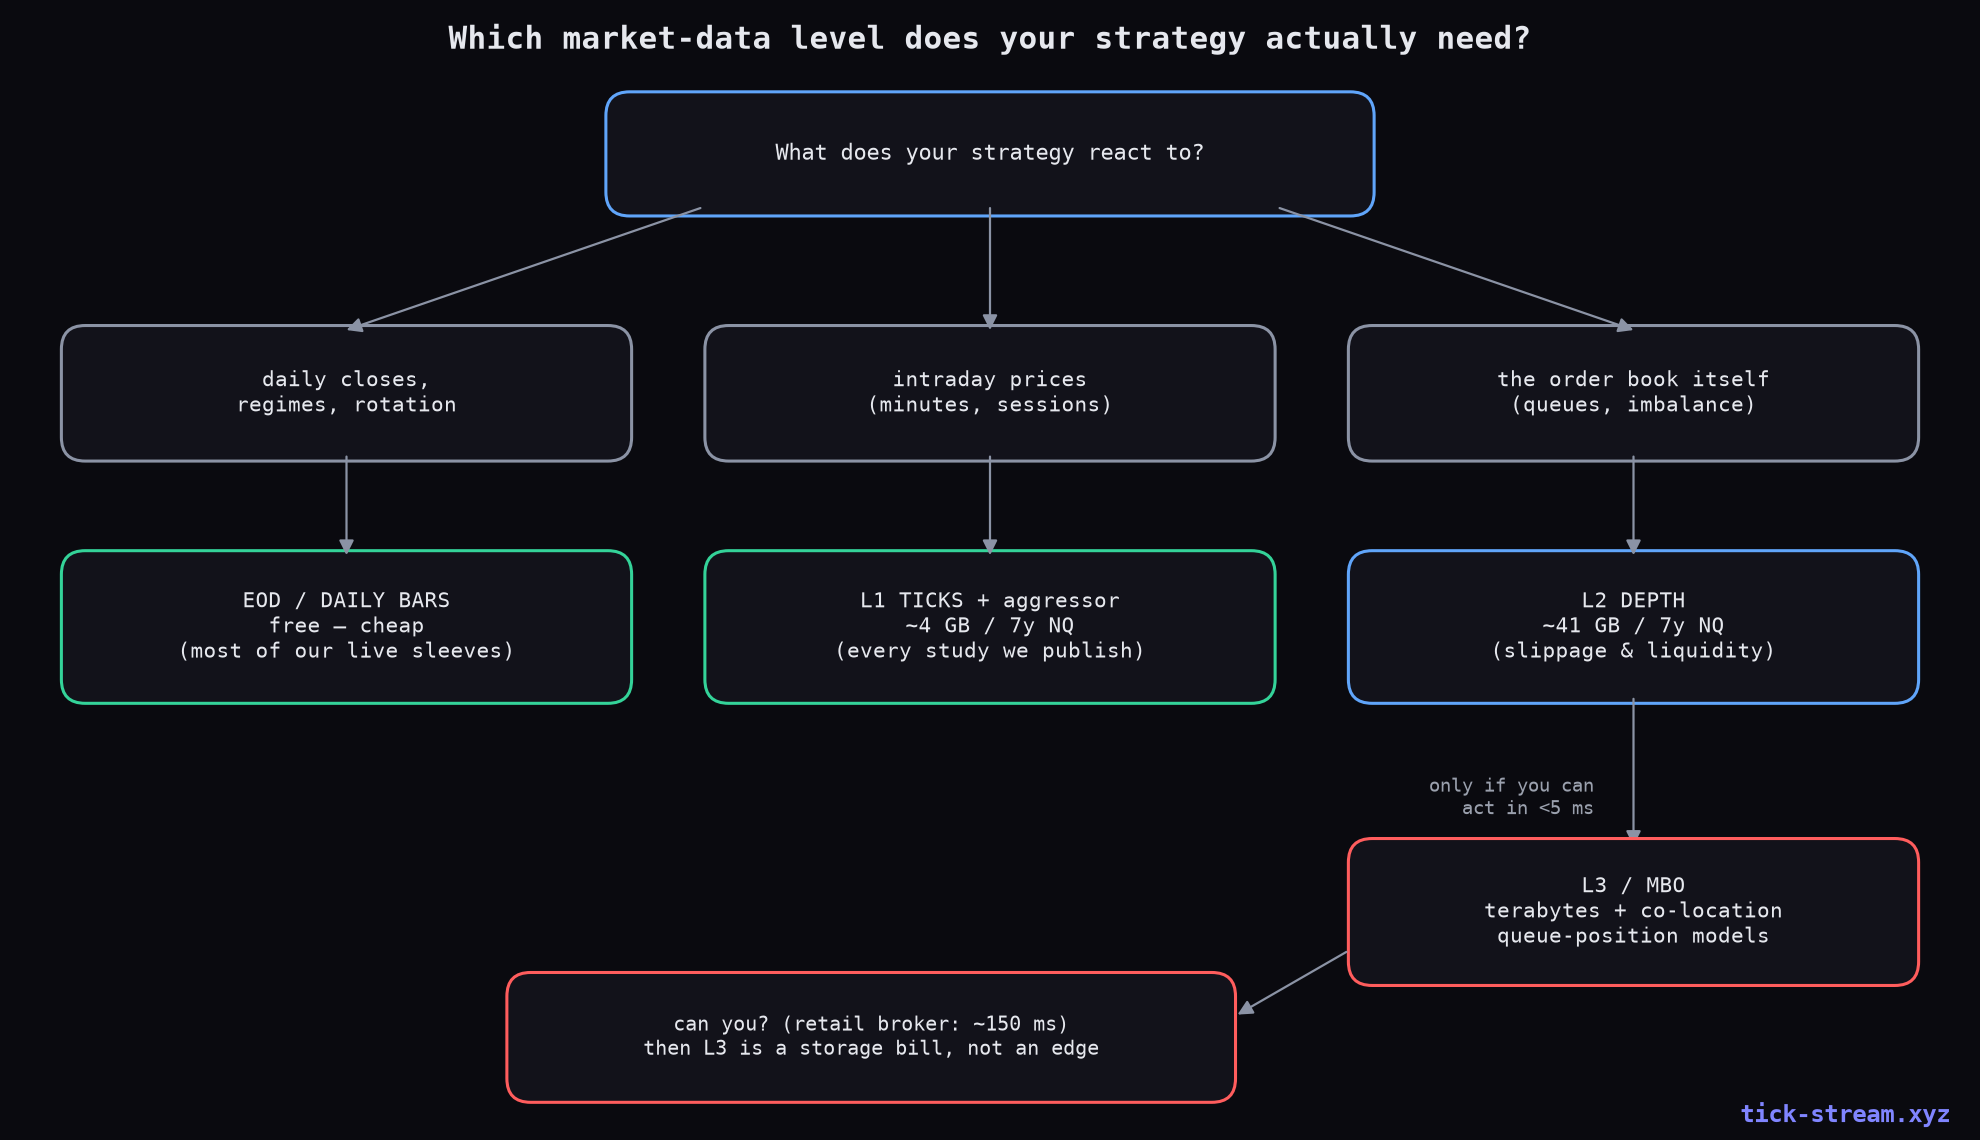
The honest sequence for a retail algo trader building up:
- Prototype on daily bars. If the idea doesn’t show up there or on minute bars, more resolution won’t create it.
- Validate intraday on L1 ticks with aggressor side. This is the tier where essentially all publishable retail research lives.
- Before going live, spend a week with L2 — measure the spread you’ll actually pay and the depth around your stops. This is the cheapest Sharpe improvement available: not a better signal, a truer cost model.
- Spend the L3 money on more history instead. Seven more years of L1 across more regimes will improve your backtest more than seven more decimal places of book detail. Regime coverage beats resolution, every time we’ve tested it.
Our own stack, for transparency: the historical archive serves L1 ticks (2019→live, aggressor-side with documented provenance), full L2 depth and option chains over one API; the live stream is the same data in real time. No L3 — deliberately. If your strategy genuinely needs market-by-order, you’ve outgrown retail infrastructure entirely, and you should be talking to the exchange, not to us.
Frequently asked questions
What is the difference between L1, L2 and L3 market data?
L1 (Level 1 / top of book) is the last trade plus the best bid and ask — three numbers per moment. L2 (Level 2 / market depth) adds the aggregated resting size at each price level away from the touch, typically 10–50 levels per side. L3 (Level 3 / market-by-order, MBO) breaks each L2 level into the individual orders inside it — every add, modify and cancel with its own order ID, which reveals queue position. Each level contains everything below it; each is roughly an order of magnitude more data.
Is Level 2 data worth it for a retail algo trader?
For trading signals: our seven years of research says no — the only directional edge we ever measured in the book (order-book imbalance) is real but 0.2–0.75 ticks, smaller than the ~4-tick spread a taker crosses to act on it. For execution research it's genuinely useful: measuring real spreads by time of day, estimating slippage for size, and knowing how thick the book is where your stop lives. Buy L2 to model your costs, not to find entries.
Why is L3 market data pointless for retail traders?
Three measured reasons. First, the information it adds over L2 — queue position and order-by-order flow — decays in milliseconds, while a retail broker round trip is ~100–300ms: the signal expires about four orders of magnitude before you can act. Second, the edges that live at that depth are sub-spread (our OBI measurement: 0.2–0.75 ticks against a 4-tick cost), harvestable only by makers with queue priority — which requires the co-location you don't have. Third, it's terabytes per year per instrument, and every hour spent engineering that pipeline is an hour not spent on strategies that work at your latency.
What data do I need to backtest a futures strategy properly?
Match the data to your holding period. Daily and swing strategies: clean daily bars are enough — most of our own live sleeves run on them. Intraday strategies (minutes to a session): L1 tick data with the aggressor side, aggregated to 1-minute bars — this is what every study we publish uses, and 7 years of NQ compresses to a few gigabytes. Add L2 only when you need to model execution (spread, depth, slippage at size). L3 changes backtest results only for queue-position strategies you cannot execute anyway.
Do order-flow strategies need L2 or L3 data?
The popular retail order-flow indicators (CVD, delta, footprints, absorption) are built from L1 trades with aggressor side — not from depth. We backtested twelve of them plus every combination on seven years of NQ: order flow was coincident, not predictive — knowing it at L3 precision wouldn't have changed the verdict, because the information itself doesn't lead price. The book-based signal (imbalance) does lead price slightly, and is sub-spread. Better data doesn't rescue a signal that isn't there.
How much does historical tick and depth data cost?
Less than most traders think for L1, more than it's worth for L3. Our own archive prices: 7 years of NQ tick history (every trade, aggressor-side) and full L2 depth are included in data plans from $80–100/month via API. Comparable CME market-by-order (L3) datasets run to thousands per year, plus the storage (terabytes) and the engineering time — for information a broker-API trader cannot act on.