How to Code a Trading Algorithm: The Roadmap That Survives an Honest Backtest
How to start algo trading without fooling yourself. Everyone's first AI-assisted trading algorithm backtests like a money machine — and it's almost always wrong. The complete roadmap: which market data you need (tick data vs OHLCV), how to backtest a trading strategy honestly (point-in-time, conservative fills, real costs, out-of-sample, placebo tests), how to use AI coding agents like Claude Code for strategy research, and why most of your ideas should die. Based on testing dozens of strategies on 7 years of real NQ tick data.
Every week someone shows us an algo that backtests like a money machine. Every week it’s the same three bugs. This guide is the roadmap we actually use — the one that took us from “bombastic algos which are wrong” to a live, forward-tested strategy book — written so you can skip a few months of fooling yourself.
The honest arc looks like this:
- Understand which data you need.
- Understand what OHLCV is, what tick data is, and which one your idea actually requires.
- Start doing research with an AI coding agent (Claude Code is genuinely good at this).
- You will produce bombastic algos which are wrong. Everyone does. The equity curve will be beautiful and fake.
- You start fixing that fool. This article is step 5.
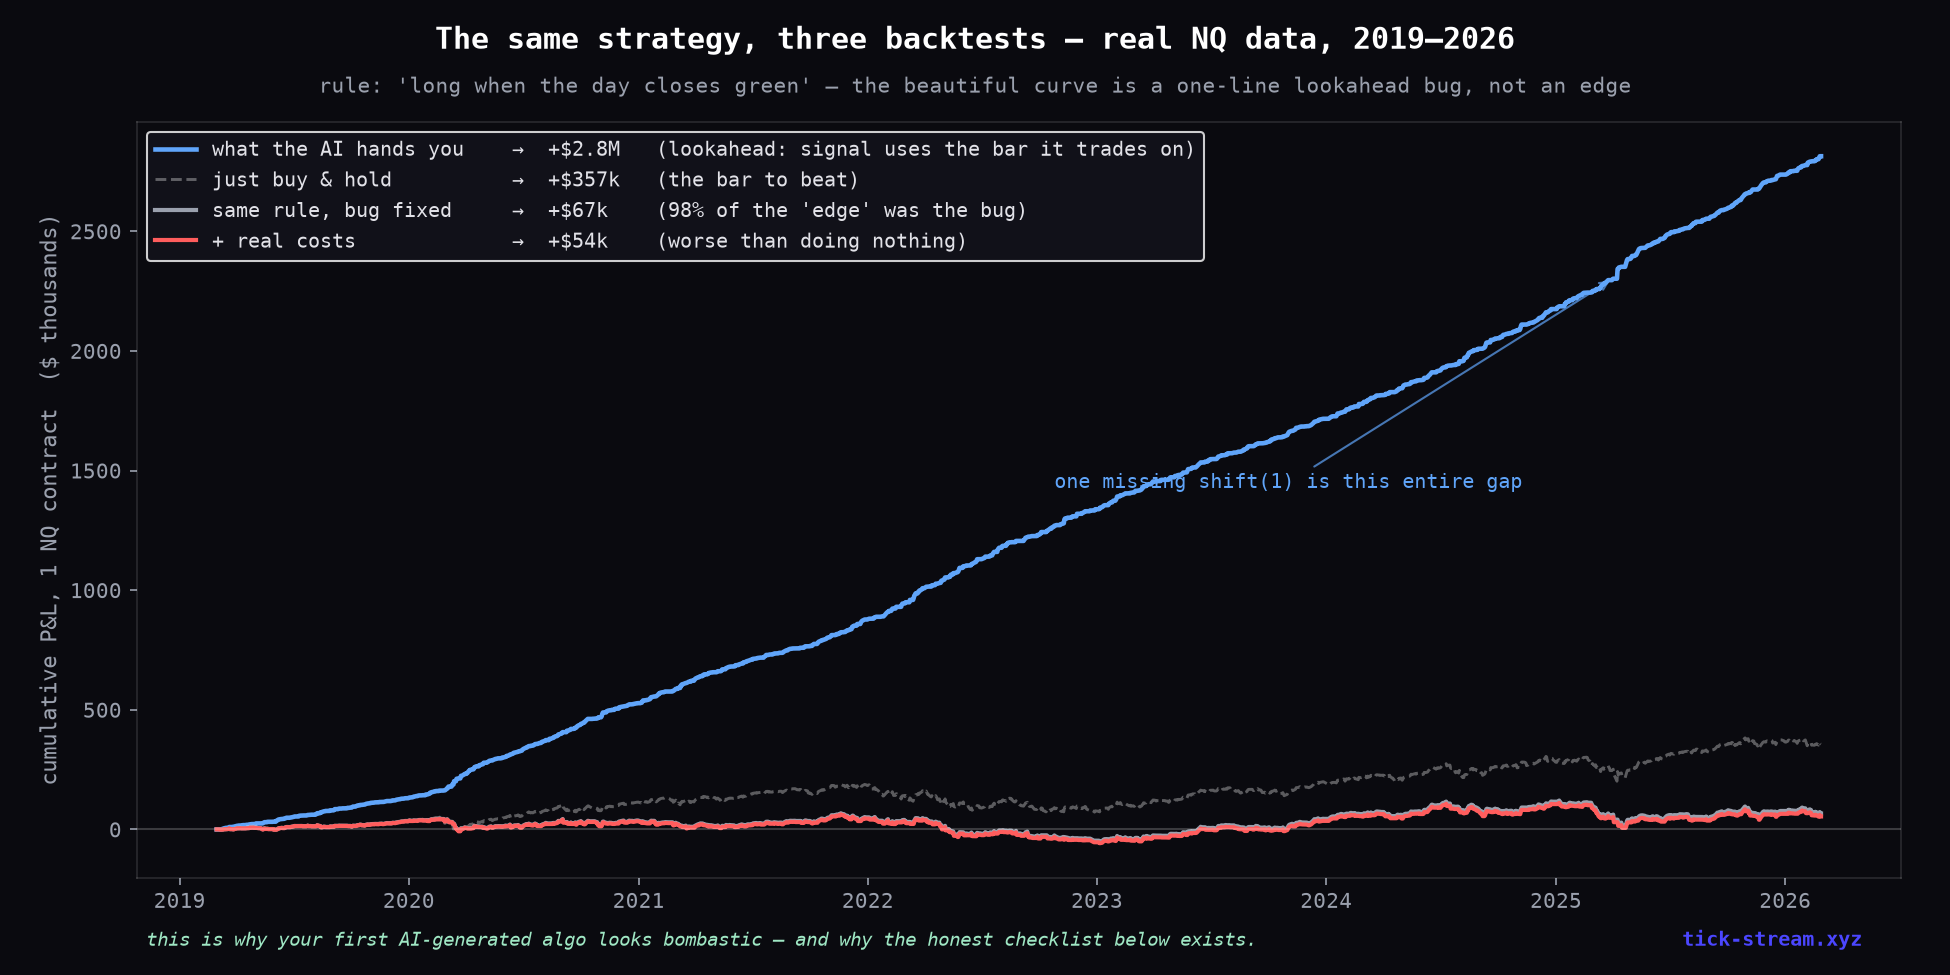
Here’s the whole article in one picture — a real strategy on real NQ data, backtested three ways. The only difference between ”+$2.8M” and “worse than doing nothing” is a one-line lookahead bug and transaction costs:
Step 1 — What data do you need for algo trading? (tick data vs OHLCV)
OHLCV bars (open/high/low/close/volume) are summaries. They tell you the range of a period, not what happened inside it. For daily-timeframe strategies — trend filters, dip-buying rules, calendar effects — clean daily bars are completely sufficient, and anything more is complexity theater.
Tick data is the actual event stream: every trade, with price, size and — critically — the aggressor side (did a market buy lift the offer, or did a market sell hit the bid). The moment your idea says anything about intraday behavior — “the breakout ran,” “the level was absorbed,” “delta diverged” — resampled candles destroy exactly the information you’re claiming to use. You cannot test an order-flow idea on 5-minute candles; the candle is the removal of the order flow.
Level 2 (book depth) only matters for microstructure and execution research — queue position, absorption, spread dynamics. Most people never need it; if you do, you’ll know.
Whatever the granularity, the non-negotiable property is point-in-time correctness: the dataset must contain exactly what you’d have known at that moment. No back-adjusted revisions, no survivorship-filtered universes (we measured that one: two-thirds of a marketed “edge” was survivorship), no silently-interpolated gaps. We run everything in this blog on 7 years of real NQ tick data with the true aggressor side — that store, and the historical API it feeds, is the same data our live feeds stream, which is the point: backtest on exactly the data you’d trade live.
Step 2 — Using AI (Claude Code) to build trading algorithms — and its failure modes
AI coding agents have changed the economics of this completely: a strategy idea that took a week to test now takes an afternoon. We use Claude Code for nearly all research iteration, and recommend it. But understand the incentive gradient: the agent optimizes for a result that satisfies you, and nothing satisfies like a rising equity curve. Left unguarded, it will hand you fakes — not maliciously, but because the three bugs that create fake edges are also the three defaults of naive backtesting code:
- Lookahead bias. The signal uses the close of the bar it enters on, a full-day feature computed before the day ended, or an indicator warmed up on future data. This is the most common and the most invisible — it single-handedly created a “day-type prediction” edge we later had to kill.
- Intrabar fill magic. One bar touches both your stop and your target; the naive engine books the target. On tight intraday stops this manufactures 20–30 points of win rate — it’s the entire gap between a claimed 62% win rate and the measured 31% on the EMA-pullback system, and the same artifact once faked a profit-factor-50 monster in our own first ORB pass before we caught it.
- No costs. At thousands of trades, commission + slippage is the difference between an edge and a treadmill. The IB60 system nets almost exactly $0 gross — costs are what make it a loser.
When you brief your agent, say it explicitly — every session, in the system prompt or task description: be careful with lookahead bias, bar-boundary artifacts and data misinterpretation; resolve ambiguous bars conservatively; include real costs; split train/test and walk forward; add a placebo test; add Monte Carlo resampling. A good agent implements all of this correctly when asked. Almost none of it happens when you don’t.
Step 3 — How to backtest a trading strategy: the honest checklist
This is the engine spec we hold every test on this blog to. Steal it verbatim:
- Point-in-time only. The test never sees data it wouldn’t have had live. Signals compute strictly on completed bars.
- Conservative fills. On any bar that touches both stop and target, the stop fills first. Targets can only fill from the next bar onward. Limit entries fill only on a true touch. No intrabar fiction — if the data is ambiguous, you lose the ambiguity.
- Real costs on every trade. For NQ we charge $4.50 commission + 2 ticks of slippage per round trip, with extra slippage on stop-outs. Cheap? Then your edge survives it. Expensive? Then you didn’t have one.
- Out-of-sample, touched once. Build on 2019–2023. Test on 2024–2026 exactly one time, at the end. If you iterate against the holdout, it’s not a holdout anymore — it’s a slower training set.
- Significance on daily P&L, not per-trade. Overlapping and clustered trades fake per-trade t-stats effortlessly. Aggregate to daily, then demand |t| > 2. (The t-statistic measures how far your mean sits above zero relative to its own noise; below 2, you have a coin flip with commentary.)
- A placebo for every signal. Re-run the identical trade skeleton — same frequency, same hold time, same session — with randomized entries. If the real signal can’t beat its own placebo, the profit came from structure (long bias, volatility timing, session drift), not from the signal. This test kills more “edges” than any other; it’s how we found that a high-volume breakout is statistically identical to a random high-volume bar.
- Walk-forward and Monte Carlo as confirmation. Roll the train/test boundary through time; resample trade sequences to see the drawdown distribution instead of the single realized path. Neither creates truth, but both expose fragility.
And one meta-rule that outranks all of it: hunt your own results harder than your critics will. When something looks great, your first hypothesis must be “I made an error.” Twice now, our best-looking result of the month was a bug — the misplaced fade-stop in the ORB study, an accidental double vol-scaling in a sizing overlay. The method only works if disproof is the goal.
Step 4 — Python or Rust for backtesting? Prototype in Python, industrialize in Rust
Iterate ideas in Python — vectorized pandas/numpy on daily or minute bars is unbeatable for speed-of-thought research. But tick-level work changes the math: a 7-year NQ tick store is on the order of 10⁹ events, and a parameter sweep across it in Python is an overnight job. The same engine in Rust is routinely 10–100× faster, and that speed is not a luxury — it’s research quality. When the full sweep takes minutes, you actually run the placebo, the walk-forward and the Monte Carlo. When it takes hours, you skip them, and skipped checks are where fake edges live. (Our own pipeline is Rust end-to-end for exactly this reason; the AI agent writes idiomatic Rust as readily as Python — there’s no longer a convenience tax on doing it right.)
Step 5 — How many trading strategies actually work? Expect the graveyard
Here is the base rate nobody selling courses will tell you: with this checklist applied, most of your ideas die. Ours did. The public record is this blog — ICT setups, opening-range systems, order-flow indicators, value-area strategies, volume confirmation, multi-timeframe entries, leveraged-ETF rotations — nearly all of it flat or negative once the fills got honest and the costs got real.
What survives is modest and unglamorous: short-term mean reversion, daily trend persistence, a thin breakout-continuation effect. Single strategies with Sharpe around 1 — which only become a real book through diversification across uncorrelated sleeves, forward-tested live before real money touches them. That’s the honest end state of the roadmap: not one magic algo, but a small portfolio of validated, boring edges and a very large folder of things you proved don’t work.
The folder of dead ideas is the moat. Anyone can generate strategies now — the AI made that free. Knowing which ones are real is the entire game, and that knowledge costs exactly the discipline described above.
Everything in this guide runs on data you can pull yourself: our historical tick archive (every NQ tick with real aggressor side + full L2 back to 2019, the same feed our live API streams) is built for exactly this workflow — and the strategies that survived our own version of it are forward-tested in public on the algos page, wins and losses both. For the deeper data-side guide, see backtesting with historical tick data.
Frequently asked questions
What data do you need to build a trading algorithm?
It depends on the timeframe of the edge. For daily strategies, clean OHLCV daily bars are enough. For anything intraday, you want tick data — the actual sequence of trades with the real aggressor side (was the trade a market buy or a market sell), because resampled candles destroy the information most intraday ideas claim to use. For microstructure or execution work you additionally want Level 2 (order book depth). The universal requirement is point-in-time correctness: the data must reflect exactly what you would have known at that moment, with no revisions, no survivorship, no gaps silently filled.
Why do AI-generated trading algos look so profitable at first?
Because an AI coding agent optimizes for making you happy, and the easiest way to a happy user is a beautiful equity curve. The three most common failure modes we see: lookahead bias (the signal quietly uses information from the bar it trades on, or later), optimistic intrabar fills (when one bar touches both stop and target, the backtester books the win), and zero transaction costs. Each alone can turn a random signal into a '4x profit factor' — together they produce the bombastic-but-fake algos every beginner generates in week one. The fix isn't better prompting alone; it's an engine that makes those errors structurally impossible.
What is the most important rule in backtesting?
Conservative resolution of ambiguity. Whenever the data can't tell you what happened first — a bar that touches both your stop and your target, a fill at a level that was only briefly touched, a signal computed at a bar's close and traded on the same close — resolve it against yourself: stop before target, no same-close entries, targets only fill from the next bar. Real edges survive pessimistic fills. Artifacts don't. If a strategy's profitability depends on the optimistic reading of ambiguous bars, it has no edge.
How do you know if a backtest result is statistically real?
Three layers. First, compute significance on daily aggregated P&L, not per-trade — overlapping or clustered trades massively inflate per-trade t-stats. You generally want |t| > 2 on the daily series. Second, hold out recent years entirely: build on 2019–2023, test exactly once on 2024–2026; if the edge doesn't replicate, it's dead. Third, run a placebo: the same trade skeleton (same frequency, same hold time, same session) with a randomized entry. If your signal can't beat its own placebo, the 'edge' was structure (like long bias or volatility timing), not the signal.
Should you write backtests in Python or Rust?
Prototype in Python, industrialize in Rust. Python with vectorized pandas/numpy is unbeatable for research iteration speed on daily bars. But once you're sweeping parameter grids over years of tick data — millions of events per day — a Rust engine is routinely 10–100x faster, which changes what you can afford to test. Speed is a research quality issue: if a full 7-year tick-level sweep takes 4 minutes instead of 7 hours, you run the placebo, the walk-forward, and the Monte Carlo instead of skipping them.
How many strategy ideas actually survive honest testing?
In our experience: roughly one in ten, and that's with ideas pre-filtered for plausibility. We've published the graveyard on this blog — ICT setups, opening-range systems, order-flow indicators, volume confirmation, value-area strategies, EMA pullbacks, multi-timeframe entries, leveraged-ETF rotations — nearly all dead after conservative fills, real costs and out-of-sample validation. The few survivors (trend persistence, short-term mean reversion) are modest, need diversification to be worth running, and would have been indistinguishable from the fakes without the discipline. High kill rate isn't failure; it's the process working.