We Put 990 Million Option Prints Against Gamma Walls. The 'Defense Flow' Exists at Fake Levels Too.
Fourth and final test of the gamma-level thesis — this time measuring the options FLOW at wall touches instead of price reaction. 906 real wall touches vs 918 placebo levels: no extra volume, no sweep burst, and the strike-concentration everyone screenshots appears identically at fake levels. Bonus funeral: the strike with the biggest fresh OI build breaks MORE often than random.
This is the fourth time we’ve tested whether gamma walls mean anything, and it’s the last, because we’ve now run out of angles.
The first three tests measured price: daily walls, intraday moving walls, wall-touch reactions — all placebo-identical, documented at length. The standard objection each time: “you’re measuring price, but the wall is defended in the options flow — watch the tape when price gets there.”
Fair. We couldn’t measure that before. Now we have the complete OPRA trade+NBBO tape, 7.4 years, 990 million prints. So: what actually happens in the options market in the minutes after NQ touches a gamma wall?
The setup
906 real wall touches (2019–2026), each mapped ex-ante — yesterday’s wall, yesterday’s futures/ETF ratio, no same-day scaling. Against them, 918 placebo touches: fake levels on the same side of price, at wall-distances borrowed from randomly permuted other days. Same approach geometry, zero information.
At each touch we measured the next 10 minutes of tape against a 30-minute baseline: volume intensity, aggressor-signed direction, intermarket sweeps, and the share of volume at the touched strike.
The result
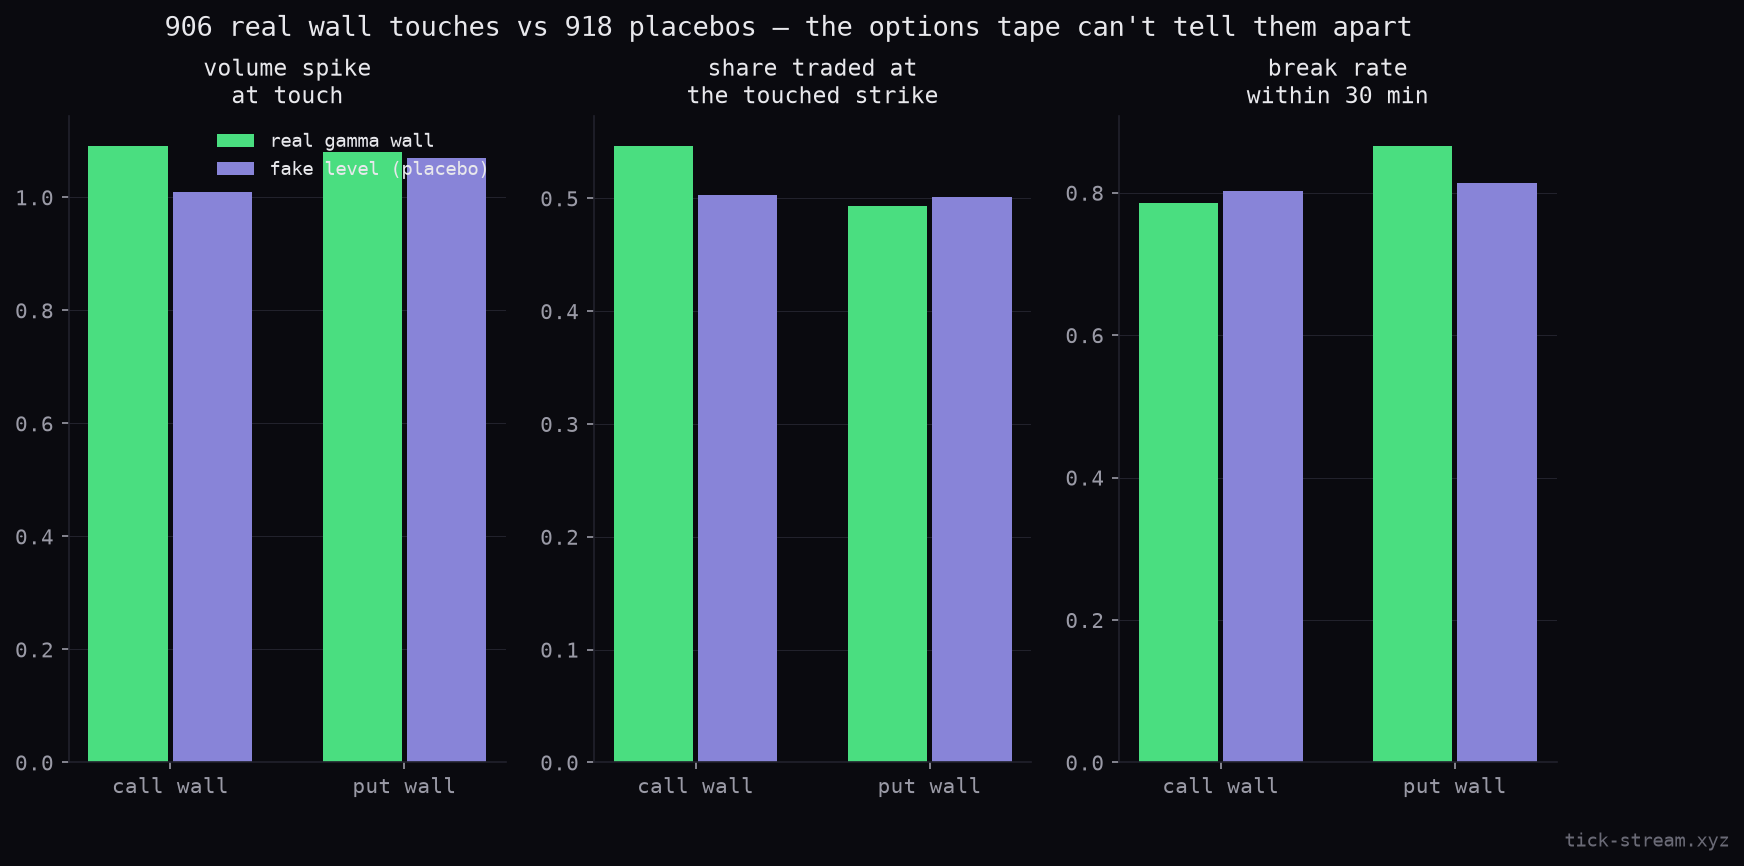
| Measure | Real wall | Placebo |
|---|---|---|
| Volume spike at touch | 1.08–1.09× | 1.01–1.07× |
| Sweep intensity | 1.05–1.09× | 1.01–1.08× |
| Share at touched strike | 0.46 → 0.55 | 0.43 → 0.50 |
| Broke within 30 min | 78.5% / 86.5% | 80.2% / 81.4% |
Nothing separates them. No volume burst that placebos don’t show. No sweep activity. And the finding that matters most for chart-readers: the strike-concentration jump — the thing that looks like defense on a tape screenshot — appears identically at fake levels. When price approaches any number, the nearest strike becomes ATM and trades the most. That’s the whole phenomenon.
The tradable version is just as dead: the direction of the flow shift at the touch predicts the next 30 minutes with an IC of −0.045, and the quartile spread runs backwards (p=0.38).
Bonus funeral: “it’s the CHANGE at the strike that matters”
A reader variant we heard the same week: the wall’s standing OI doesn’t matter — watch where open interest is freshly building. Tested ex-ante on 1,721 days (yesterday’s OI change, known before the open):
The biggest-build strike broke more often than placebo (84–86% vs 81%), and on the call side price moved through it more decisively than through a random level. Which makes economic sense once you say it out loud: fresh call OI builds where people are chasing a move that’s already happening. It’s momentum’s footprint — the herd’s forwarding address, not a wall.
What survives, every single time
The same dataset keeps reproducing one result: negative net gamma → ~40% larger rest-of-day range (220 vs 156 NQ points here — the seventh independent measurement). Gamma carries the day’s amplitude, not its map. We trade that regime live. We have never once been able to trade a level.
If someone shows you defense flow at a wall, ask for their placebo. Ours is above.
Methodology, data and the three prior wall tests: research index. The tape used here is available as an API.
Frequently asked questions
Do gamma walls act as support and resistance?
We've now tested this four independent ways on real data — price reaction at daily walls, at intraday moving walls, against mirror placebos, and now the options flow itself at the touch — and the answer is no every time. In this test, price broke through the real call wall within 30 minutes 78.5% of the time and through a same-distance fake level 80.2% of the time. That 2-point difference is noise. Walls do not hold price, and the tape shows no one defending them.
But I can see huge volume hit the tape when price reaches the wall — isn't that defense?
That's the most instructive finding. Yes, volume at the touched strike jumps (from 46% to 55% of prints in our data). But it jumps identically at placebo levels (43% to 50%). The mechanism is mundane: whatever price the underlying approaches, the nearest strike becomes at-the-money and trades the most. The 'defense' everyone screenshots is ATM mechanics, visible at any price whatsoever — a wall placed by a random number generator produces the same picture.
What about fresh OI build at a strike — 'watch where positioning is building, not where it sits'?
Tested, ex-ante, 1,721 days: the strike with the biggest overnight open-interest build broke MORE often than placebo levels (84–86% vs 81%), and on the call side price moved through it more decisively than through a random level (p=0.08 in the wrong direction for the thesis). Fresh OI build doesn't mark where the market will turn — it marks where the herd is chasing. Momentum's footprint, not a barrier.
Does that mean GEX data is useless?
No — it means it carries a different signal than levels-traders want. The one result that reproduces relentlessly (seven measurements now): negative net gamma predicts larger moves — about 40% more rest-of-day range in this dataset. Gamma tells you the day's amplitude regime, not where price stops. We trade that regime live; we've never been able to trade a wall.
How were the placebos constructed?
Distance permutation: each fake level sits on the same side of price as the real wall, at a wall-distance borrowed from a randomly chosen other day — same approach geometry, same era, zero information. Every level was mapped ex-ante (prior-day wall, prior-day futures/ETF ratio), touches detected on minute bars, and flow measured in the QQQ options tape in the 10 minutes after the touch versus a 30-minute baseline before it.