"The Daily Sweep" — 14 Years to Master, 60 Seconds to Explain, One Backtest to Kill
The viral pitch: read who's in control on the daily chart, wait for a fakeout against the trend after the New York open, confirm with a fair value gap, enter the pullback, target the previous day's level. We ran it on seven years of real NQ tick data: the full mechanic loses in every session, the 'high probability entry' wins 34.6% of the time — and the multi-timeframe structure read that 'works on every system' is directionally backwards on NQ. Trading against it made +$126k; trading with it lost the same.
The pitch has everything the genre demands: a 14-year apprenticeship compressed into sixty seconds, a “world record payout,” and thousands a week — “to this day.” The rules, faithfully transcribed: check the daily chart for who’s in control (higher highs and higher lows = buyers; lower highs and lower lows = sellers). Drop to the one-hour chart, wait for the New York open, and look for a fakeout — a break of a short-term level against the higher-timeframe trend. When a fair value gap forms right after, the trap is complete and both timeframes are aligned. Enter on the pullback into the gap, stop at the invalidation, target the previous day’s high or low.
Every clause of that is mechanical. So we mechanized it — seven years of real NQ trade prints, honest fills, $14.50 round trip — and ran it under our session rule: NY, London and Asia, plus cost stress.
The full mechanic: “high probability,” measured
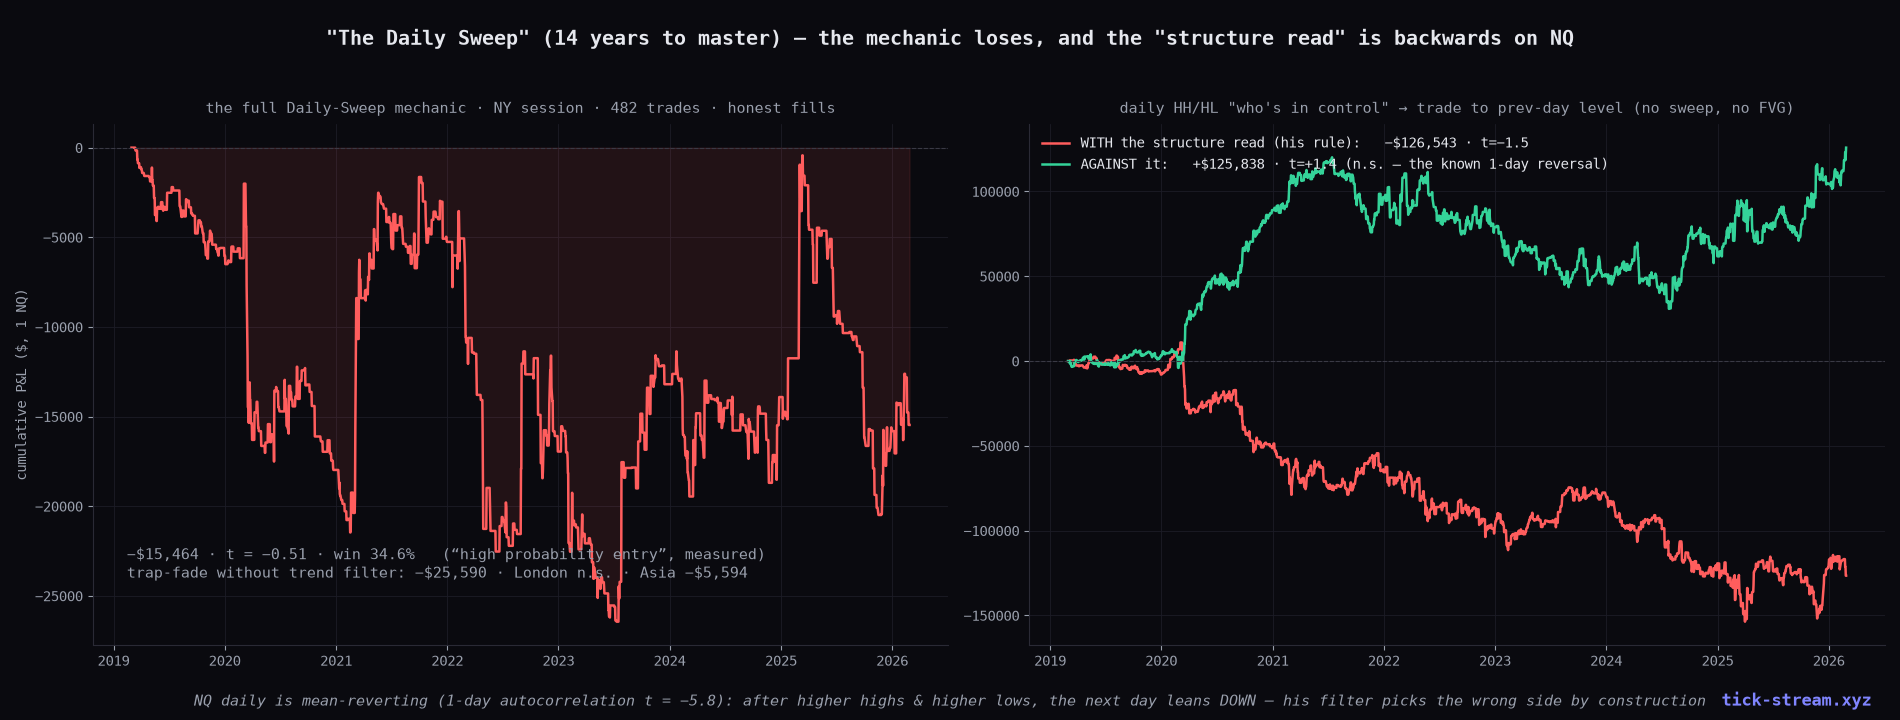
482 trades in the NY session over seven years: −$15,464, t = −0.51, win rate 34.6%. That last number deserves a frame: the entry sold as high probability — trap confirmed, timeframes aligned, precise pullback fill — resolves in the trader’s favor barely one time in three. The equity curve isn’t a blowup; it’s seven years of drift downhill through commissions and stopped-out “traps” that were, it turns out, just breakouts.
The robustness sweep left nothing to rescue: the trap-fade without the daily filter loses more (−$25,590 — the core mechanic is negative on its own), the 15-minute FVG variant almost never completes its setup at all, London is noise (+$4.6k, t = 0.25), Asia loses, and overnight-realistic slippage deepens everything.
The part worth the article: the “works on every system” claim
The viral clip ends with a second voice — a skeptic, even: “I don’t trade the ICT bullshit like he does, but that beginning portion with the structure and the trends in multiple timeframes — that works on every system.”
That is the most testable sentence in the video, because it isolates one ingredient: the daily HH/HL structure read. So we tested exactly that, with no sweep and no FVG: after two days of higher highs and higher lows, buy the open, target the previous day’s high (mirrored for downtrends).
With the structure read: −$126,543 over 1,034 trades (t = −1.5). Against it: +$125,838.
The ingredient praised as system-agnostic common sense is directionally backwards on NQ — and for a reason we’ve measured before, no mysticism required: NQ daily returns are mean-reverting (1-day autocorrelation t = −5.8 across a quarter-century of data). After an up-structure day, the next day statistically leans down. A filter that says “buyers are in control, look for longs” is systematically volunteering for the wrong side of that lean, then aiming at a target (the previous day’s high) that mean reversion actively pulls away from.
And the honest fine print, before anyone inverts the video and calls it alpha: the +$126k mirror trade is not a discovery. Its t-stat is 1.4 — not significant — and it’s simply the documented 1-day reversal effect, which our book already expresses through a validated mean-reversion sleeve. A backwards rule is not a forward edge; it’s usually a known effect wearing a costume, twice.
Filed under: components already tested
This claim is a bundle of parts we’ve tested individually: liquidity sweeps carried no signal, fair value gaps failed as entry triggers, session-sweep reversals died with a placebo control, and the single surviving idea in that entire canon — trend-pullback continuation — needs none of the vocabulary (our Slingshot sleeve trades it plainly, and its edge lives in the continuation, not in any retracement level or gap). The Daily Sweep assembles three non-working parts and a backwards filter into sixty confident seconds.
The scoreboard for the genre’s tells, updated: a biography instead of a distribution (“14 years,” “world record”), a win-rate adjective instead of a win rate (“high probability” = 34.6%), and — as always — no control group. The control group is where this one died twice.
Methodology: NQ, 2019-03 → 2026-02, 1-minute bars from real trade prints (quote-rule aggressor, documented provenance), 5-minute FVG logic, hourly levels from continuous 23h bars. Daily structure from RTH daily OHLC (two-day HH/HL / LH/LL). Fills: trade-through limits into the gap, stop-priority, targets from the bar after entry, 2-tick adverse slip on stops/time exits, $14.50 RT. One trade per day, first valid setup after the session open. Session coverage per house rule: NY / London / Asia, cost stress +1/+2 ticks. Controls: inverted daily filter, no-filter trap-fade, structure-only baseline both ways. Scripts and daily P&L series archived.
Frequently asked questions
Does the 'Daily Sweep' strategy work?
Not in our test. Implemented faithfully on seven years of real NQ tick data — daily higher-highs/higher-lows filter, post-NY-open fakeout against the trend, 5-minute fair-value-gap confirmation, limit entry on the pullback into the gap, stop at the sweep extreme, target at the previous day's level — it lost $15,464 over 482 trades (t = −0.51). The 'high probability entry' won 34.6% of the time. It also failed in London and Asia sessions, and extra slippage only deepened the loss.
Does the daily higher-highs/higher-lows structure read work as a trend filter?
On NQ it is directionally backwards. Isolating just that ingredient — after two days of higher highs and higher lows, buy the open and target the previous day's high (mirrored for downtrends) — lost $126,543 over 1,034 trades (t = −1.5). Inverting it made +$125,838. The reason is measured, not mystical: NQ daily returns are mean-reverting (1-day autocorrelation t = −5.8), so after an up-structure the next day leans down. 'Who's in control' picks the wrong side by construction.
So should I trade against the daily structure instead?
No — that's the honest fine print. The inverted read (+$126k) carries a t-stat of 1.4, which is not significant, and it is simply the well-known 1-day mean-reversion effect, which our own book already expresses through a validated sleeve. Discovering that a viral rule is backwards does not mint a new edge; it usually just rediscovers a documented effect with extra steps.
Do liquidity sweeps and fair value gaps add anything as entry triggers?
In this construction they subtract. The trap-fade mechanic without the daily filter lost $25,590 on its own; adding the trend filter changed which losing trades were selected. This matches our earlier component-level tests of the same canon: liquidity sweeps had no predictive value, order blocks and fair value gaps failed as entries, and the one thing that survived — trend-pullback continuation — works without any of the terminology.
Was this tested outside the New York session?
Yes — per our house rule, every intraday claim now runs on Asia, London and NY on full 23-hour Globex bars. The Daily Sweep lost in NY (−$15.5k), lost in Asia (−$5.6k) and was statistical noise in London (+$4.6k, t = 0.25). There is no session in which the mechanic has been profitable over seven years.