"The Setup I Use Live Every Day": We Backtested the Decelerating Support Bounce on 7 Years of NQ
A popular stream setup: at support, wait for the down-candles' bodies to shrink, take the first green candle with a bottom wick, stop below the wick, take profit at 20 pips. It looks clean and it wins often. We mechanized it exactly and tested it across five timeframes on 7 years of NQ. It loses on every one — 1-min to 60-min — and the 61% win rate on the higher timeframes is the trap, not the edge. The specific pattern doesn't even beat buying any green candle after a down-move.
This one came from a trading stream, narrated live: “the easiest setup I use every single day.” At a support level, watch a down-move where the candle bodies get smaller — momentum weakening. Wait for one green candle to close. Take the first green candle that also prints a bottom wick, buy at its close, put the stop below the wick, and take profit at 20 pips. On the clip it fills, runs, and hits full take-profit. Clean.
It’s also completely testable — shrinking bodies, a green flip, a bottom wick, a stop, a fixed target — so we mechanized it exactly and ran it across five timeframes on 7 years of NQ, with honest fills (entry at the candle’s close, stop-before-target managed on the 1-minute tape) and real costs. One stat judges everything: t — how far the average day sits from zero relative to its noise; |t| > 2 is real.
It loses on every timeframe
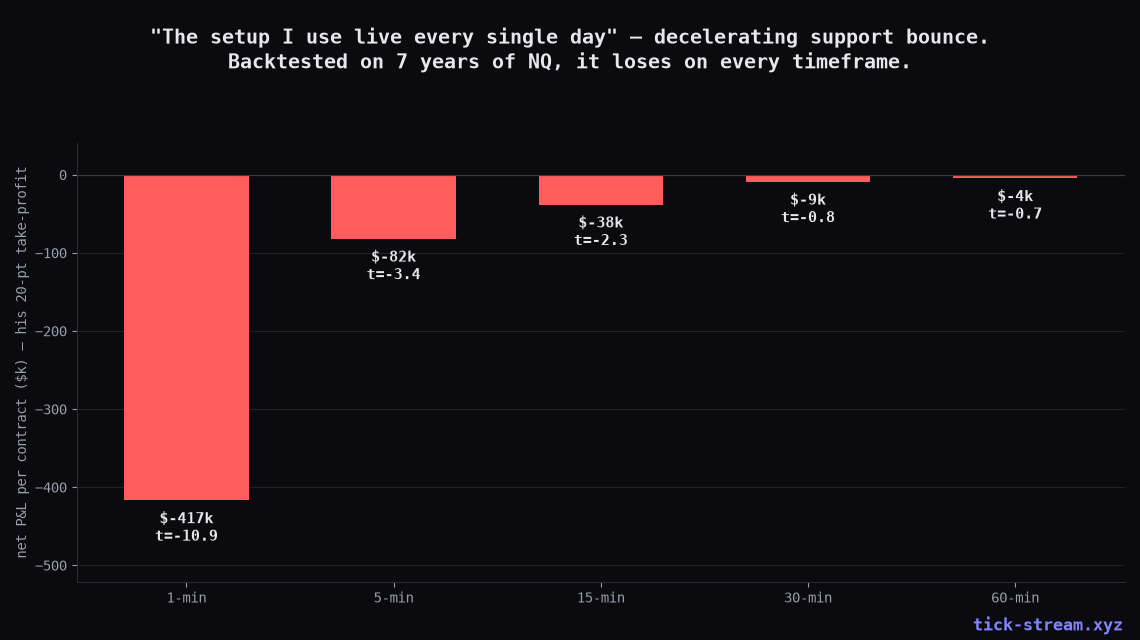
1-minute: −$417,000 per contract, t = −10.9. 5-minute: −$82k. 15-minute: −$38k. 30-minute: −$9k. 60-minute: −$4k. Every timeframe, every year mostly red. The lower the timeframe, the worse — because on the 1-minute chart, “buy the first green candle after a down-move” is just buying into a downtrend, over and over, and getting stopped.
The 61% win rate is the trap
Look at the higher timeframes and you’ll see why the setup feels like it works on a stream:
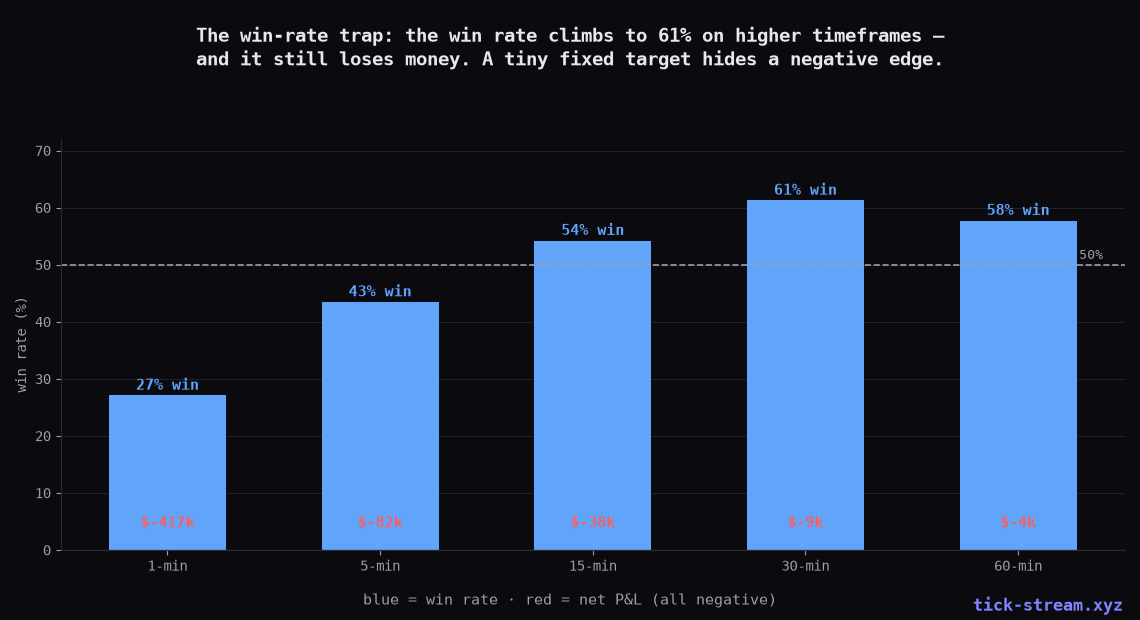
The win rate climbs from 27% on the 1-minute to 61% on the 30-minute — most trades win. And it still loses money on all of them. Here’s the arithmetic the stream doesn’t show you: the take-profit is a fixed 20 points, but the stop sits below the signal candle’s wick — 30 to 40 points away on the higher timeframes. So each loss is roughly twice the size of each win. At a 1:2 payoff, you need to win 67% just to break even; 61% loses. Win rate is something you can dial to almost any number by shrinking the target and widening the stop. It is not evidence of an edge. Expectancy is — and it’s negative. This is the exact same trap we measured on the “88% win-rate” wickless candle setup: a beautiful hit rate manufactured entirely by the exit.
The pattern doesn’t beat “any green candle”
Maybe the magic is in the specific conditions — the shrinking bodies, the bottom wick? We tested that directly by stripping them out one at a time:
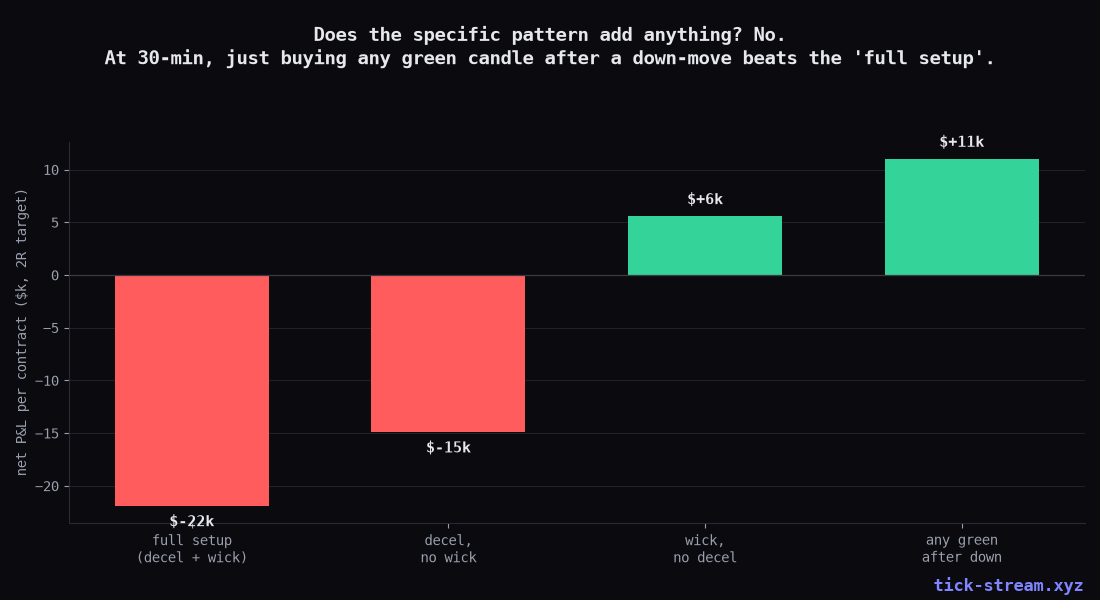
On the 30-minute chart, simply buying any green candle after a down-move nets about +$11k. The full setup — decelerating bodies and a bottom wick — nets −$22k. The special conditions don’t add signal; they shrink the sample and, if anything, make it worse. We even gated the whole thing to fire only at a genuine support — the prior-day low or a multi-day swing low. It still lost on every timeframe. The “support” wasn’t the edge either, which matches everything else we’ve found: levels react at base rate.
Why the wick fools you here (but not always)
We’re on record saying “the wick is the value.” So why does requiring a bottom wick lose money here? Context. In an uptrend pullback, a wicked low means buyers stepped in and defended a level with the trend behind them — that’s a real effect, and it’s what our live Wickline sleeve trades, validated on the same 7 years. Here the identical candle shape appears in a down-move reversal — you’re catching a falling knife against the immediate trend. Same shape, opposite meaning. The setup borrows the aesthetics of a real edge (a rejection wick) and points it the wrong way.
The honest takeaway
A setup can win most of its trades, look effortless on a live stream, and still bleed money — because the win rate was engineered by a tiny target, and the entry itself carries no edge for that target to harvest. Before you trust any “I use it every day” setup, ask two questions the stream never answers: what is the average loss versus the average win (if a loss is twice a win, 60% winners is a losing strategy), and has the pattern ever been compared to doing nothing special (here, buying any green candle beats it). Both are one backtest away, and both are the difference between a clip that looks great and a strategy that survives.
Methodology: NQ front-month, 2019–2026, RTH, 1/5/15/30/60-minute bars resampled from the 1-minute tape. Down-move = 3 prior candles net lower with ≥2 red; deceleration = shrinking absolute bodies; entry = first green candle with a bottom wick, filled at its close; stop 1 tick below its low; take-profit fixed 20 points (2R and 3R also tested). Management on 1-minute bars, stop-before-target; $14.50 RT + 1 tick slippage; support-filter and pattern-control variants as described. Per single contract. Research, not advice; our live, disclosed track records — including the winners — are on /algos.
Frequently asked questions
Does the decelerating support-bounce setup work?
Not on 7 years of NQ. Mechanized exactly — a down-move with shrinking candle bodies, then the first green candle with a bottom wick, entry at its close, stop below the wick, take-profit at the fixed target — it loses on every timeframe we tested: 1-minute −$417k per contract (t=−10.9), 5-minute −$82k, 15-minute −$38k, 30-minute −$9k, 60-minute −$4k. The higher timeframes look better only because the fixed small target inflates the win rate, not the expectancy.
But the win rate is over 60% — how does it lose money?
That's the trap. With a fixed 20-point take-profit and a stop placed below the signal candle's wick (30–40 points away on the higher timeframes), each loss is roughly twice each win. A 61% win rate at a 1:2 payoff still loses money. Win rate is a free parameter you can dial up by shrinking the target and widening the stop; the number that can't be gamed is expectancy, and here it's negative. It's the same geometry as the '88% win-rate' wickless setup we debunked — a high hit rate engineered by the exit, not evidence of an edge.
Does the specific pattern (deceleration + bottom wick) add anything?
No — it subtracts. On the 30-minute chart, simply buying any green candle after a down-move nets about +$11k, while the full 'decelerating bodies + bottom wick' pattern nets −$22k at the same target. The extra conditions filter the sample down without adding directional information, and where they change the result they make it worse. We also required the setup to occur at a genuine support (prior-day low or a multi-day swing low) — it still lost on every timeframe.
Isn't the bottom wick supposed to be bullish? You've said 'the wick is the value.'
Context is everything. In an UPtrend pullback, a wicked low means buyers stepped in and defended a level — that's a real, tradeable effect (our live Wickline sleeve trades exactly that, and it's validated). Here the wick appears in a DOWN-move reversal — trying to catch a falling knife against the immediate trend. The same candle shape means opposite things depending on whether you're trading with the trend or against it. Buying green candles into a downtrend on the 1-minute chart is why that timeframe lost $417k.
Would a different take-profit or stop make it profitable?
We tested the fixed 20-point target plus 2R and 3R variants across all five timeframes, with and without a support filter. None were positive with statistical significance; the best case (15-minute at support, 2R) was essentially breakeven-to-losing at t=−0.11. Changing the exit moves the win rate around but doesn't create expectancy, because the entry — a counter-trend green candle after a down-move — carries no directional edge for it to harvest.