Wickless Candle Strategy: We Backtested the '88% Win Rate' Claim on 7 Years of NQ
A viral entry model: find a candle with no bottom wick in an uptrend, mark it, buy the retest — claimed 88–90% win rate, 'changed my life'. We mechanized it exactly, on 7 years of NQ with conservative fills and real costs. The 88% win rate is real. It loses money. And the placebo test is brutal: ordinary candle lows WITH wicks beat the 'magic' wickless levels — the wick is the value.
The video has millions of views and a one-minute pitch: candle with no bottom wick, price comes back, taps it, pumps. Add the free indicator, mark the wickless candles with the trend, buy the retest — “close to a 90% win rate”, “completely changed my life.”
Unlike most viral setups, this one is fully specified, which means it can be tested instead of debated. So we mechanized it exactly — 7 years of NQ, 5-minute bars, EMA-50 trend filter, retest limit entry, conservative fills (stop checked before target, target only from the bar after the fill), $14.50 round-trip costs — and, because levels must always answer “compared to what?”, we ran the identical machine on ordinary candle lows with normal wicks as the placebo.
One stat judges everything: t (the t-statistic) — how far an average sits from zero relative to its own noise; |t| > 2 is real, less is luck.
The 88% win rate is real. It loses money.
The video never states an exit, but 88% win rates come from one place: a small target against a wide stop. With TP = 0.25×ATR and SL = 3×ATR the mechanized strategy prints:
87.1% winners — and −$60,880 per contract, profit factor 0.66, t = −3.6.
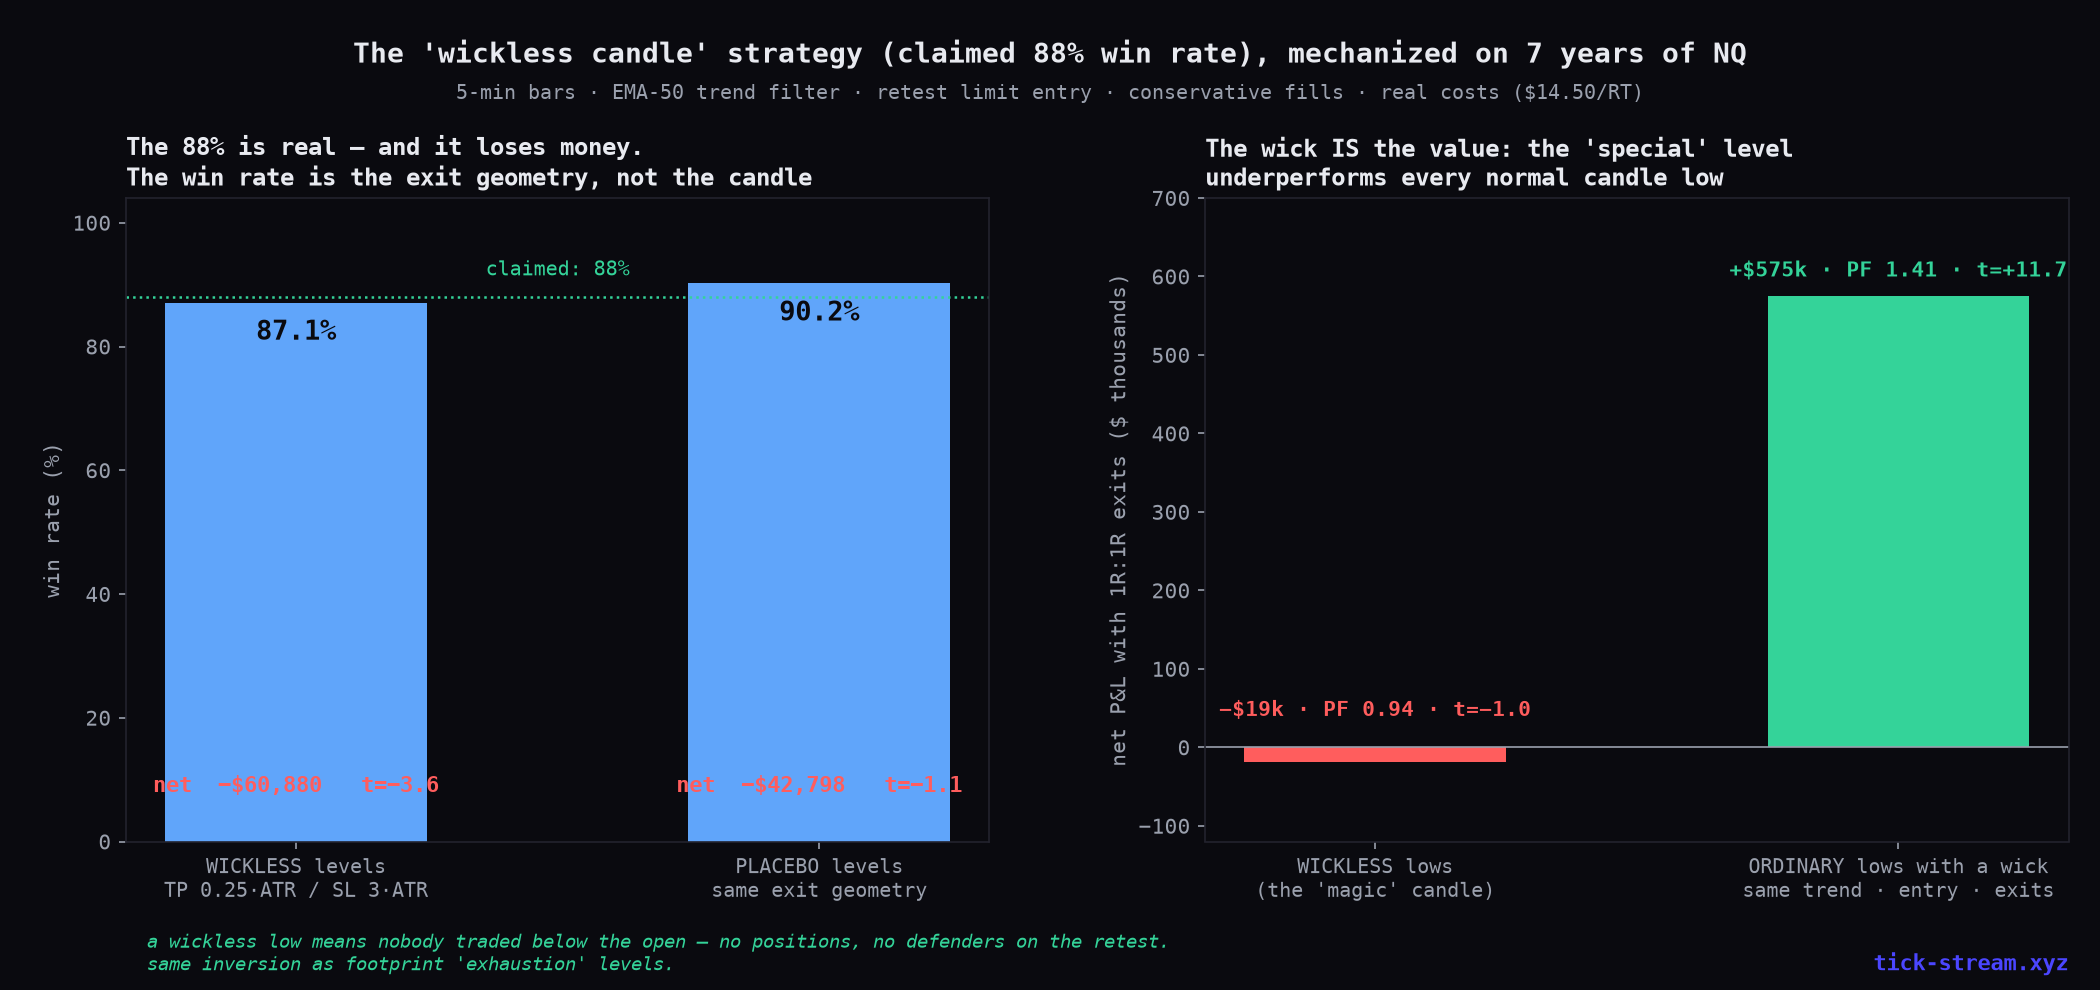
That’s not “unprofitable”; that’s a statistically reliable loser. Each rare stop-out costs twelve wins. And the placebo tells you the win rate was never about the candle: ordinary wicked lows with the same exit geometry win 90.2% — more than the magic candle — and also lose money. Win rate is an exit-geometry dial, not evidence of an edge. We’ve measured this trap before on the “81% win rate” opening-range fade; it’s the most effective sales trick in retail trading because the number is technically true.
The placebo is the real story: the wick IS the value
Give both level types honest, balanced exits (1R:1R on ATR) and compare like-for-like:
| Level type (same trend filter, entry, exits) | Trades | Win | Net | PF | t |
|---|---|---|---|---|---|
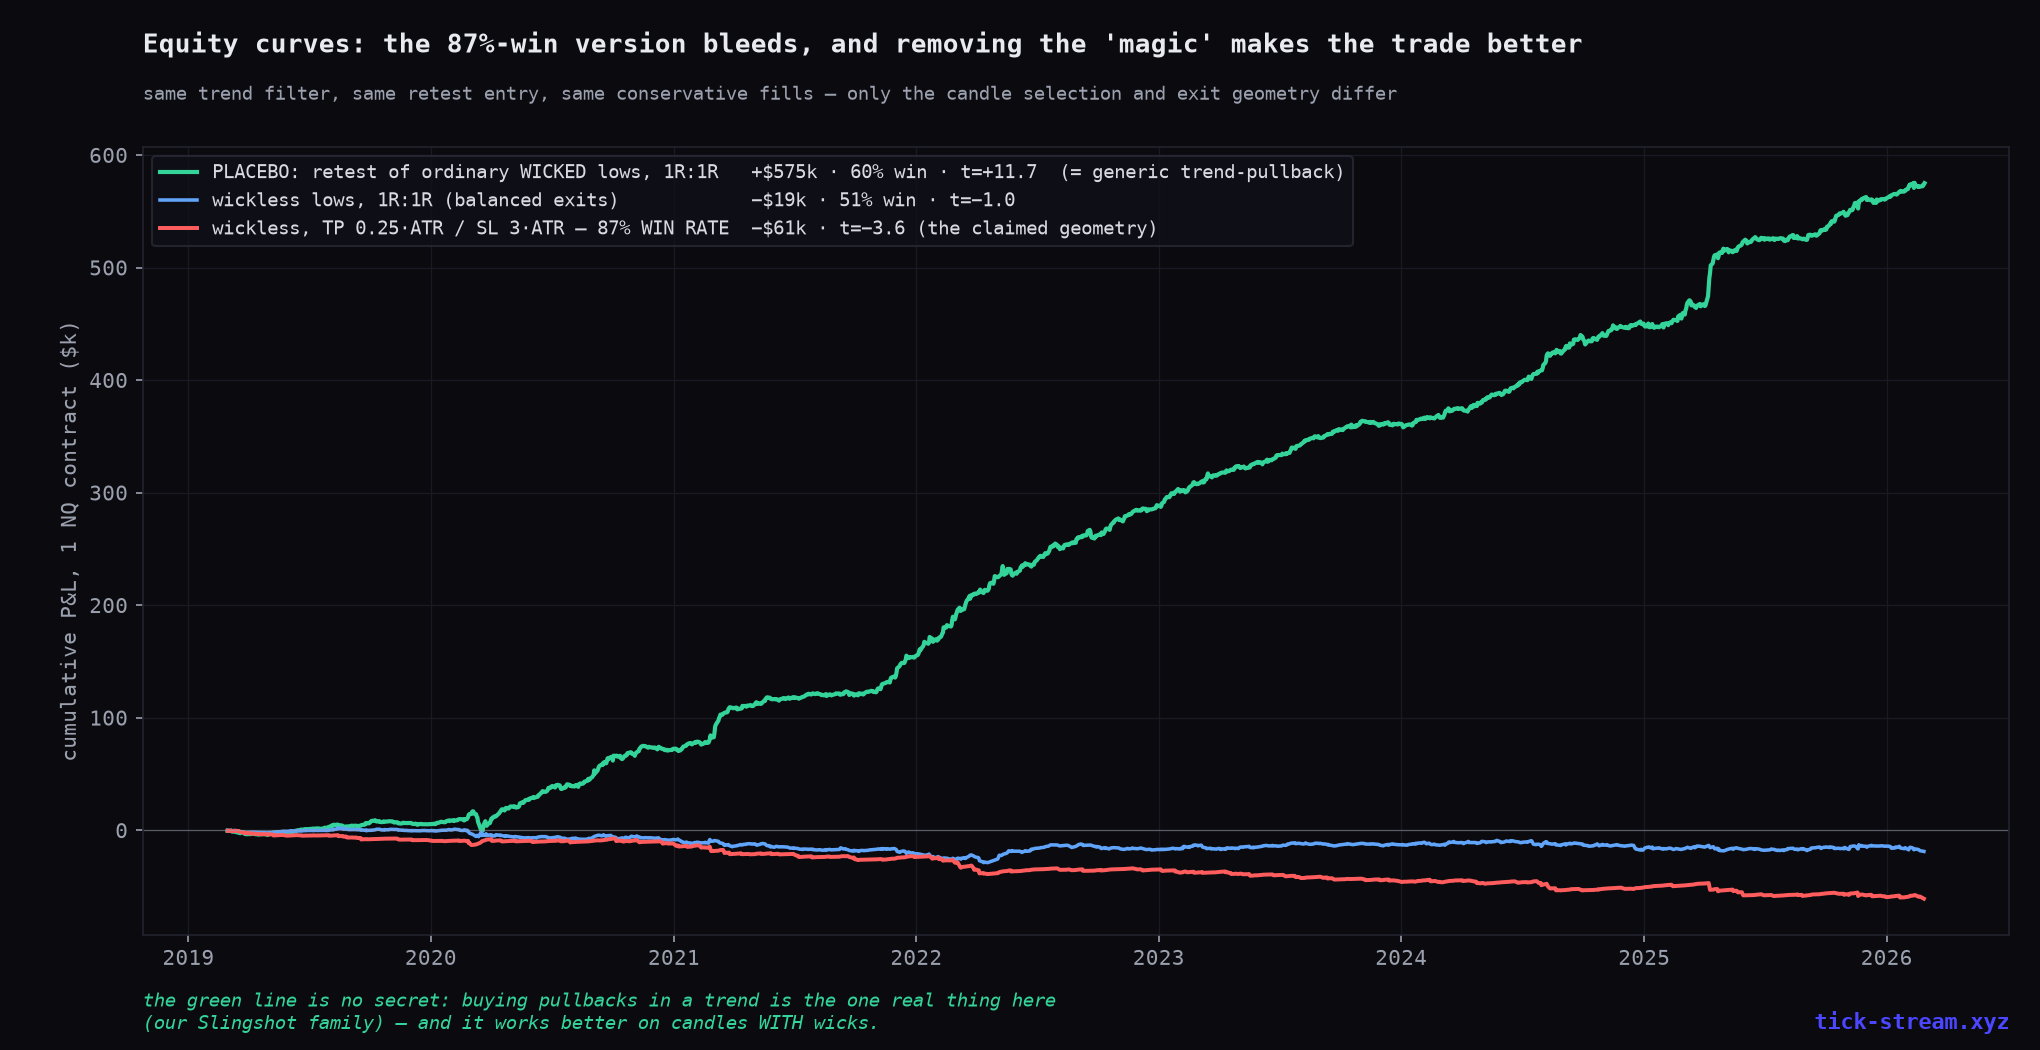
| Wickless lows (the “magic” candle) | 1,676 | 51.3% | −$18,877 | 0.94 | −1.0 |
| Ordinary lows with a wick | 7,945 | 60.3% | +$574,932 | 1.41 | +11.7 |
The “special” candle doesn’t just fail to add value — it subtracts it. Same picture on 15-minute bars (wickless t = +0.4 noise; wicked lows t = +5.1).
Why would the cleanest-looking level be the worst one? The same mechanical reason we found when we tested footprint “exhaustion” prints: a wickless low means essentially nothing traded below that candle’s open. No volume changed hands there; no positions were built; nobody has anything to defend when price returns. The retest thesis assumes defenders at precisely the price where the candle itself proves they’re absent. Untouched-looking levels hold worse, not better — we’ve now measured that inversion three independent ways.
What the video got right by accident
The green line in the equity chart is not a new secret: buying pullbacks to recent lows in an uptrend is generic trend-pullback continuation — the one intraday effect that keeps surviving our tests under different brand names. It’s the honest core of ICT’s “OTE” (the Fibonacci level isn’t magic, the continuation is), and it’s what our live Slingshot sleeve trades with proper exits and a public track record. The viral strategy stumbled onto that real effect — then filtered it down to the one candle type where the effect is weakest and wrapped it in an exit geometry that manufactures a win rate.
Update: we validated the placebo — and put it on the live board
The comparison line was too interesting to leave as a footnote, so we ran the placebo through the full validation battery: trade-through limit fills (the limit only counts as filled when price trades a tick through it) plus doubled exit slippage still test at t = +10.3; the R:R × wick × trend-filter grid is a ridge (every sensible cell t = +3.8 to +13.3); both sides are positive (longs t = +9.1, shorts t = +6.3 — rare on NQ); every calendar year is green with 2022 the best; max drawdown $17k against +$544k net; correlation to NQ direction −0.04, and to Slingshot — its trend-pullback sibling — only +0.20 (residual Sharpe 3.5 after regressing Slingshot out).
So the placebo is now a live paper algo: Wickline, on the board, unchanged from the validated rules. A strategy born inside a debunk — the forward test will tell us if it deserves to stay.
The two questions that would have caught it
- What does a loss cost versus a win? 88% wins with 12:1 loss-to-win sizes is breakeven arithmetic dressed as mastery.
- Compared to what? If a level claim has never been run against an ordinary level, it hasn’t been tested at all.
Methodology: NQ continuous front-month, 5-minute RTH bars 2019–2026 built from real trade prints (15-minute robustness check included). Setup: bullish candle with zero bottom wick while close > EMA-50 (mirror for shorts); level = candle low; entry = limit at the level on first touch within 4 hours, level cancelled on a close through it; one position at a time. Exits: TP/SL in ATR(14) multiples as stated; stop checked before target on every bar, target valid only from the bar after the fill; all stop/time exits debited 2 ticks; $4.50 commission per side. Placebo: identical logic on bullish candles WITH a bottom wick (≥20% of body). t-stats on daily-aggregated P&L; 2019–23 train / 2024–26 holdout checked throughout.
Frequently asked questions
Does the wickless candle strategy actually work?
Not on 7 years of NQ futures. Mechanized exactly as taught (wickless candle in a trend, mark the level, enter on the retest), it lost money in every exit configuration we tested: balanced 1R:1R exits lost $19k per contract (profit factor 0.94), a 2R target lost $11k, and the tiny-target/huge-stop geometry that produces the famous win rate lost $61k with a t-statistic of −3.6 — a statistically reliable loser. The result is the same on 5-minute and 15-minute charts.
Is the 88% win rate real?
Yes — and that's the trap. With a take-profit of 0.25× ATR against a stop of 3× ATR, our backtest hit 87.1% winners, right at the claimed number. It still lost $61k, because each rare loss is twelve times the size of a win. Win rate is a free parameter: you can dial almost any strategy to 90% winners by shrinking the target and widening the stop. The number that can't be gamed is expectancy — and it's negative.
Do wickless candles mark special support levels?
The opposite, measurably. We ran the identical trend filter, retest entry and exits on ordinary candle lows — ones WITH a normal bottom wick. Those earned +$575k (profit factor 1.41) where the wickless levels lost $19k. There's a clean mechanical reason: a candle with no bottom wick means essentially nothing traded below its open — nobody built positions there, so nobody defends that price on the retest. It's the same inversion we measured on footprint 'exhaustion' levels: the more 'untouched' a level looks, the worse it holds.
Why did the placebo (normal candle lows) make money?
Because buying pullbacks to recent lows in an uptrend is generic trend-pullback continuation — the one robust intraday edge we keep finding under different costumes (it's also the real core of ICT's 'OTE', minus the Fibonacci story, and the basis of our live Slingshot sleeve). The viral strategy accidentally sits on top of a real effect and then subtracts value with its 'magic' candle filter. Gross numbers at 5-minute scale still deserve caution on execution, but the comparison is like-for-like: the wickless filter makes the same trade worse.
How do you spot a win-rate-trap strategy?
Ask two questions. First: what's the average loss versus the average win? If the claimed win rate is 88% but a loss is 10–12 times a win, expectancy is roughly zero before costs and negative after. Second: was the level tested against a placebo? If 'it bounces off my level' has never been compared to a random level or an ordinary candle low, the claim is untested. Every high-win-rate level strategy we've put through those two questions on real data has failed at least one.