A Viral Order-Flow Strategy Promised 50–100 Point Reactions. Random Levels Deliver the Same.
The strategy had everything: GEX and COT for the narrative, three-month composite-profile high-volume nodes with delta spikes for location, absorption-then-initiation on the footprint for the trigger — and one memorable promise: 'at least a 50–100 point reaction on Nasdaq' when price comes back to a level. We mechanized the whole stack on 7 years of NQ tick data and ran it against randomly placed levels. The 50-point reaction is real — at any price you pick. It's a base-rate illusion, and it's the most common trick in trading content.
The pitch came with all the vocabulary. Five years mastering order flow. GEX plus the COT report to “establish the narrative” and locate dealer positioning. A three-month composite profile for location — high-volume nodes combined with “huge delta spikes.” And the promise that makes the whole thing feel bankable: when price comes back to one of those levels, “there is a high likelihood we’re going to have at least a 50–100 point reaction on Nasdaq.” Entries via absorption first, then initiation — cumulative delta, delta flips, footprint charts, all of it.
Unlike most trading-guru content, almost every word of that is mechanizable. We have seven years of NQ tick data with the real aggressor side, the volume-at-price history to build his composite profiles, and — the part that settles arguments — the ability to run the identical test at levels that shouldn’t matter at all.
One stat does the judging: t (the t-statistic) measures how far an average sits above zero relative to its own noise — |t| above 2 is a real effect, between −2 and +2 is noise.
The test
- His levels: 63-trading-day (≈3-month) composite volume profile, rebuilt every session with no lookahead; local high-volume-node peaks, filtered to those with the largest aggressive-delta concentration nearby (“HVN combined with huge delta spikes”). First touch per session, and only if the level was at least 30 points away from the open — his “if we come back there.”
- The reaction: maximum bounce off the level, in the rejection direction, within the next two hours. His claim: ≥50–100 points, “high likelihood.”
- The control: the exact same levels, randomly shifted by 29–70 points — prices with no volume story whatsoever — same touch logic, same measurement, same sample size.
1,767 sessions. 570 real touches, 584 placebo touches.
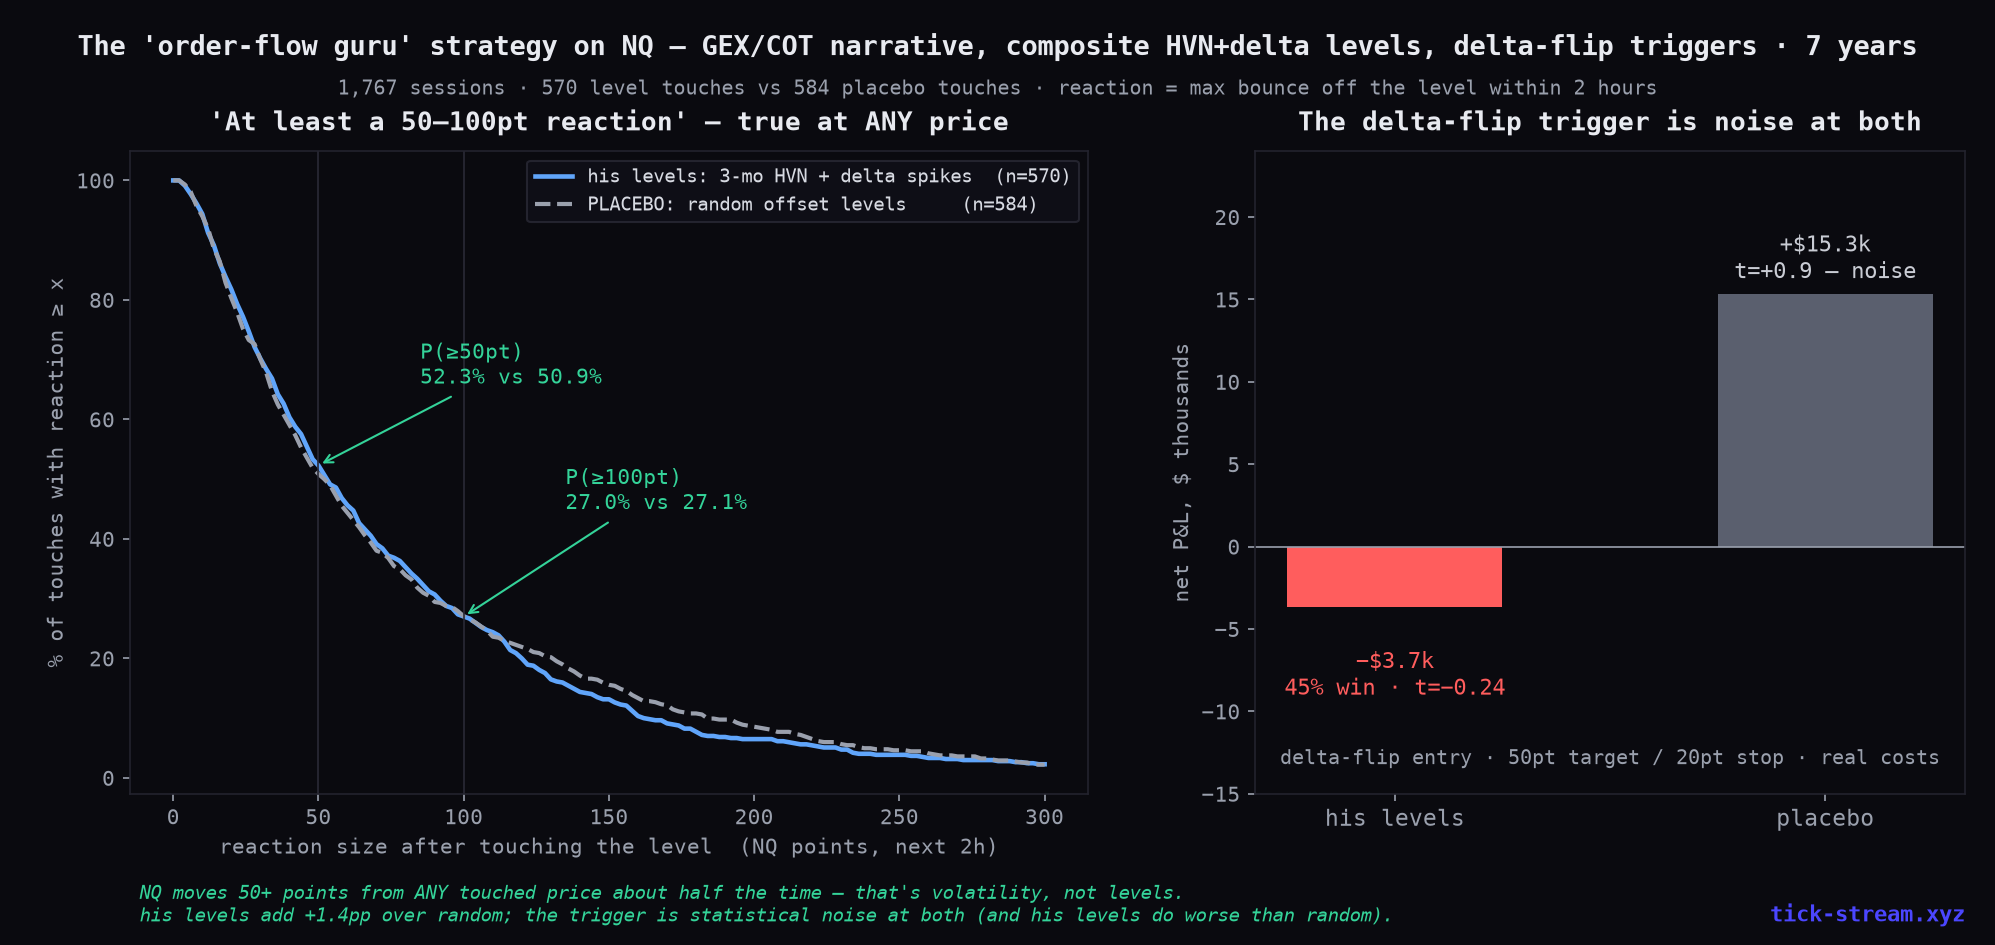
The 50-point reaction is real — at any price
| His levels | Placebo levels | |
|---|---|---|
| Median reaction | 53.2 pt | 51.9 pt |
| P(reaction ≥ 50 pt) | 52.3% | 50.9% |
| P(reaction ≥ 100 pt) | 27.0% | 27.1% |
| Mean move through the level | 90 pt | 91 pt |
The two distribution curves in the left panel lie almost on top of each other. NQ produces a “50-point reaction” from any touched price about half the time, within two hours — that’s what index volatility is. His painstakingly constructed levels add roughly one percentage point over prices chosen by a random-number generator. And at both — his and random — price travels through the level (90 points on average) more than it bounces off it.
This is the base-rate illusion, and it’s the most effective trick in trading content, because it isn’t even a lie. Every time this trader looks at his chart, the claim confirms itself: price touched his node, and look — a 60-point reaction. What he never sees (and never shows) is that the price 50 points below his node produced the same reaction statistics. A claim that is true everywhere feels like mastery and contains nothing.
The trigger doesn’t rescue it
Maybe the levels are just context, and the money is in the entry — absorption, then initiation. We mechanized that too: after a touch, wait for aggressive delta to flip in the bounce direction (the “initiation”), enter, 50-point target, 20-point stop, real costs.
- At his levels: −$3,660 over 279 trades. 45% win rate, t = −0.24.
- At placebo levels: +$15,322. t = +0.9.
Read that twice: the random levels came out ahead — and neither number is statistically distinguishable from zero. That’s the entire five-year edge: a coin flip whose outcome doesn’t depend on the levels at all. This matches everything the order-flow family has shown us across twelve indicators, footprint exhaustion and volume confirmation: delta and absorption describe the fight that already happened. They don’t tell you who wins the next one.
As for the narrative layer — GEX and COT: we’ve tested both as directional inputs. Gamma walls get absorbed rather than respected, and COT is real information at a weekly rhythm (we trade it live at that horizon) with nothing to say about which intraday level bounces today. In strategies like this one, the narrative’s job isn’t prediction — it’s making the trader feel like the trade was reasoned.
The one question that exposes all of it
Whenever someone shows you a level — volume node, gamma wall, order block, value-area edge — and a reaction, ask: compared to what? Run the identical measurement at a price 50 points away with no story attached. In seven years of NQ data, every level-based claim we’ve put through that filter — value areas, gamma walls, rejection blocks, exhaustion prints, and now three-month composite HVNs with delta spikes — has failed to beat its own placebo. The market doesn’t remember prices the way the charts make it look. The volatility that “reacts” at your level was going to be there anyway.
Methodology: NQ 2019–2026. Composite profile = trailing 63-day volume-at-price from real trade prints (rebuilt daily, no lookahead), smoothed HVN peaks filtered by aggressive-delta concentration; aggressor side inferred with the quote rule against the prevailing bid/ask. Touch events: first touch per level per session, level ≥30 pt from the session open. Reaction = max excursion in the rejection direction within 120 minutes. Placebo: identical logic at the same levels offset randomly by 29–70 pt. Trigger: delta-flip entry within 15 min of touch, 50 pt target, 20 pt stop, $14.50 per round trip, daily-aggregated t-stats.
Correction note (2026-07-03): the first version of this study computed volume-at-price and delta from a mis-read field in our raw tape (bid/ask quote updates counted as signed trades). We rebuilt the profiles and delta from the actual trade prints and re-ran everything. The conclusion got stronger, not weaker: the reaction edge over placebo shrank from ~3pp to ~1pp, and the delta-flip trigger now loses at his levels while placebo levels randomly win — pure noise either way.
Frequently asked questions
Do high-volume nodes from a composite profile produce big reactions?
Yes — and so does every other price. In our test of 570 touches of 3-month composite HVN + delta-spike levels on NQ, 52.3% produced a reaction of 50+ points within two hours. But 584 touches of PLACEBO levels — the same levels randomly shifted by 29–70 points — produced a 50+ point reaction 50.9% of the time. The levels add about 1 percentage point over pure chance. A '50-point reaction' is simply what NQ's intraday volatility does from any price, half the time.
What is a base-rate illusion in trading?
A claim that feels constantly confirmed because it's true everywhere, not because the method works. 'My levels produce at least a 50-point reaction' sounds specific and verifiable — and every time you watch, it happens. But if a 50-point move within two hours happens from any touched price about half the time, the level contributed nothing; the volatility did. The only way to expose it is to measure the same claim at random prices — the control group almost no trading content ever shows.
Does the absorption-then-initiation trigger work at volume levels?
Not in our test. We mechanized it as a delta-flip entry (aggressive volume flipping in the bounce direction within 15 minutes of the touch), 50-point target, 20-point stop, real costs. At the real HVN+delta levels it lost $3.7k over 279 trades (45% win rate, t = −0.24); the identical trigger at placebo levels happened to make +$15.3k (t = +0.9) — statistical noise on both sides, and his levels didn't even beat prices from a random-number generator. Order flow told us, once again, what was happening — not what would happen next.
Is GEX and COT positioning useful as a daily narrative?
As tradable intraday direction, we haven't found it. We tested gamma walls (price is drawn to and pins at strikes — the honest result: the levels get absorbed, not respected) and COT positioning (real information, but it moves at a weekly rhythm — it's one of our live strategies at the WEEKLY horizon, useless for picking intraday level reactions). 'Narrative' layers in these strategies mostly serve to make the trader feel prepared; the entries live or die on the level-and-trigger mechanics, which is what we tested.
How do you test whether a price level actually matters?
Compare it against the same test at prices that should NOT matter. Take every touch of your level, measure your outcome (reaction size, rejection rate, trade P&L) — then rerun the identical measurement at placebo levels offset by a random amount, matched in count and time. If your levels don't clearly beat the placebo, the 'edge' was the market's base rate wearing your level's clothes. Every level-based claim we've tested this way on NQ — value areas, gamma walls, rejection blocks, exhaustion prints, and now composite HVNs — has failed to beat its placebo.