Footprint Order-Flow Exhaustion: We Tested 187,018 Events — the Retest Claim Is Backwards
Footprint traders circle the '6 | 0' prints at a swing extreme and call it exhaustion: buyers are done, price reverses, and when price retests that level it rejects again. We built footprints from 7 years of real NQ trade prints (aggressor via quote rule against the prevailing bid/ask) and tested 187,018 events against a control group. The reversal is real — and worth less than the round-trip costs. And the retest claim isn't just unproven, it's inverted: exhaustion levels hold WORSE than ordinary swing levels.
Every footprint-trading course has this slide. An up-move stalls, and at the very top of the bar the ask column prints almost nothing — the circled 6 | 0. Buyers are exhausted. Price reverses. Then the follow-up claim, which is where the money is supposed to be: when price later retests that exhaustion level, it rejects again — the level becomes support/resistance you can trade against.
It’s a beautiful story, and unlike most chart folklore it’s actually testable — if you have the right data. Footprints can’t be built from candles; you need every trade with its real aggressor side (was it a market buy lifting the offer, or a market sell hitting the bid). We have seven years of NQ exactly like that — every trade print plus the prevailing bid/ask, so each trade’s aggressor side is recovered with the standard quote rule. From it we rebuilt the whole thing mechanically: 677,628 one-minute footprint bars, and from them 187,018 events.
One stat does the judging: t (the t-statistic) measures how far an average sits above zero relative to its own noise — |t| above 2 is a real effect, between −2 and +2 is noise.
The test — with the control group most backtests skip
- Exhaustion event (n = 51,569): a fresh trailing swing extreme (highest high or lowest low of the last 10 minutes) whose extreme price level printed ≤ 2 contracts of aggressive volume — the mechanical version of the circled zero-print.
- Control event (n = 135,449): the same fresh swing extreme, but with normal-to-heavy prints at the extreme. Same market, same moment type, no exhaustion.
The control group is the whole point. Without it, any profit you measure might belong to “price just made a 10-minute extreme” rather than to the footprint. With it, we can isolate exactly what the exhaustion print adds.
Finding 1: the reversal is real — and worth less than the costs
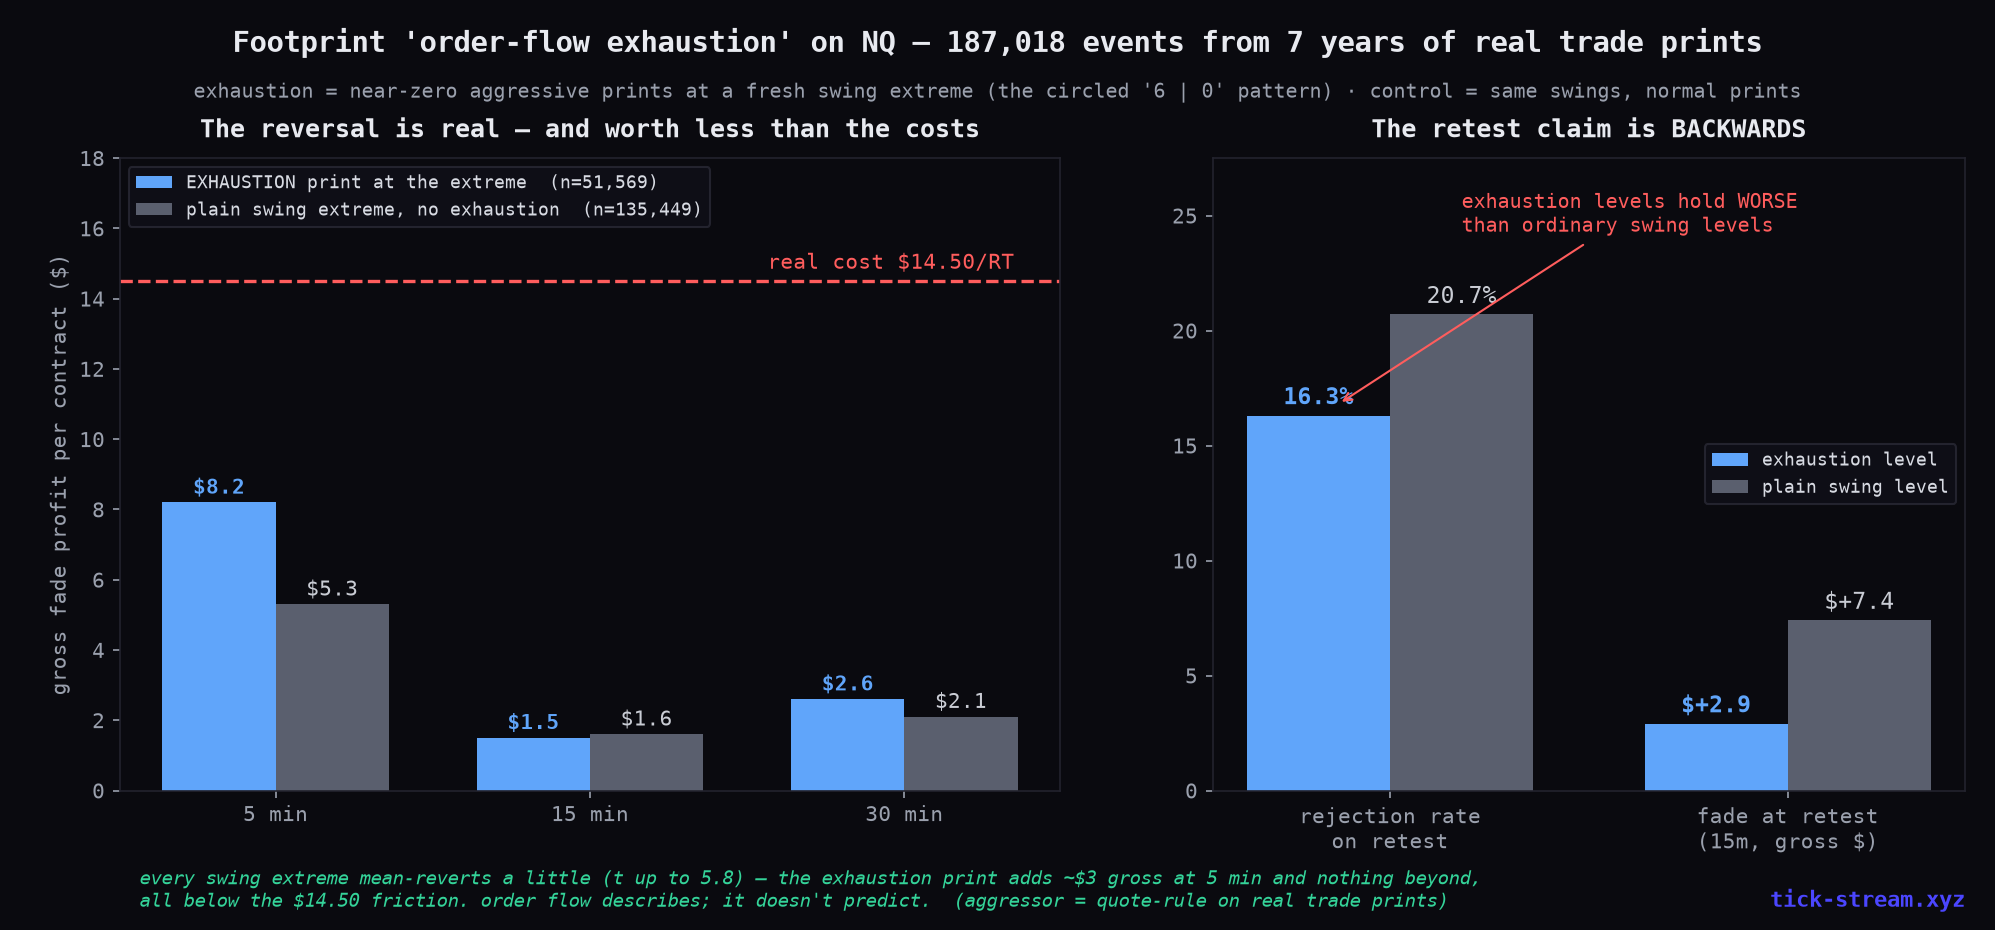
Fading the exhaustion print (short the exhausted high / long the exhausted low) earns, gross per contract: +$8.2 over 5 minutes (t = 4.0), +$1.5 over 15 (t = 0.4), +$2.6 over 30 (t = 0.5). Only the first five minutes are statistically real. Here’s the problem, in two layers:
- The control reverts too: +$5.3 / +$1.6 / +$2.1 on the same horizons (t = 5.8 at 5 minutes). Every fresh swing extreme on NQ mean-reverts a little — that’s a property of extremes, not of footprints. The exhaustion print adds ~$3 gross at 5 minutes and nothing beyond.
- All of it — exhaustion and control alike — sits below the ~$14.50 round-trip cost (commission + slippage) of a market-order fade. The dashed red line in the chart is the whole verdict: the effect exists at tick scale and is unharvestable for a taker.
As an equity curve — the format that makes it obvious: fade all 51,569 exhaustion prints and the gross line genuinely climbs (+$80k over 7 years, the effect is real); the same trades net of $14.50 round-trip lose $668k. The vertical gap between those two lines is pure friction.
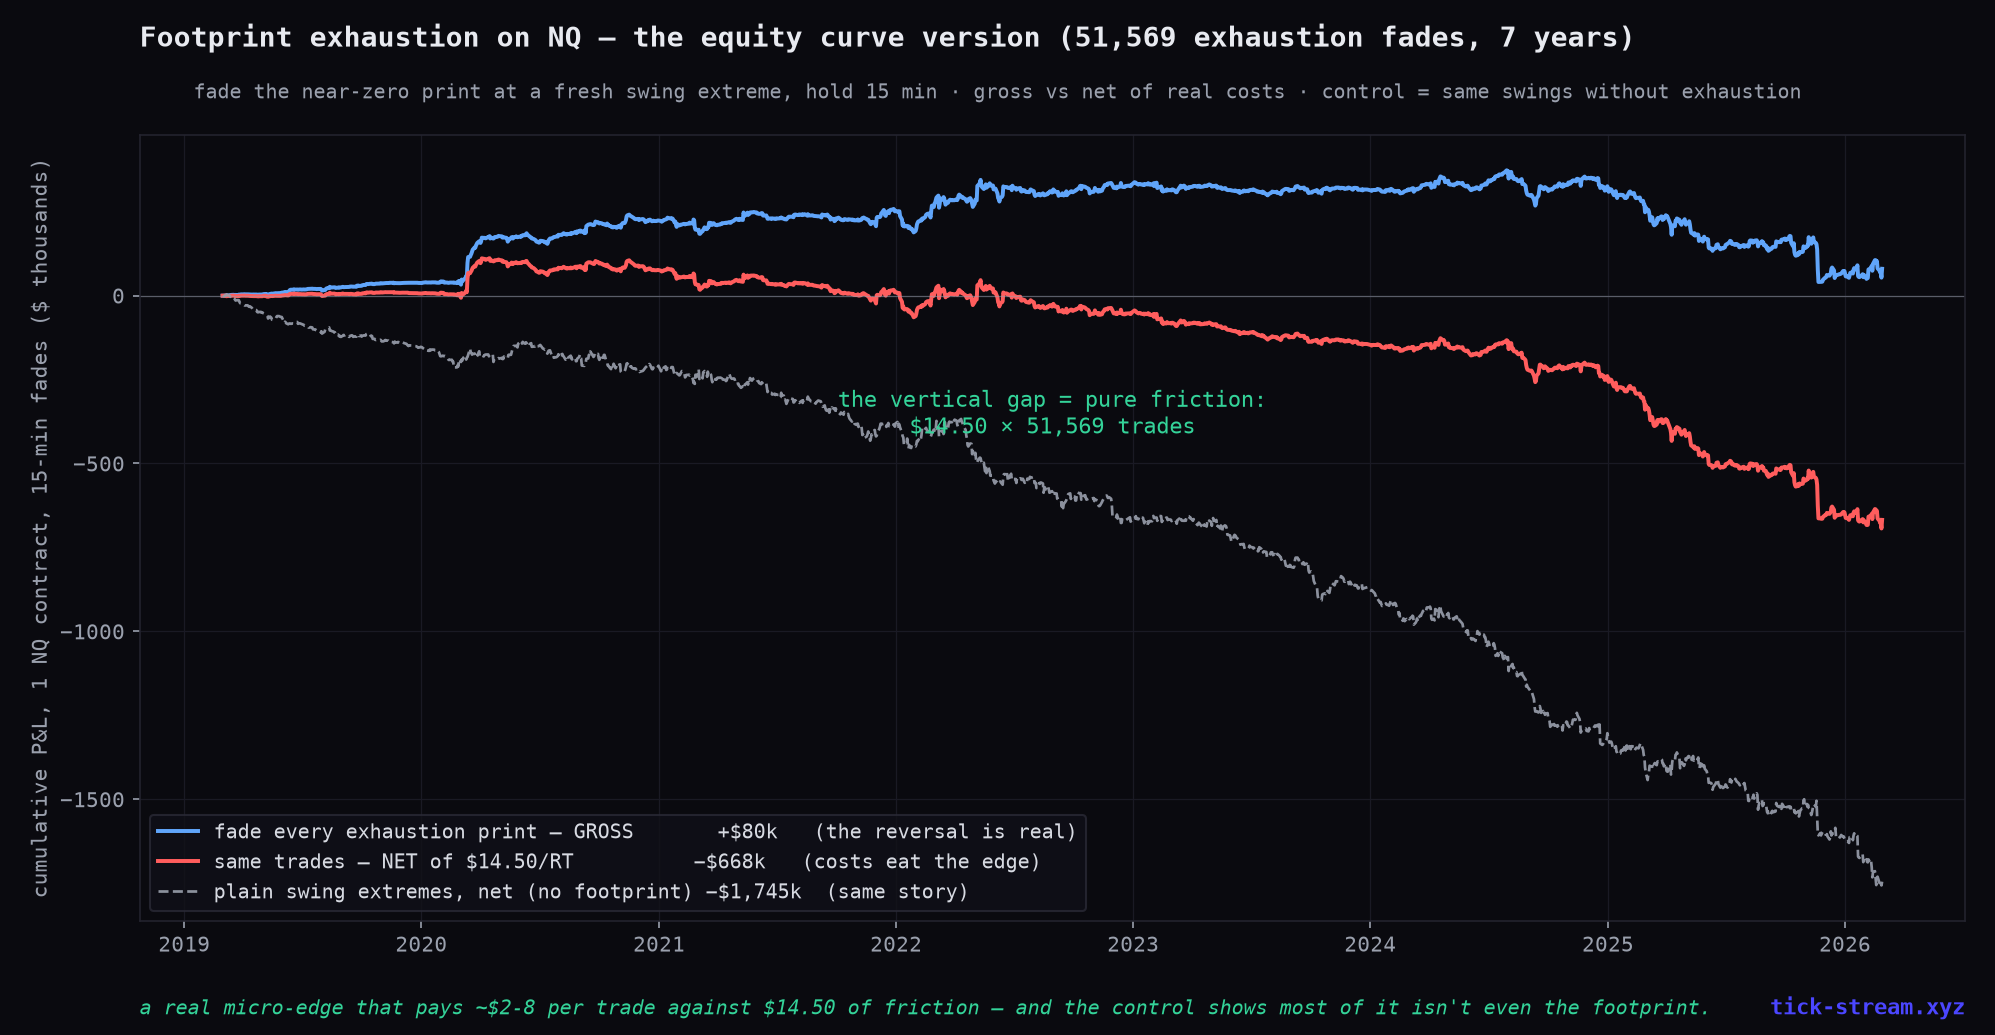
This is the same shape as our order-book imbalance result: genuinely real micro-effects, measurable with tick data and honest statistics, that live entirely inside the spread-and-fees zone. If anyone can monetize them it’s a maker with queue position — not anyone clicking on a footprint chart.
Finding 2: the retest claim is backwards
The sellable half of the exhaustion story is the retest: price comes back to the exhaustion level and rejects again. We measured it directly — after each event, if price moved away at least 8 ticks and later returned to touch the level, did it reject (move away 8+ ticks again before trading through)?
| Exhaustion level | Plain swing level | |
|---|---|---|
| Retested later in the session | 37% | 35% |
| Rejected on the retest | 16.3% | 20.7% |
| Fade at the retest (15 min, gross) | +$2.9 (t = 0.5, ns) | +$7.4 (t = 2.8 — still half the $14.50 cost) |
Read that middle row again. The exhaustion level held worse than an ordinary swing level — the claim isn’t just unproven, it’s inverted. And there’s a clean mechanical reason once you think about it: a near-zero print at the extreme means almost nobody traded there. No positions were built at that price, so nobody has anything to defend on the retest. The retest thesis assumes institutional defenders at a level where the footprint itself is evidence they’re absent. (Our gamma-wall and value-area studies found the same family of result: the more visible and “special” the level, the more it gets absorbed rather than respected.)
What survives
The honest kernel, one last time: order flow — footprints, delta, CVD, exhaustion prints — is coincident, not predictive. It’s a genuinely good description of what just happened: whether a move was participated in, where volume clustered, whether an extreme was made on conviction or on air. As context and for execution, that’s real. As a directional trigger — “this print means the next move is down” — it has now failed every version of the test we can construct on seven years of real tick data: CVD and delta, volume confirmation, and exhaustion with its retest.
If someone sells you the circled 6 | 0, ask them one question: against a control group of ordinary swing extremes, after costs, over how many thousand events?
Methodology: NQ tick store 2019–2026 (every trade print; aggressor side inferred with the quote rule against the prevailing bid/ask, tick rule inside the spread), aggregated to 677,628 one-minute RTH footprint bars (aggressive ask/bid volume at each bar’s extreme price levels). Events: fresh trailing 10-minute swing extremes; exhaustion = ≤2 contracts aggressive volume at the extreme level; control = same swings, normal prints. Fade returns measured 5/15/30 minutes forward, gross, with $14.50 round-trip cost shown for reference; retest = return to within 1 tick of the level after moving ≥8 ticks away, rejection = moving ≥8 ticks away again before trading 2 ticks through. t-stats on daily-aggregated means.
Correction note (2026-07-03): the first version of this article computed footprints from a mis-read field in our raw tape — bid/ask quote updates were counted as signed trades. We rebuilt every bar from the actual trade prints with quote-rule aggressor inference and re-ran the whole study. Every headline conclusion survived (the reversal is real but sub-cost; the retest claim is inverted); the per-event dollar figures and event counts on this page are the corrected ones.
Frequently asked questions
Does footprint order-flow exhaustion actually work?
Not as a tradable signal. On 187,018 events built from 7 years of real NQ trade prints, fading an 'exhaustion print' (near-zero aggressive volume at a fresh swing extreme) earned $8.2 gross per contract over the next 5 minutes (t = 4.0) and essentially nothing at 15–30 minutes — always below the ~$14.50 round-trip cost of trading it. And the control group shows most of that isn't the footprint at all: plain swing extremes with perfectly normal prints revert almost as much.
Is the exhaustion reversal at least a real effect?
Yes — and that's the honest nuance. Every fresh swing extreme on NQ mean-reverts a little over the next minutes; our control group of ordinary swing extremes earned +$5.3 per contract over 5 minutes with a t-stat of 5.8. The exhaustion print adds ~$3 gross on top at 5 minutes — and nothing at 15–30 minutes. So the effect traders see on their charts is real; it's just (a) mostly a property of any swing extreme, not of the footprint, and (b) smaller than the cost of harvesting it. Order flow describes the present; it doesn't predict the future.
Does price reject when it retests an exhaustion level?
The opposite, in our data. When price returned to an exhaustion extreme later in the session, it rejected the level 16.3% of the time — while ordinary swing levels rejected 20.7% of the time. The exhaustion print made the level HOLD WORSE, not better. There's a plausible mechanical reason: near-zero prints at the extreme mean almost nobody traded there, so almost nobody has positions to defend at that price. The retest thesis assumes defenders that the footprint itself proves are absent.
What is a footprint exhaustion print, exactly?
On a footprint chart each bar shows traded volume per price level, split by aggressor side (market buys at the ask vs market sells at the bid). 'Buyer exhaustion' is when the topmost price level of an up-move prints near-zero aggressive buys — the classic circled '6 | 0' — read as 'the buyers are done.' We operationalized it mechanically: a fresh trailing swing extreme whose extreme price level printed ≤2 contracts of aggressive volume, tested against equal swings with normal extreme prints.
Is footprint or order-flow analysis useless then?
As a directional entry signal, we've now killed the whole family on NQ: CVD, delta, divergences, volume confirmation, and exhaustion — order flow is coincident with the move that just happened, not predictive of the next one. Where it genuinely helps is context and execution: reading whether a level was participated in, where liquidity sits, whether a move was absorbed. Those are real uses. 'This print tells you the next move' is the use being sold, and it's the one that fails every honest test.