We Built a Daily Breakout-vs-Mean-Reversion Score From Dealer Gamma — and It Grades Itself in Public
Can the morning gamma board tell you whether today will be a breakout day or mean-reversion chop? We tested it on 1,698 reconstructed daily option boards (2019→2026): direction is a coin flip, but EXPANSION is predictable — rank-IC −0.43, stronger out of sample. The score now runs live on our free GEX page, frozen at 09:35 ET and graded against the realized range every evening, misses included.
Every morning the options market publishes a number that says something real about the day ahead. Not where price will go — we’ll get to that — but what kind of day it will be.
We turned that number into a daily score: breakout or mean reversion, with a conviction from 0 to 10. And because a score nobody can check is just content, it now lives on our free GEX page, freezes at 09:35 ET, and grades itself against the realized session every evening — in public, misses included.
This is the research behind it, including the part we tried first and rejected.
The setup
We reconstructed the daily dealer-gamma board for 7.4 years — 1,698 trading days of full QQQ option chains from our own OPRA archive, each contract’s gamma computed with the same formula the live page uses (we verified the two agree to 0.05% before trusting either). Two candidate signals per morning:
- the board’s net gamma, as a percentile of its trailing 250 days
- the sign of the regime (net short vs net long gamma)
And one honest question: what, exactly, can this predict about the day that follows?
What it cannot predict: direction
The first thing we tested was the claim implied by every “gamma flip” chart on the internet — that the regime tells you whether the day will trend or V-shape back. Directional persistence, measured as |close − open| / (high − low).
Result: rank-IC −0.07. Statistically detectable across seven years, and completely useless as a product — holdout calibration bins barely separate from a coin flip. This matches what our level-trading research has found four separate times: gamma walls are context, not entries. We rejected the trendiness score. A 0–10 conviction scale on a coin flip would be theater.
What it predicts well: expansion
Then we asked the question the data actually answers: will today’s range be wide or compressed?
That works — and it’s not close:
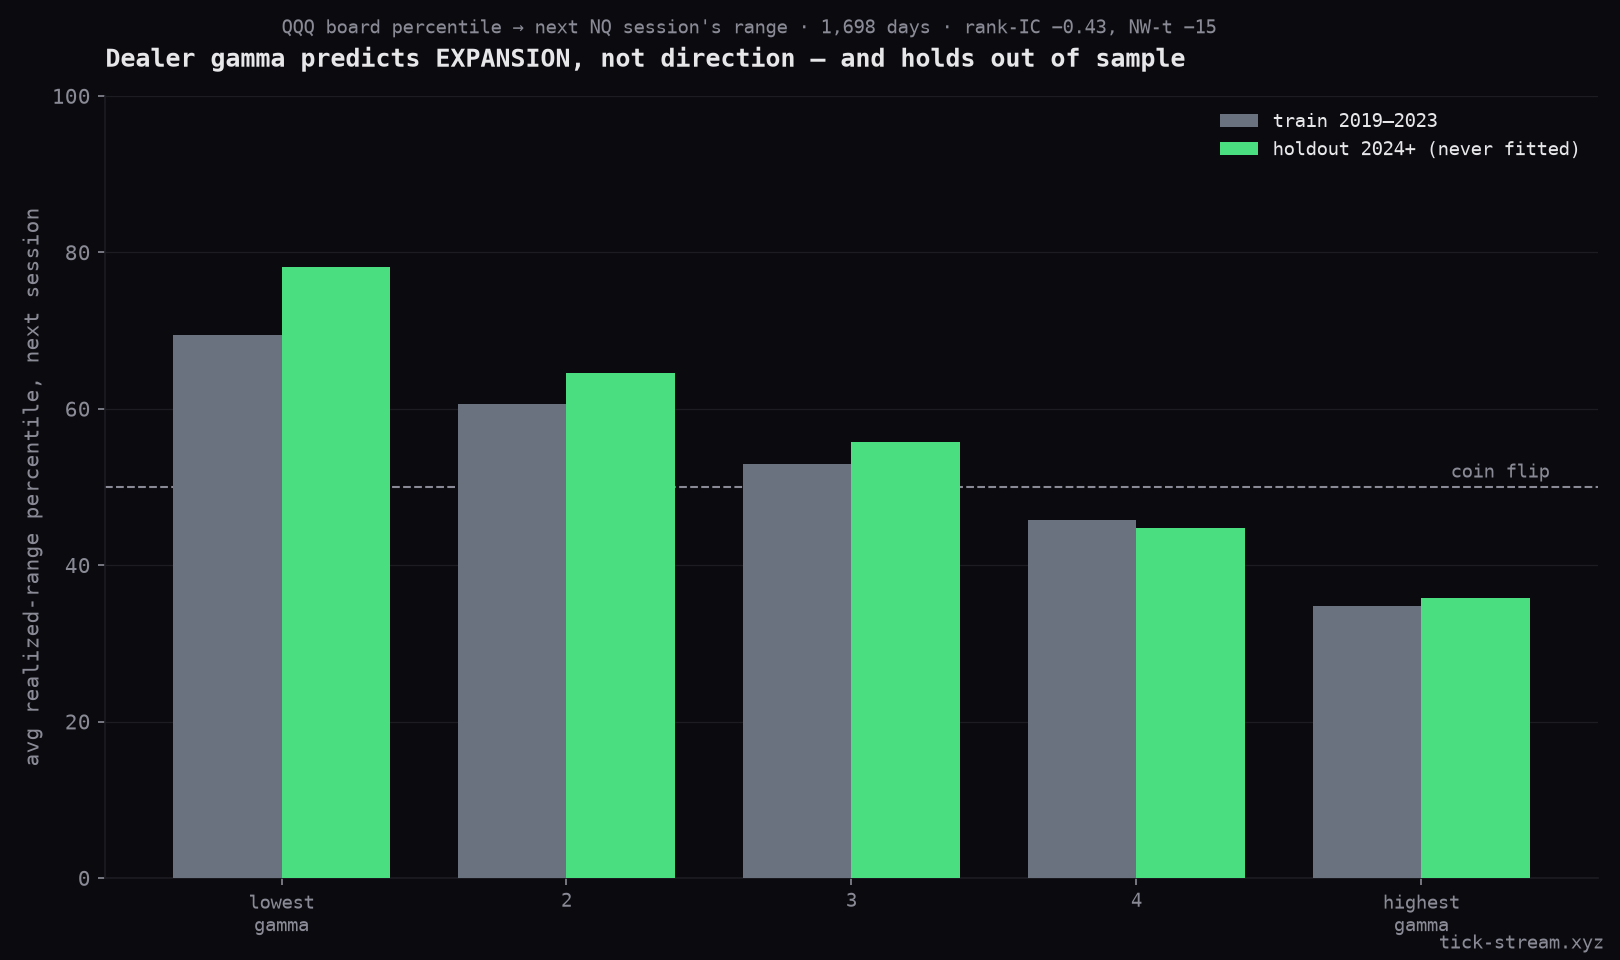
- rank-IC −0.43, Newey-West t −15
- gamma quintiles map monotonically onto the next session’s range percentile: lowest-gamma boards average the 69th percentile, highest-gamma the 35th
- and the part that matters most: the 2024+ holdout, never touched during fitting, is stronger than training (78th → 36th percentile across quintiles)
- in plain points: negative-gamma boards preceded sessions averaging 268 NQ points of range, positive-gamma boards 174
That is the mechanically sensible result. Short-gamma dealers hedge with the market and amplify it; long-gamma dealers hedge against it and pin it. Our research program has reproduced this regime effect three times now — it’s the one thing about GEX that has survived every test we’ve thrown at it.
So the score is honest about what it is: “breakout” means expansion conditions, “mean reversion” means compression conditions. It says nothing about which direction the expansion resolves. The page states that limitation in the first paragraph.
Calibration, and a conviction scale that means something
A logistic calibration fitted on 2019–2023 only maps the two features to P(expansion day). Above 0.55 → breakout call. Below 0.45 → mean reversion. In between the score abstains — about one day in six is a genuine “no edge today”, and saying so is part of the deal.
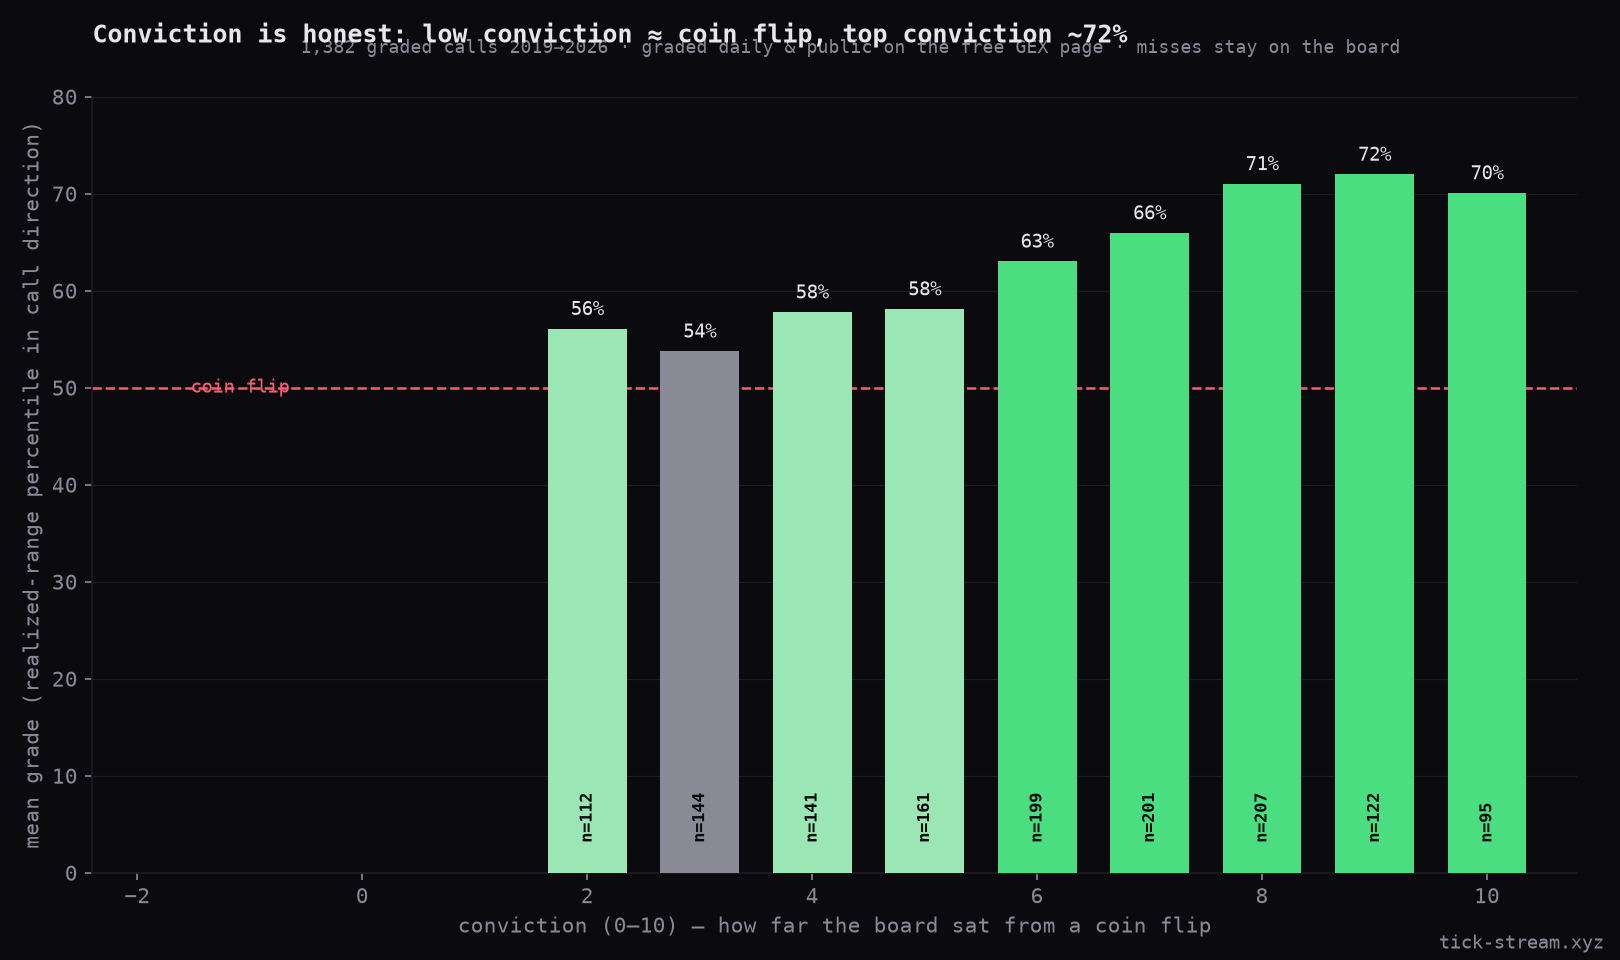
Conviction 0–10 is the distance from a coin flip, scaled to the probability range the model actually achieves. The grading is continuous, because binary win/lose flatters models: every evening the realized regular-hours range is placed as a percentile in its own trailing distribution — a breakout call’s grade is that percentile, a mean-reversion call’s grade is its inverse. 50% = coin flip.
The record, 2019→2026, all 1,382 non-neutral calls: mean grade 63%, 68% of calls better than a coin flip. By conviction it is monotone and honest: conviction 2–4 sits barely above 55% — the scale tops out where the data does, not at a marketing number — while conviction 8–10 grades around 72%, and slightly better in the holdout years than in training.
The misses stay on the board
The week before we shipped this makes the point better than any backtest table. August 4th: the board called mean reversion with conviction 8 — and the market exploded through the 84th range percentile. Grade: 16%. A conviction-8 miss, followed by two more rough days, sitting right there on the public strip next to the hits.
That’s the difference between this and every “regime indicator” screenshot you’ve seen: the score was frozen at 09:35, before the day happened, and the grade was computed by the same page you’re reading it on. Days from before launch are marked BF (backfilled from the archive with the same method); everything after is marked LIVE — frozen and graded by the page itself, with no human in the loop to quietly forget a bad day.
Use it for what it’s for
If the board says breakout with high conviction, wide stops and breakout entries have the wind at their back, and fading moves is fighting the regime. If it says mean reversion, range trades breathe easier and chasing breakouts is how you donate. What it will never tell you is which way — pair it with whatever directional process you actually trust.
The score is free, on the GEX levels page, under the chart. The board it reads is the same computed gamma we sell as a data API, and the archive it was calibrated on is our own OPRA options history. No signup, no email — just check back tomorrow and see whether today’s call earned its grade.
Frequently asked questions
Can GEX predict whether today is a breakout or mean-reversion day?
Partly — and the honest split matters. Tested on 1,698 reconstructed daily QQQ option boards mapped to NQ (2019→2026): dealer gamma says almost nothing about directional persistence (rank-IC −0.07 — a trend day vs a chop day in the V-shape sense is close to a coin flip). What it predicts well is EXPANSION: whether the session's range will be wide or compressed, with rank-IC −0.43 and a Newey-West t of −15. Low-gamma boards average the 61st range percentile, high-gamma boards the 42nd. 'Breakout conditions' in the range sense — yes. Direction — no.
How is the daily regime score computed?
From the morning board only: the net dealer gamma of the whole QQQ chain (each contract's gamma evaluated at spot, calls positive, puts negative), placed as a percentile in its trailing 250-day distribution, plus the sign of the regime. A logistic calibration fitted on 2019–2023 only maps that to a probability of an expansion day; above 0.55 the call is 'breakout', below 0.45 'mean reversion', in between the score abstains. Conviction 0–10 is the distance from a coin flip, scaled to the probability range the model actually achieves — it tops out where the data does.
How is the score graded?
Continuously, not win/lose. Every evening the session's realized regular-hours range is placed as a percentile in its trailing 250-day distribution. A breakout call's grade IS that percentile; a mean-reversion call's grade is 100 minus it. 50% is exactly a coin flip. Over the 7.4-year record the average grade is 63% and 68% of calls graded better than a coin flip — with conviction 8–10 days near 72% and conviction 2–4 days barely above 55%, which the page says out loud.
Where can I see the score live?
On the free GEX levels page at tick-stream.xyz/free-gex-levels-realtime, under the chart. The call freezes at 09:35 ET from the morning board — a late server gets no call rather than a dishonest afternoon one — and the page grades itself after the close. The last seven graded days stay on the board, misses included, with backfilled days marked 'BF' and live days marked 'LIVE'.
Why negative gamma means wider ranges?
When dealers are net short gamma they hedge WITH the market — selling as it falls, buying as it rises — which amplifies moves; net long gamma they hedge against the move, which dampens it. In our sample negative-gamma boards preceded sessions averaging 268 NQ points of range versus 174 on positive-gamma boards. That's the regime effect our research has now reproduced three separate times — while every attempt to trade gamma LEVELS directionally failed its placebo test.