Volume Tells You How Big Tomorrow Is, Not Which Way
Volume is sold as a direction tool and measured as a volatility tool. On 3,078 S&P 500 cash sessions, today's volume correlates +0.2543 with the size of tomorrow's move and +0.0346 with its direction, the second at p = 0.0551. After a high-volume day the next session ranges 50.66 points against 35.37 after a low-volume one — but it continues the same direction only 45.7% of the time, which is the opposite of what the teaching says.
Volume is a volatility indicator that people use as a direction indicator. On twelve and a half years of S&P 500 futures it does the first job well enough to size positions with, and on the second job it points the wrong way.
Across 3,078 cash sessions, today’s volume correlates +0.2543 with how big tomorrow’s move is and +0.0346 with which way it goes. The second one has p = 0.0551 and does not clear significance. The bucket version is worse than null: after a high-volume day the S&P continues in the same direction 45.7% of the time.
We ran this test on the Nasdaq first and killed the confirmation claim there on 1-minute breakouts. This is the daily version on an archive that is twelve and a half years rather than seven, and it separates the two jobs cleanly enough to say which one volume is actually for.
The claim
The claim under test is the standard one, stated in two halves:
- Volume expansion confirms a move. A day that moves on unusually heavy volume has conviction behind it, so the move continues.
- Volume contraction warns of a reversal. A move on unusually light volume lacks participation, so it is likely to be given back.
Both halves are directional predictions about the next session. We measured them as such: daily volume, its z-score against its own 20-day mean and standard deviation, and what happens the following day.
Volume and today
Start with the correlation everybody has already seen, because it is the one that makes volume look powerful.
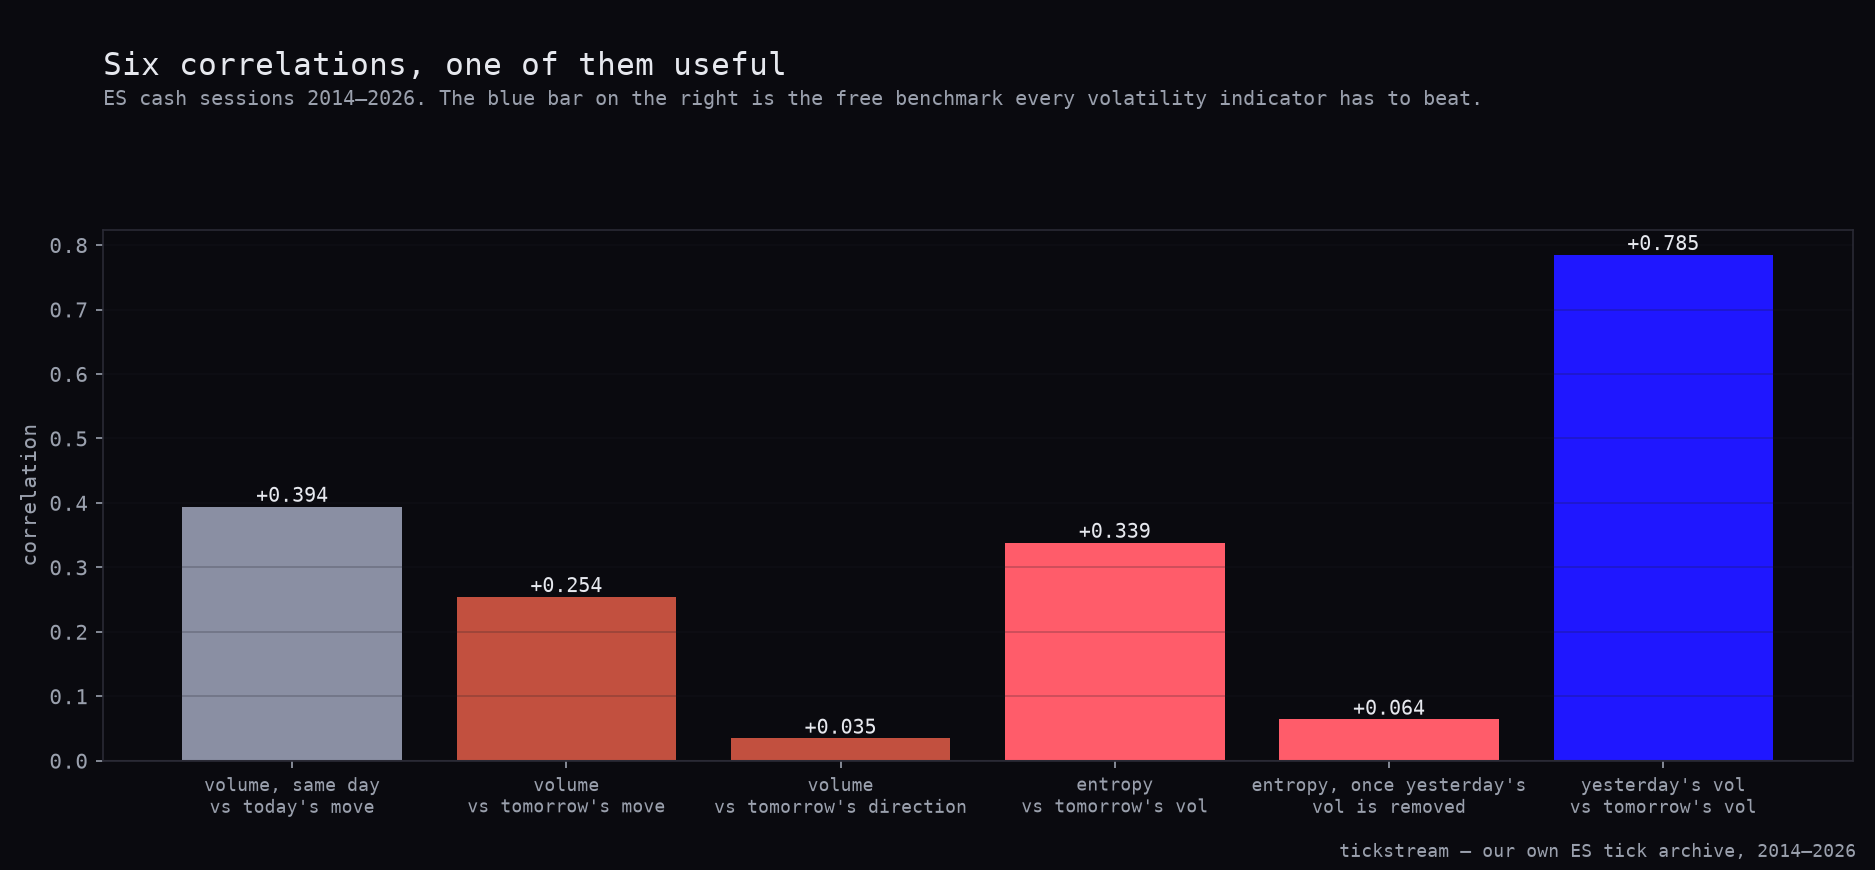
Today’s volume against today’s absolute move is r = +0.3943, p rounding to zero on 3,078 sessions. That is the largest volume number in the whole study and it carries no information at all. It says that days on which a lot happened had a lot of volume, which is close to a definition. Volume is how the move got made.
Every indicator chart that impresses people is showing something in this column. The big red bar sits underneath the big red candle because it is the big red candle, counted a second way.
Volume and tomorrow’s size
The forward numbers are smaller and look, at first, like foresight.
| What we measured | r | p | n |
|---|---|---|---|
| Today’s volume vs today’s absolute move | +0.3943 | rounds to 0 | 3,078 |
| Today’s volume vs tomorrow’s absolute move | +0.2543 | rounds to 0 | 3,078 |
| Volume z-score vs tomorrow’s range | +0.1810 | rounds to 0 | 3,078 |
| Volume z-score vs tomorrow’s direction | +0.0346 | 0.0551 | 3,078 |
The middle two are real. We did not partial them against yesterday’s volatility, so we cannot say how much of them is borrowed. What we can say is that volatility on ES is one of the most persistent things in the dataset, and that any indicator computed on a busy day inherits some of that persistence for free.
| Series | Lag | Autocorrelation |
|---|---|---|
| Daily range | 1 day | +0.725 |
| Daily range | 5 days | +0.548 |
| Realised volatility | 1 day | +0.785 |
| Direction (sign of close − open) | 1 day | −0.011 |
A busy day is followed by a busy day. Yesterday’s realised volatility predicts tomorrow’s at r = 0.7849, and it was already sitting in the same table. Volume’s +0.2543 is not competing with zero, it is competing with that, and it is a long way short.
The first chart puts six correlations side by side on the same axis, including two from our companion entropy test on the same sessions. The bar on the right is the free benchmark: yesterday’s volatility against tomorrow’s, at +0.785. Every volatility indicator has to beat that bar to be worth having, and none of the others come close.
That said, the ordering is real and it is usable. Make it concrete with buckets rather than correlations.
The buckets
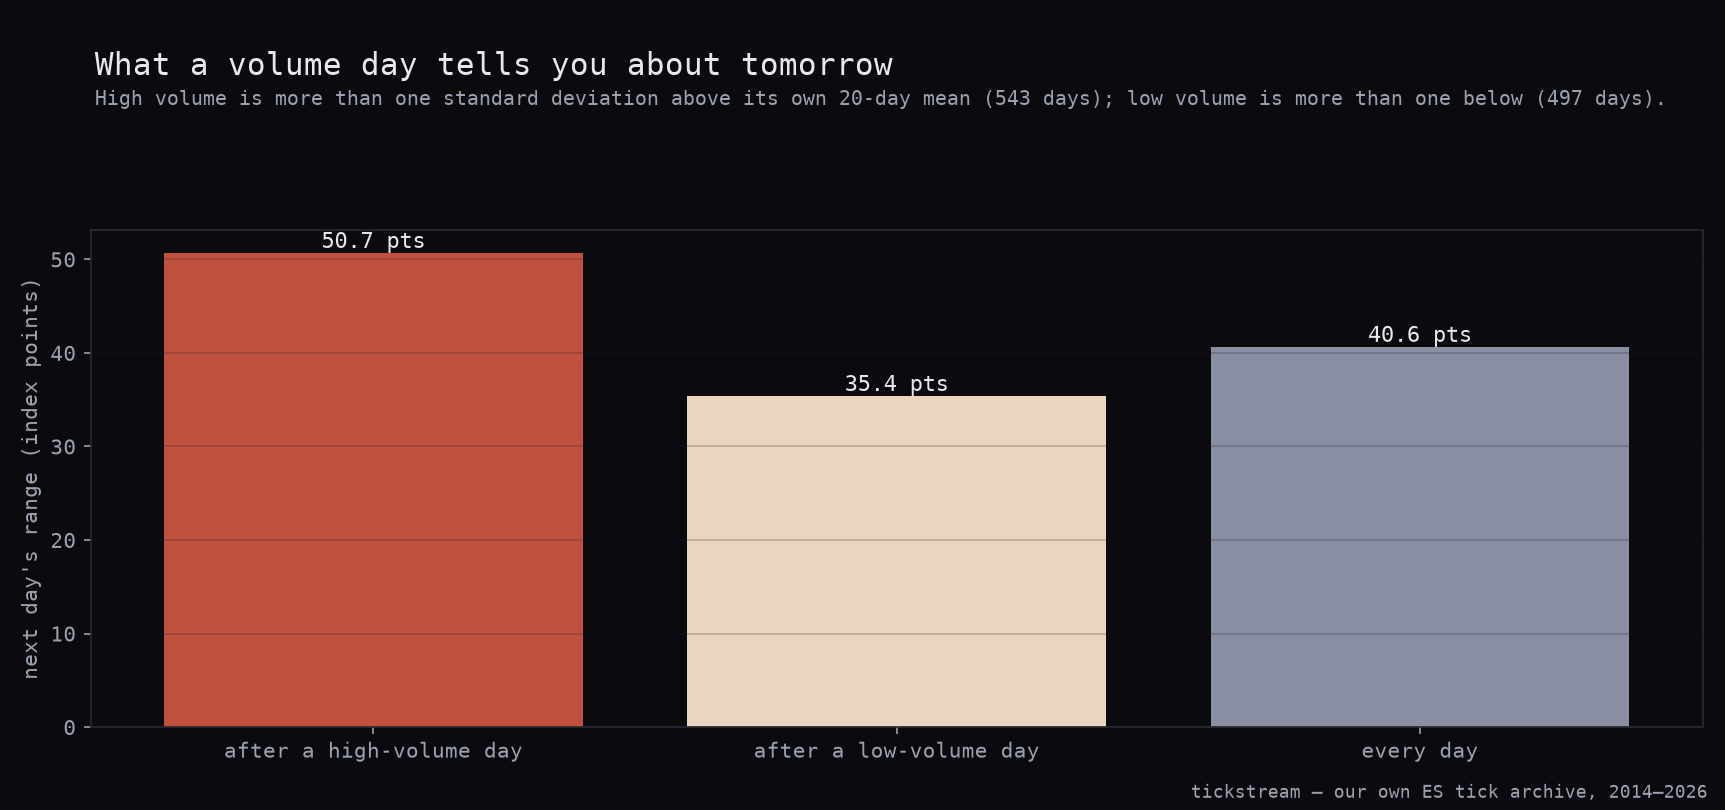
A high-volume day is one whose volume sits more than one standard deviation above its own 20-day mean. A low-volume day is one more than one standard deviation below. There are 543 of the first and 497 of the second.
| Bucket | Days | Next day’s range | Next day same direction | p |
|---|---|---|---|---|
| After a high-volume day | 543 | 50.66 pts | 45.7% | 0.0483 |
| After a low-volume day | 497 | 35.37 pts | 50.7% | 0.7879 |
| Every day | 3,078 | 40.62 pts | — | — |
The range column is the honest positive in this article. The direction column is the claim, and it fails.
The second chart is that range column alone, with the all-days baseline next to it so the spread is visible rather than asserted.
Volume and tomorrow’s direction
This is what the claim actually asserts, and it is the column where volume stops working.
The correlation is +0.0346 at p = 0.0551. On 3,078 sessions that does not clear significance, and 3,078 sessions is a large enough sample that a real effect of any usable size would have cleared it.
The buckets contradict the teaching outright. After a high-volume day, the S&P moves the same direction the next session 45.7% of the time, p = 0.0483. After a low-volume day it is 50.7%, p = 0.7879 — a coin. So the half of the claim about contraction warning of reversal is simply nothing, and the half about expansion confirming the move has the sign backwards.
We are going to be careful with that. The one marginally significant cell in this article is p = 0.0483, and it comes out of four forward correlations, four autocorrelations and two binomial tests. At that count, 0.0483 sits right at the edge of what multiple comparisons will support, and we would not trade it. The finding we are willing to state is “high volume is not confirmation”, not “fade high volume”. Those are different claims and only the first one is carried by this data.
The control that closes it
The cleanest control here is not a placebo run, it is the last row of the persistence table.
Direction on ES daily bars autocorrelates at −0.011 at one day. There is no daily directional memory on this instrument at all. Whatever a confirmation indicator is supposed to confirm, it does not exist on this timeframe, so the 45.7% is not a mystery needing an explanation — it is what you get when you condition a coin on something that only knows about volatility.
The range side has its control too: the 40.62-point all-days baseline. Both buckets are measured against it, and both sit clearly off it in opposite directions, which is why we treat the size result as real and the direction result as absent.
What we do with this
We use volatility forecasts for position sizing, not for entries, and this is exactly the kind of measurement that supports that split.
A stop is a distance in points. What it costs you is that distance measured against how much the market is going to move, and that second number is not constant. After a high-volume day the expected next-session range is 50.66 points; after a low-volume day it is 35.37. The same stop, in the same contract, represents 1.43 times as much risk in the first state as in the second. That is a large enough difference to size around and it is available before the session starts.
None of that is an entry signal. Nothing in this article gives us a reason to be long or short, and we have not added one. What changed is that volume joins the set of inputs we allow into the sizing layer, alongside yesterday’s realised volatility — which, at r = 0.7849, remains the one doing most of the work.
The NQ version of this test came to the same verdict from a different angle, on 1-minute breakouts rather than daily bars. Two instruments, two timeframes, same split: volume is coincident with the move that just happened and forward-looking only about size.
The ES archive this ran on, with an aggressor side on every print back to 2014, is in our historical data packages.
Methodology: ES continuous front-month, 1-minute bars resampled from our own trade prints and restricted to the 09:30–16:00 ET cash session, 4 February 2014 to 8 September 2026, 3,078 sessions with at least 300 minutes of trade. Daily volume, range (session high minus low), move (last close minus first open) and realised volatility (standard deviation of minute returns, annualised over 390 minutes) computed per session. Volume z-score is against a trailing 20-day mean and standard deviation, so every day is scored only against its own recent past. Correlations are Pearson, p-values two-sided. Bucket p-values are two-sided binomial tests against 0.5. High volume is z > +1 (543 days), low volume is z < −1 (497 days). No trades were simulated in this article, so no cost line applies to the figures above. For reference, our standing assumption elsewhere in this series is $4.50 commission plus two ticks of slippage per round trip, $29.50 on ES at $12.50 a tick. That assumption is part of why we will not act on a 45.7% cell.
Frequently asked questions
Does high volume confirm a move on the S&P 500?
No. Across 3,078 ES cash sessions, a day whose volume sat more than one standard deviation above its own 20-day mean was followed by a same-direction day 45.7% of the time. There were 543 such days and the binomial p is 0.0483. If anything that tilts against continuation, not for it.
What does volume actually predict on ES?
Size. Today's volume correlates +0.2543 with the absolute size of tomorrow's move and the volume z-score correlates +0.1810 with tomorrow's range, both with p rounding to zero on 3,078 sessions. Direction comes in at +0.0346 with p = 0.0551, which does not clear significance on that sample.
Isn't volume's volatility signal just yesterday's volatility in disguise?
We did not measure that. Volume was never partialled against yesterday's volatility here, so we cannot say how much of its +0.2543 is borrowed. What the table does show is that yesterday's realised vol predicts tomorrow's at r = 0.7849, and volume sits far below that free benchmark.
How much does tomorrow's expected range change after a big volume day?
After a high-volume day the next session's range averages 50.66 index points. After a low-volume day it averages 35.37, and across all 3,078 sessions it averages 40.62. That is a 1.43x spread between the two conditioned buckets, which matters for how many contracts a fixed stop represents.
Does direction persist at all on ES daily bars?
No. The sign of the daily close-minus-open autocorrelates at −0.011 at one day's lag over 3,078 sessions. There is no daily directional memory on this instrument, so there is nothing there for a confirmation indicator to confirm.