The Most Honest Strategy We've Backtested — and It Still Stopped Working in 2024
Matteo Conti, a former Nordea market maker, describes a fully mechanical VWAP drift-pullback system for NQ in a 44-minute interview: three coded trend conditions, first pullback candle, 80-point stop, 40–50-point target, 64% win rate, in-sample 2020–2023 and out-of-sample after. We rebuilt it from the interview and it reproduces his numbers within a few percent — which is rare. Then we looked at the out-of-sample years, and found the mechanism that killed it: the target is capped and the loss is not.
We test a lot of strategies from interviews and videos, and the usual finding is that the described rules never produced the described numbers. This one is different, and it deserves saying up front: Matteo Conti’s numbers are real. He is a former Nordea Markets market maker, now CIO at the quant fund SQR Capital, and in a 44-minute interview he specifies a fully mechanical system down to the last parameter. We rebuilt it from the interview alone and landed within a few percent of everything he claims.
That makes the second half of this article more interesting than usual. When a strategy’s backtest is honest and the strategy still stops working, you get to see the actual mechanism of decay instead of just another artifact.
Here is the system, condensed from his own description:
NQ only. One indicator: a VWAP computed on the 15-minute chart, anchored to the 09:30 ET open. Every 15 minutes, check three conditions — price above the VWAP, VWAP rising over the last 15 minutes, and NQ up at least 0.1% over the past hour (mirrored for shorts). When all three hold, wait for the first counter-colour pullback candle and enter market at the next candle’s open — not a limit at the VWAP. 80-point stop, 40-point target long, 50 short. No trade management at all. No trading in the first hour, no new trades after 15:30, flat at 15:55. Guardrails: one position at a time, maximum 4 trades a day, stop for the day after 2 losses.
Every element is a number, which is why he calls it fully coded and why we could test it without a single judgment call. The 0.1% threshold and the trade caps, he says, were optimized on 2020–2024 in-sample data, with everything after that treated as out-of-sample.
Part one: the replication
3,757 trades over 1,806 sessions (March 2019 – 14 August 2026), management on 1-minute bars with the stop always resolved before the target, real costs.
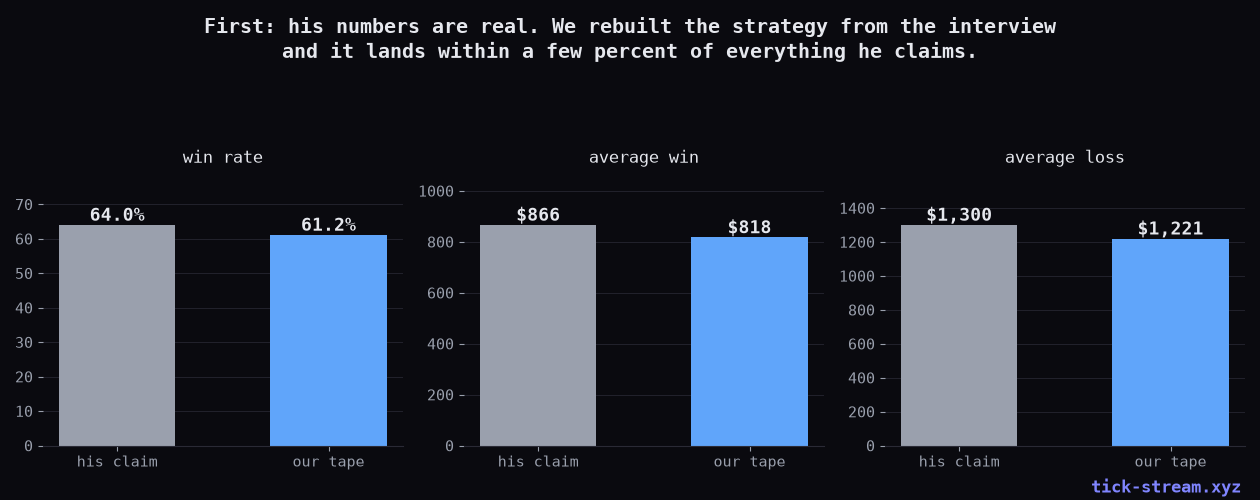
Win rate 61.2% against his claimed 64%. Average win $818 against $866. Average loss $1,221 against $1,300. Even the subtle detail checks out: his published figures imply realised losses average around 65 points rather than the full 80-point stop, and we measure 61 — the time-stop and the two-loss cap really do cut losers short, exactly as he says.
We almost never get to write a paragraph like that. Take the man at his word: he did the work.
Part two: where it stops
His development method was in-sample 2020–2023, then parameters frozen, then out-of-sample. So split our run on the same boundary.
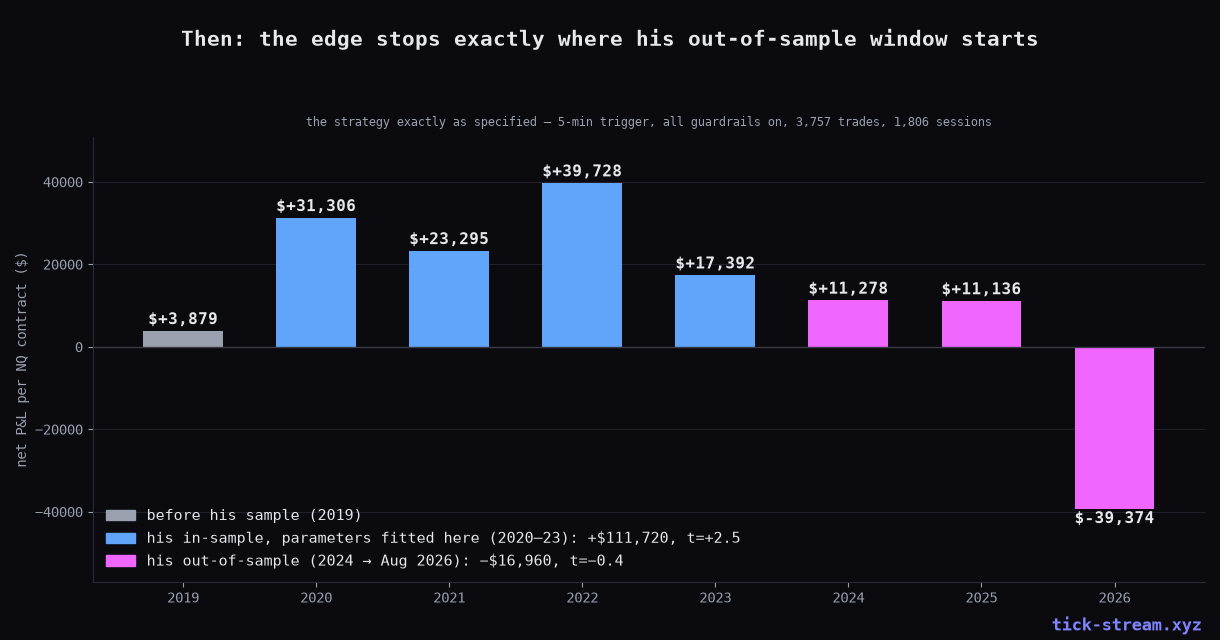
In-sample, 2020–2023: +$111,720 per contract, t = +2.5. A real result on the years the parameters were chosen on.
Out-of-sample, 2024 → August 2026: −$16,960, t = −0.4. Statistically an exact zero. 2024 and 2025 each add about $11,000 — roughly a quarter of what 2022 produced on its own — and 2026 to date is −$39,374, with the win rate down to 58.4%.
His claim of 300%+ over 4,000+ trades does not reproduce on our tape outside the fitting window. This is not an accusation of curve-fitting in the crude sense: the parameters are few and coarse (a 0.1% threshold, a 4-trade cap), which is exactly what he says he did to limit overfitting. Something else went wrong, and it is visible.
Part three: the mechanism — a capped target against an uncapped loss
This is the part worth stealing regardless of what you think of the strategy.
At a 40-point target and an 80-point stop, the win rate you need to break even isn’t fixed — it depends on what your losses actually cost, which is not the stop distance. So we computed, for each year, the realised average win, the realised average loss, and the win rate those two imply as breakeven.
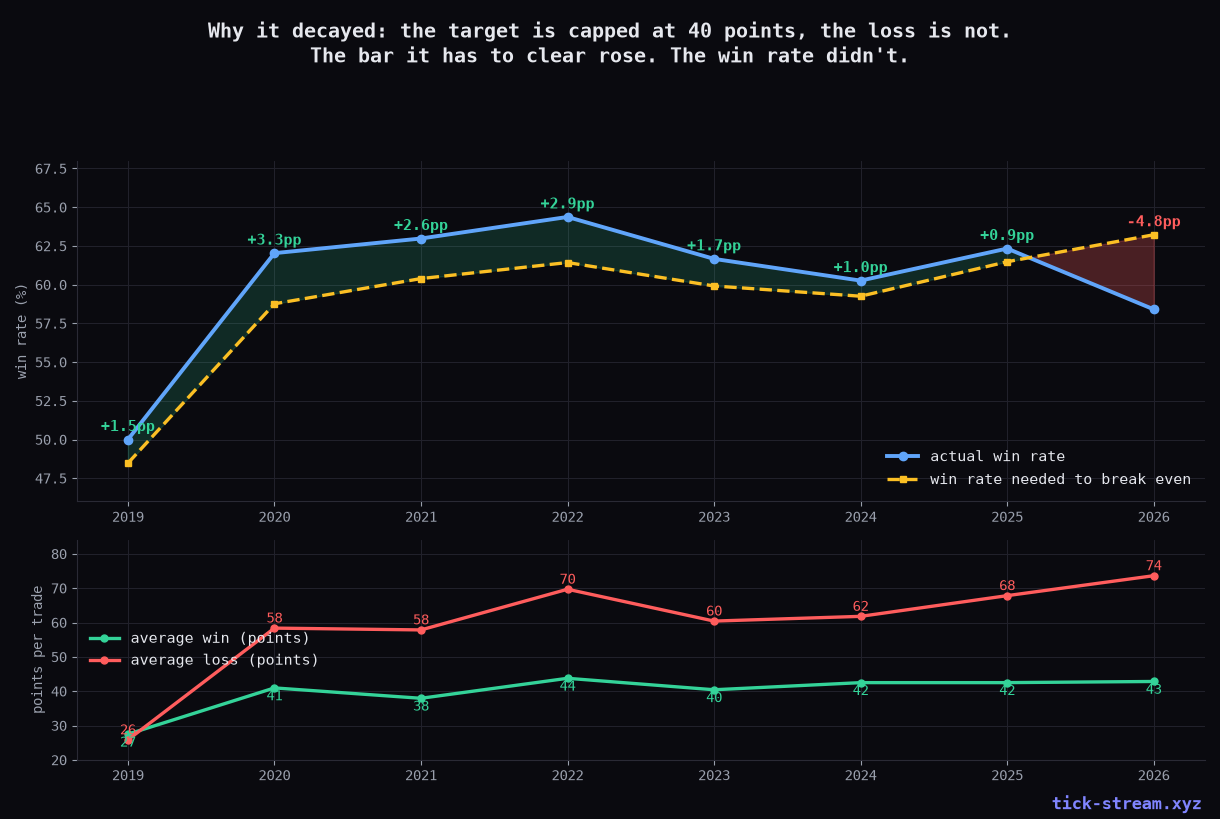
The average win never moves: 41, 38, 44, 40, 42, 42, 43 points. It cannot — the target is a hard cap. The average loss climbs steadily: 58, 58, 70, 60, 62, 68, 74 points, as NQ’s intraday ranges widened and more of the 80-point stop got realised before any time-stop could rescue the trade.
So the bar rises while the ceiling stays put. The breakeven win rate goes from 58.8% in 2020 to 63.2% in 2026, and the actual win rate never rises to meet it. The margin above breakeven, year by year: +3.3, +2.6, +2.9, +1.7, +1.0, +0.9, −4.8. It decays monotonically and then goes through the floor.
Across the whole sample the strategy operates 1.3 percentage points above its own breakeven win rate. That is the entire edge. Anything that moves the win rate by a point and a half — a volatility regime, a slightly worse fill, one extra tick of slippage — deletes it. His own numbers had a 4.0-point margin, and that gap between his margin and ours is not a disagreement about the strategy; it is what three additional years of tape did to it.
The lesson generalizes past this one system: any strategy with a fixed point target and a wider fixed point stop has a breakeven that drifts with volatility, in the direction that hurts. A percentage-based or ATR-based geometry would have held the ratio; fixed points quietly re-price the bet every year without telling you.
Part four: which parts are real, and a correction to our own first read
The drift filter carries genuine directional information. Invert the three conditions — trade the same setups on the opposite side — and the result is −$187,347 (t = −2.9). That is a strong, clean confirmation: the filter is measuring something real about the direction of the session. Requiring the pullback candle also earns its place: entering on any candle at all instead of the first counter-colour one drops the total to +$61,032 (t = +1.0).
The guardrails, though, are not load-bearing — and here we have to correct our own first pass. Our initial comparison put “15-minute trigger with guardrails” against “5-minute trigger without guardrails” and concluded the caps were saving 2026. That comparison changed two things at once. Run as a clean two-by-two:
| Reading | Total | Out-of-sample 2024+ |
|---|---|---|
| 5-min trigger, guardrails on (as written) | +$98,638 | −$16,960 |
| 5-min trigger, guardrails off | +$120,646 | −$21,500 |
| 15-min trigger, guardrails on | +$122,735 | +$22,359 |
| 15-min trigger, guardrails off | +$108,008 | +$10,631 |
With the 5-minute trigger, removing the guardrails improves the total by $22,000. With the 15-minute trigger, removing them costs $14,700. The sign of the effect flips depending on a parameter he never specifies — the interview never says whether the trigger candle is read on the 5-minute or the 15-minute chart. When a rule’s contribution changes sign based on an unrelated ambiguity, you are looking at noise, not at structure. The guardrails do smooth the curve, which genuinely matters against a trailing drawdown limit; they are risk management, not edge.
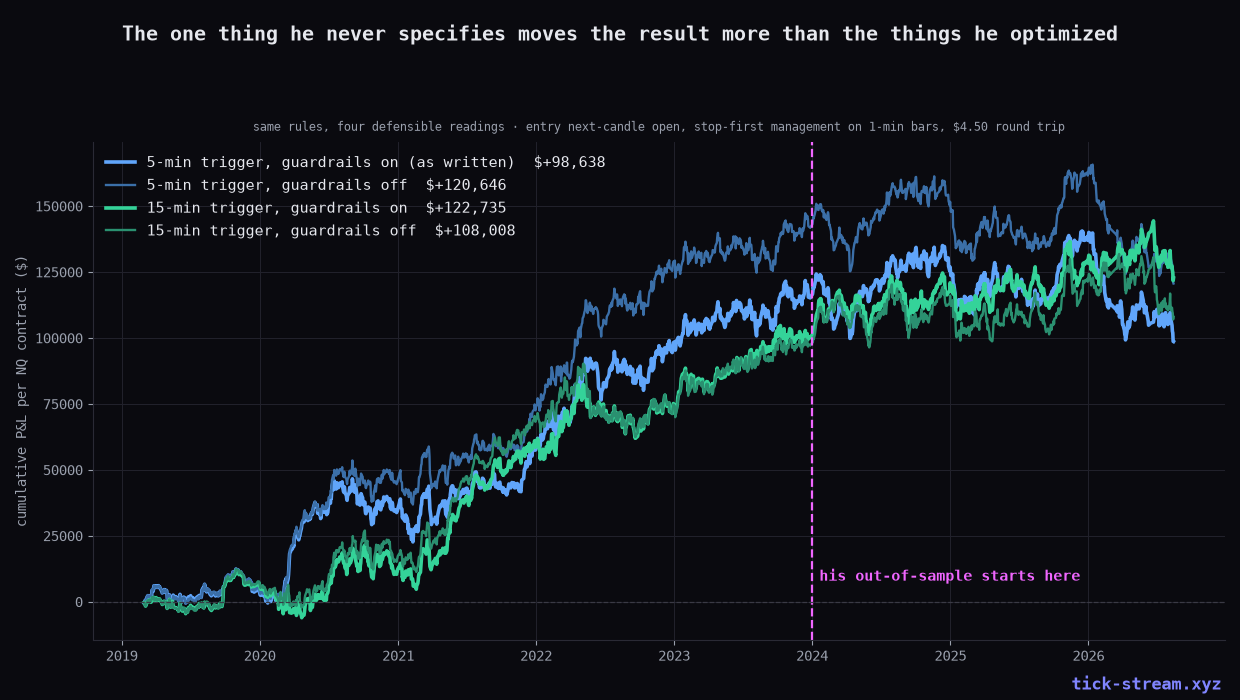
Look at the spread in that table’s right-hand column: from −$21,500 to +$22,359 depending on readings that are all faithful to the interview. The mean out-of-sample result across the four is −$1,368 — and the spread between them is thirty times the mean. Which is the honest summary of the out-of-sample period: not “it lost money,” but “whatever it did, the strategy’s unspecified details mattered more than its optimized ones.” One of the four readings is still positive after 2024. We can’t tell you it’s the right one, and neither can the interview.
Part five: the prop-firm framing
He is refreshingly direct that this is a challenge-passing tool, not a way to compound your own money: “if you try to apply this strategy on a private account, running it with your own money, this strategy is unlikely that it’s going to make you money.” He published a 20,000-run Monte Carlo giving a 49.8% chance of passing a challenge on the first attempt, 93.6% within four.
That Monte Carlo is computed from a trade distribution — and the distribution it uses is the 2020–2023 one. On the 2024-onward distribution, expectancy in three of the four readings is negative, and a Monte Carlo over negative-expectancy trades doesn’t produce a 49.8% pass rate; it produces a slow bleed with occasional lucky runs. So the caveat needs to be stronger than the one he gives: on the recent tape this is not reliably a challenge-passing tool either. That is not a knock on his honesty — he told everyone which years he fitted on, which is precisely what let us check.
Verdict
A real strategy, honestly reported, that has been decaying since 2022 and went negative in 2026. The signal is genuine (inverting it costs $187k). The reported numbers are genuine (they replicate within a few percent). The out-of-sample period is a statistical zero, the profit margin over breakeven shrank every year, and the reason is mechanical rather than mysterious: a hard-capped target against a loss that grew with volatility.
If you want to run something like this, the fix suggested by the data is straightforward — make the geometry proportional (ATR or percentage) instead of fixed points, so the breakeven win rate stops drifting away from you — but that is a different strategy and would need its own honest test, on its own out-of-sample years, before anyone trades it.
Our own live, disclosed track records are on /algos, including the paper sleeves and the drawdowns. Got a ruleset you want run through this machine? Send it over — we publish the result either way, as this article and the one where nothing survived both show.
Methodology: NQ front-month, 1-minute bars built from our own tick store, 1,806 sessions from March 2019 to 14 August 2026 (bars from 1 March 2026 onward come from our live recording rather than the converted vendor archive — the seam sits inside the weak period and is disclosed for that reason). Session VWAP anchored 09:30 ET from typical-price × volume; drift conditions evaluated on completed 15-minute boundaries using the prior bar’s data only; trigger candle read at its close, entry at the next candle’s open plus one tick of slippage; stop always resolved before target on the same bar; stop exits pay one tick, the 15:55 flat pays one tick; $4.50 round-trip commission; $20 per point (one NQ contract — his stated alternative of 10 micro NQ is the same exposure). Significance is Newey-West t on daily P&L over all 1,806 sessions including no-trade days, not per-trade. His in-sample window is quoted as 2020–2024 in one place and out-of-sample “2024 to 2 Aug 2026” in another; we split at 1 January 2024, the reading most favourable to the strategy. All performance figures attributed to him are his own and unverified. This is research, not trading advice.
Frequently asked questions
Does Matteo Conti's Drift VWAP pullback strategy work on NQ?
It worked, and then it stopped. Rebuilt exactly as described — VWAP anchored 09:30 ET, three drift conditions checked every 15 minutes, first counter-colour pullback candle, entry at the next candle's open, 80-point stop, 40-point target long and 50 short, all guardrails — it made $111,720 per contract across 2020–2023, the years he fitted the parameters on (Newey-West t = +2.5). Across his stated out-of-sample window, 2024 through August 2026, the same rules made −$16,960 with t = −0.4: statistically indistinguishable from zero. 2026 alone is −$39,374.
Did the backtest reproduce his claimed 64% win rate and average win/loss?
Almost exactly, which is unusual. He claims a 64% win rate, $866 average win and $1,300 average loss. We measured 61.2%, $818 and $1,221 across 3,757 trades on seven and a half years of NQ data. Even the detail that realised losses average well under the 80-point stop reproduces — his own arithmetic implied about 65 points and we measure 61. This is an honestly described strategy; the disagreement is not about whether he backtested it properly, it is about what happened after he stopped.
Why did a 61% win rate stop being profitable?
Because the geometry is asymmetric and only one side of it is capped. The target is a fixed 40 or 50 points, so the average win stayed pinned between 38 and 44 points for seven years. The stop is 80 points and the average realised loss grew from 58 points in 2020 to 74 in 2026 as NQ's intraday ranges expanded. That pushed the win rate needed to break even from 58.8% up to 63.2%, while the actual win rate stayed near 61%. The margin above breakeven shrank every single year — +3.3, +2.6, +2.9, +1.7, +1.0, +0.9 points — and in 2026 it went to −4.8.
Are the guardrails (max 4 trades, 2 losses, 15:55 flat) load-bearing as he says?
Not on our data, and we tested it as a clean two-by-two rather than one comparison. With the 5-minute trigger, removing all guardrails improved the total ($120,646 vs $98,638). With the 15-minute trigger, removing them made it worse ($108,008 vs $122,735). The sign of the effect flips depending on a parameter he never specifies, which is the signature of noise, not of a load-bearing rule. The guardrails smooth the equity curve — relevant for a trailing-drawdown prop account — but they are not where the expectancy comes from.
Is the drift filter itself real, or just curve fitting?
The direction is real. Inverting the drift conditions — same trades, opposite side — produces −$187,347 with t = −2.9. Something genuinely directional is being measured. Requiring the pullback candle also helps: entering on any candle instead of the first counter-colour one drops the result to +$61,032 (t = +1.0). The problem is not that the signal is empty; it is that the signal's edge per trade is smaller than the drift in the cost of being wrong.
What does this mean for the prop-firm challenge Monte Carlo he published?
His 20,000-simulation result — 49.8% probability of passing a challenge on the first attempt — is computed from the trade distribution he measured, which is a 2020–2023 distribution. Recomputed on the 2024-onward distribution, the strategy's expectancy is negative, so the pass probabilities do not carry over. He is explicit that the strategy is a challenge-passing tool rather than a way to grow your own capital, and that a funded account needs something else. Our data suggests the caveat needs to be stronger than that: on the recent tape it is not reliably a challenge-passing tool either.
Can I submit a strategy to be backtested?
Yes — send the full ruleset through tick-stream.xyz/request-market?topic=strategy. We mechanize submissions exactly as described, run them on years of real tick data with conservative fills and real costs, and publish the result whichever way it comes out.